
Residents
42.493
Last year: 2026
4001KD Tiel • Gelderland
€ 339.500 k.k.
Cost of copper (estimated): € 8.640
2% transfer tax (€ 6.790) + notary (€ 1.150) + valuation (€ 700)
Total incl. VAT: € 348.140
Purchase price /m²: € 4.140
Tussenwoning met verrassend veel comfort en verbeteringen! Deze sfeervolle tussenwoning aan één van de leukste plekjes nabij het centrum van Tiel is de afgelopen jaren op meerdere fronten aangepakt. Denk aan een nieuw dak met isolatie, een nieuwe CV- ketel (2025) en diverse isolerende maatregelen die zorgen voor meer wooncomfort en lagere energielasten (energielabel C). Met vrij uitzicht aan de voorzijde op het groen en een zonnige achtertuin op het westen is dit een woning waar je je direct thuis voelt. Hier woon je rustig, maar met alle voorzieningen letterlijk om de hoek. Indeling: Begane grond: entree, hal, meterkast en toegang tot de gezellige woonkamer. De woonkamer heeft een warme uitstraling met onder andere glas-in-lood details en een prettig zicht op het groen aan de voorzijde. De keuken is tuingericht en voorzien van een vernieuwde oven, 4-pits gaskookplaat, afzuigkap en voldoende bergruimte. De begane grond is daarnaast voorzien van een vernieuwde vloer en vloerisolatie, wat direct merkbaar is in comfort. Via een tussenhal bereik je het toilet en de achtertuin. Eerste verdieping: overloop met vaste kast en toegang tot drie slaapkamers van circa 10, 9 en 8 m². De badkamer is netjes opgefrist en voorzien van een bad met douchecombinatie, wastafel en wasmachineaansluiting. Tweede verdieping: via vlizotrap bereikbare praktische bergzolder. Tuin: de achtertuin is gelegen op het westen en biedt volop middag- en avondzon. Daarnaast is er een ruime stenen schuur en een handige achterom. Wat deze woning extra aantrekkelijk maakt: - nieuw dak met isolatie - nieuwe CV- ketel (2025) - begane grondvloer geïsoleerd - achtergevel begane grond van binnenuit geïsoleerd - nieuwe vloeren door de gehele woning - badkamer opgefrist - nieuwe oven in de keuken - kunststof kozijnen met HR+ beglazing - energielabel C - drie slaapkamers - zonnige achtertuin op het westen - vrij uitzicht aan de voorzijde op groen - op loopafstand van centrum, winkels en voorzieningen Kortom: een fijne, goed onderhouden woning waar de belangrijkste verbeteringen al zijn gedaan. Ideaal voor wie zorgeloos wil wonen op een centrale plek in Tiel.
€ 339.500
Cost of copper (estimated): € 8.640
2% transfer tax (€ 6.790) + notary (€ 1.150) + valuation (€ 700)
Total purchase (incl. p.p.): € 348.140
3,02%
Yearly
€ 16.975
Direct available
Estimated mortgage
Indicative gross monthly cost
Based on annuity and 30 year term
Indicative net monthly cost
iDisclaimer: this mortgage calculation is a simplified indication based on general assumptions. No rights can be derived from the results shown. Calculated with 10-annual interest (met NHG), automatically determined based on the price limit € 470.000. Source: 10-jaars rente uit mortgage_rates (08-06-2026 03:45).
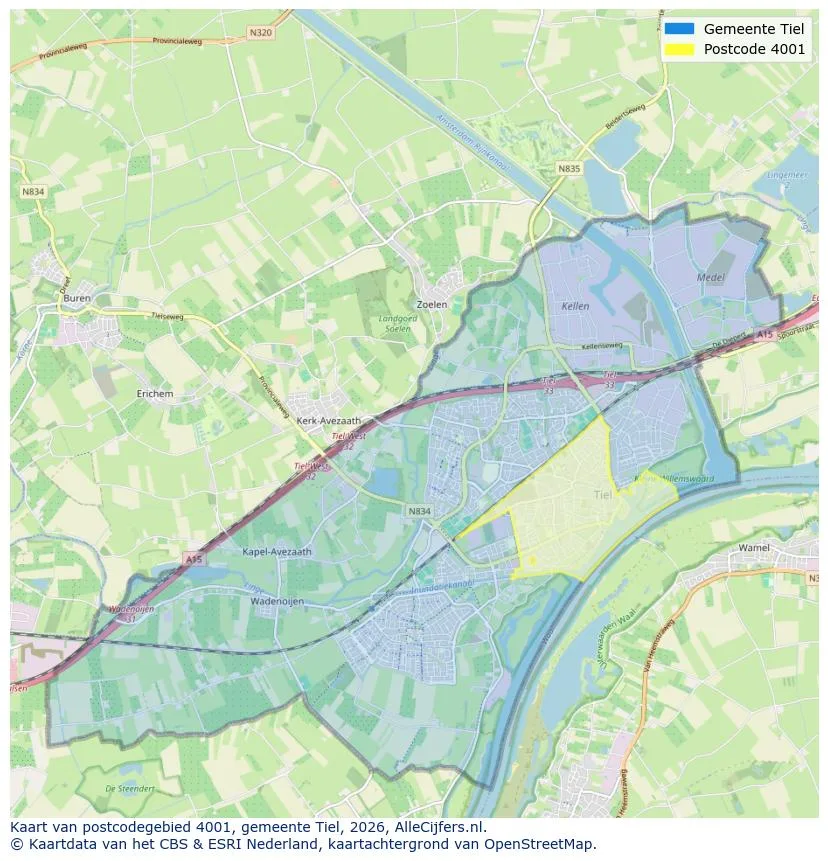
Discover where agents are active in Tiel
View current location data on residents, WOZ development, housing stock, energy consumption, business activity and safety in Tiel. In 2026 were there 42.493 residents. The average WOZ value in 2025 is EUR 358.000.
Residents
42.493
Last year: 2026
Average WOZ
EUR 358.000
Last year: 2025
Average income per person.
EUR 32.500
Source: AllNumbers
Crimes (current year)
1.841
Total registered
| Year | Residents |
|---|---|
| 2022 | 42.277 |
| 2023 | 42.604 |
| 2024 | 42.370 |
| 2025 | 42.575 |
| 2026 | 42.493 |
| Year | Average WOZ |
|---|---|
| 2021 | EUR 238.000 |
| 2022 | EUR 264.000 |
| 2023 | EUR 315.000 |
| 2024 | EUR 346.000 |
| 2025 | EUR 358.000 |
Hoger
27
Praktisch
32
Middelbaar
41
Europa
3.963
Nederland
29.505
Buiten Europa
9.107
Label C
4.627
Label B
4.514
Label A
4.005
Label D
1.446
Label G
1.043
Label E
964
Label F
928
Label A+
525
Label A++
334
Label A+++
225
Label A++++
17
Label A+++++
15
| Year | Gas (m3) | Electricity (kWh) |
|---|---|---|
| 2020 | 1.150 | 2.910 |
| 2021 | 1.310 | 2.930 |
| 2022 | 1.020 | 2.740 |
| 2023 | 860 | 2.600 |
| 2024 | 840 | 2.650 |
Hoekwoning
Gas: 940 • Electricity: 2.790
Huurwoning
Gas: 750 • Electricity: 2.030
Koopwoning
Gas: 940 • Electricity: 3.030
Appartement
Gas: 640 • Electricity: 1.800
Tussenwoning
Gas: 800 • Electricity: 2.580
Vrijstaande woning
Gas: 1.390 • Electricity: 4.160
Twee-onder-één-kap woning
Gas: 1.060 • Electricity: 3.070
Total number of company establishments: 5.185
| Period | Crimes |
|---|---|
| jan 2026 | 162 |
| jul 2025 | 155 |
| jun 2025 | 127 |
| mei 2025 | 160 |
| mrt 2025 | 190 |
| mrt 2026 | 124 |
| nov 2024 | 140 |
| nov 2025 | 137 |
| okt 2024 | 190 |
| okt 2025 | 153 |
| sep 2024 | 206 |
| sep 2025 | 194 |
These figures give an indicative picture of safety trends in the living environment of Tiel.
Short answers based on current local statistics, handy for a quick comparison of the living environment.
Tiel telt in 2026 ongeveer 42.493 inwoners.
De gemiddelde WOZ-waarde in Tiel is in 2025 circa € 358.000.
Het gemiddelde inkomen per inwoner in Tiel ligt rond € 32.500 per jaar.
Voor het huidige jaar gaat het om ongeveer 1.841 geregistreerde misdrijven. Gebruik deze cijfers als indicatie en vergelijk trends per periode.
In Tiel komt vooral "Tussenwoningen" veel voor, met ongeveer 7.189 woningen.
View more homes in this location.

4002AC Tiel
€ 425.000 k.k.
€ 3.935/m²

4001ER Tiel
€ 375.000 k.k.
€ 3.827/m²

4007HA Tiel
€ 665.000 k.k.
€ 4.263/m²

4001VL Tiel
€ 395.000 k.k.
€ 3.264/m²
4007HA Tiel
€ 425.000 k.k.
€ 3.602/m²

4007HB Tiel
€ 1.395 p/m
€ 12/m²

4007LP Tiel
€ 669.000 k.k.
€ 3.737/m²
4001KE Tiel
€ 265.000 k.k.
€ 4.015/m²
