
Residents
893
Last year: 2026
7227DL Toldijk • Gelderland
€ 395.000 k.k.
Cost of copper (estimated): € 9.750
2% transfer tax (€ 7.900) + notary (€ 1.150) + valuation (€ 700)
Total incl. VAT: € 404.750
Purchase price /m²: € 2.582
De woning op adres Zutphen-Emmerikseweg 10 Toldijk is een vrijstaande woonboerderij van circa 1910 met een totale gebruiksoppervlakte van ruim 260 m² en gelegen op een perceel van 940 m². Het wonenoppervlak bedraagt momenteel 153 m², met vier slaapkamers, een grote inpandige garage, diverse berg- en hobbyruimtes, een diepe tuin met veel privacy en vrij uitzicht. De huidige eigenaar heeft al aanzienlijke bouwkundige ingrepen uitgevoerd zoals isolatie van de kap, indeling van de bovenverdieping, voorbereiding van een nieuwe badkamer en het plaatsen van kunststof kozijnen. De woonruimtes zijn goed verlicht en bieden vrij uitzicht, met een ruime woonkeuken voorzien van gasfornuis en oven. De eerste verdieping bevat drie ruime slaapkamers met dakramen, een in voorbereiding zijnde badkamer en overloop. De zolder is bereikbaar via een vlizotrap en toont berg- en stookruimtes. De verwarming van het huis gebeurt via een Intergas HR combiketel uit 2013, met een energielabel D. De woning biedt veel mogelijkheden om verder naar eigen smaak af te werken en is ook geschikt voor beroep aan huis. De oorspronkelijke indeling van het achterhuis kan naar wens worden aangepast.
€ 395.000
Cost of copper (estimated): € 9.750
2% transfer tax (€ 7.900) + notary (€ 1.150) + valuation (€ 700)
Total purchase (incl. p.p.): € 404.750
3,02%
Yearly
€ 19.750
Direct available
Estimated mortgage
Indicative gross monthly cost
Based on annuity and 30 year term
Indicative net monthly cost
iDisclaimer: this mortgage calculation is a simplified indication based on general assumptions. No rights can be derived from the results shown. Calculated with 10-annual interest (met NHG), automatically determined based on the price limit € 470.000. Source: 10-jaars rente uit mortgage_rates (08-06-2026 03:45).
Douche, wastafel, en ligbad
Elektra en stromend water
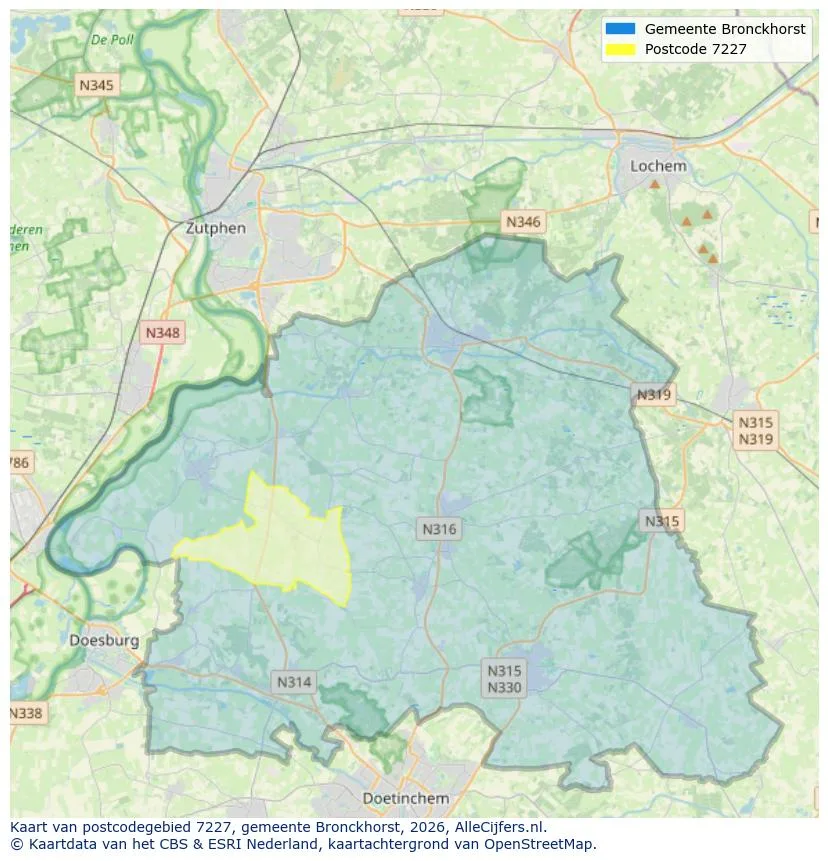
Discover where agents are active in Toldijk
View current location data on residents, WOZ development, housing stock, energy consumption, business activity and safety in Toldijk. In 2026 were there 893 residents. The average WOZ value in 2025 is EUR 469.375.
Residents
893
Last year: 2026
Average WOZ
EUR 469.375
Last year: 2025
Average income per person.
EUR 30.636
Source: AllNumbers
Crimes (current year)
13
Total registered
| Year | Residents |
|---|---|
| 2021 | 890 |
| 2022 | 895 |
| 2023 | 915 |
| 2024 | 910 |
| 2025 | 890 |
| 2026 | 893 |
| Year | Average WOZ |
|---|---|
| 2021 | EUR 351.500 |
| 2022 | EUR 388.847 |
| 2023 | EUR 448.062 |
| 2024 | EUR 465.358 |
| 2025 | EUR 469.375 |
Hoger
70
Praktisch
50
Middelbaar
300
Europa
20
Nederland
840
Buiten Europa
35
Label G
107
Label C
75
Label F
44
Label B
37
Label A
34
Label D
34
Label E
26
Label A+
4
Label A+++
2
Label A++++
2
Label A++
1
Label A+++++
0
| Year | Gas (m3) | Electricity (kWh) |
|---|---|---|
| 2020 | 1.737 | 3.938 |
| 2021 | 1.974 | 3.913 |
| 2022 | 1.571 | 3.806 |
| 2023 | 1.271 | 3.561 |
| 2024 | 1.227 | 3.578 |
Hoekwoning
Gas: 398 • Electricity: 1.256
Huurwoning
Gas: 1.133 • Electricity: 2.761
Koopwoning
Gas: 1.304 • Electricity: 3.743
Appartement
Gas: 1.300 • Electricity: 3.132
Tussenwoning
Gas: 363 • Electricity: 1.142
Vrijstaande woning
Gas: 1.411 • Electricity: 3.986
Twee-onder-één-kap woning
Gas: 1.139 • Electricity: 3.328
Total number of company establishments: 170
| Period | Crimes |
|---|---|
| jan 2026 | 0 |
| jul 2025 | 0 |
| jun 2025 | 1 |
| mei 2025 | 0 |
| mrt 2025 | 2 |
| mrt 2026 | 1 |
| nov 2024 | 3 |
| nov 2025 | 2 |
| okt 2024 | 0 |
| okt 2025 | 2 |
| sep 2024 | 2 |
| sep 2025 | 0 |
These figures give an indicative picture of safety trends in the living environment of Toldijk.
Short answers based on current local statistics, handy for a quick comparison of the living environment.
Toldijk telt in 2026 ongeveer 893 inwoners.
De gemiddelde WOZ-waarde in Toldijk is in 2025 circa € 469.375.
Het gemiddelde inkomen per inwoner in Toldijk ligt rond € 30.636 per jaar.
Voor het huidige jaar gaat het om ongeveer 13 geregistreerde misdrijven. Gebruik deze cijfers als indicatie en vergelijk trends per periode.
In Toldijk komt vooral "Vrijstaande woningen" veel voor, met ongeveer 175 woningen.
View more homes in this location.
7227DW Toldijk
€ 419.500 k.k.
€ 3.040/m²

7227NG Toldijk
€ 795.000 k.k.
€ 5.599/m²

7227DV Toldijk
€ 385.000 k.k.
€ 3.632/m²

7227NJ Toldijk
€ 795.000 k.k.
€ 0/m²

7227DA Toldijk
Price upon request
