Residents
5.900
Last year: 2026
7651AS Tubbergen • Overijssel
€ 389.000 k.k.
Cost of copper (estimated): € 9.630
2% transfer tax (€ 7.780) + notary (€ 1.150) + valuation (€ 700)
Total incl. VAT: € 398.630
Purchase price /m²: € 4.228
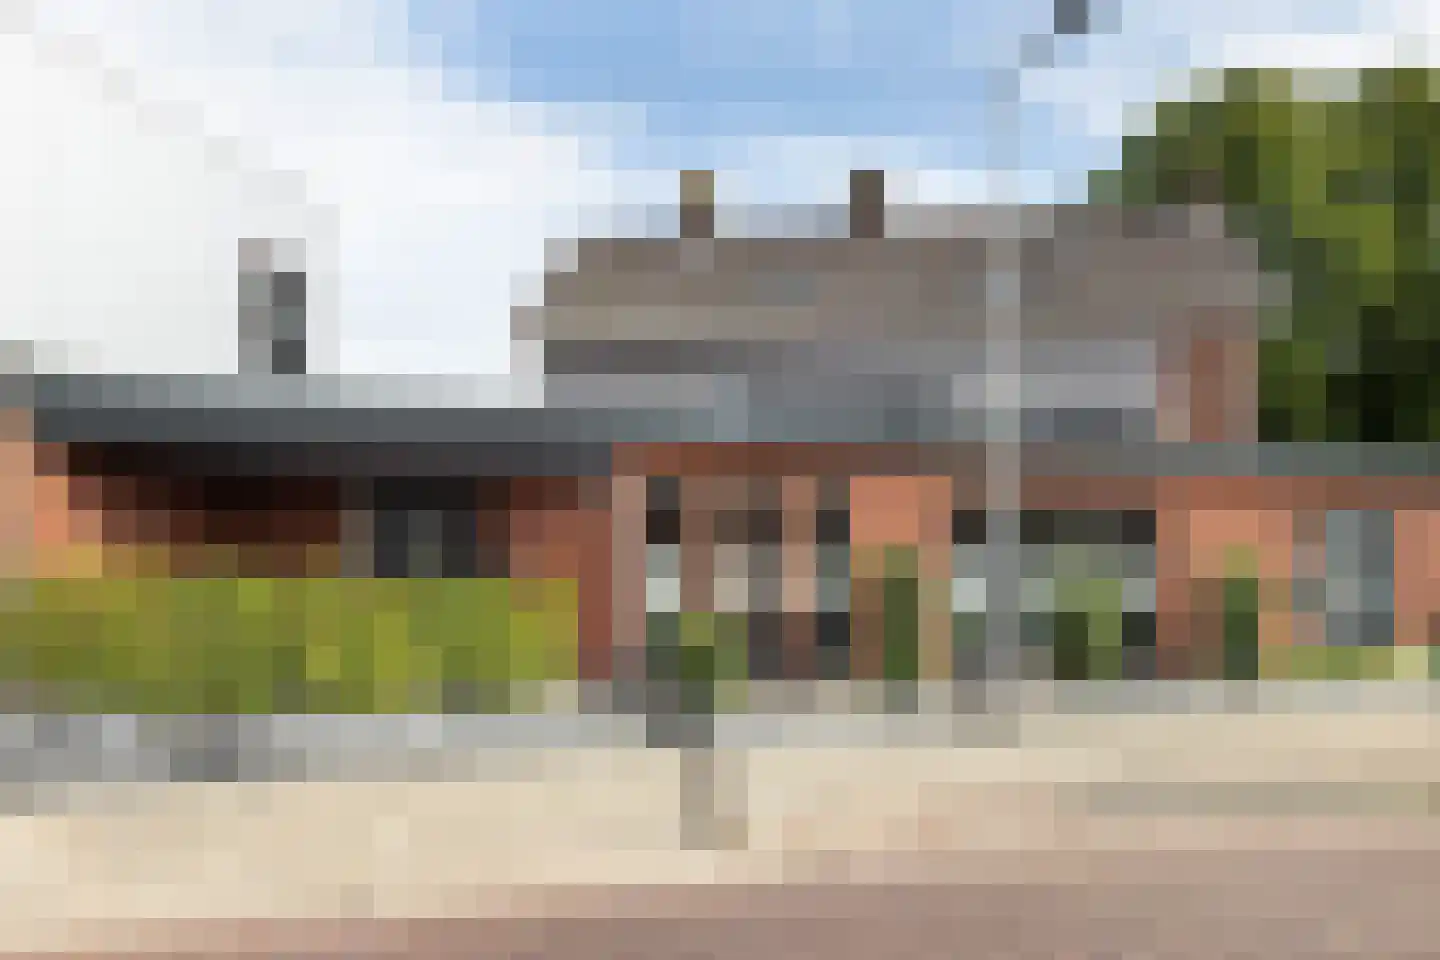
Molenstraat 11 in Tubbergen biedt een instapklaar, energiezuinig en gelijkvloers appartement met ruimte en comfort. Het recent vernieuwde gebouw uit 1965 biedt moderne faciliteiten zoals een warmtepompinstallatie en vloerverwarming in een luxe ambiance van 92 m² woonoppervlak. De ligging, aan het hart van de gezellige Tubbergen met toegang tot winkels en horeca, maakt het wonen comfortabel en centraal. Binnen staan vooral een ruime woonkamer met open keuken, badkamer met inloopdouche en een inpandige garage op de begane grond uit.
€ 389.000
Cost of copper (estimated): € 9.630
2% transfer tax (€ 7.780) + notary (€ 1.150) + valuation (€ 700)
Total purchase (incl. p.p.): € 398.630
2,78%
Yearly
€ 19.450
Direct available
Estimated mortgage
Indicative gross monthly cost
Based on annuity and 30 year term
Indicative net monthly cost
iDisclaimer: this mortgage calculation is a simplified indication based on general assumptions. No rights can be derived from the results shown. Calculated with 10-annual interest (met NHG), automatically determined based on the price limit € 470.000. Source: 10-jaars rente uit mortgage_rates (12-05-2026 03:45).
Inloopdouche, toilet, vloerverwarming, en wastafel
Elektrische deur, elektra en verwarming
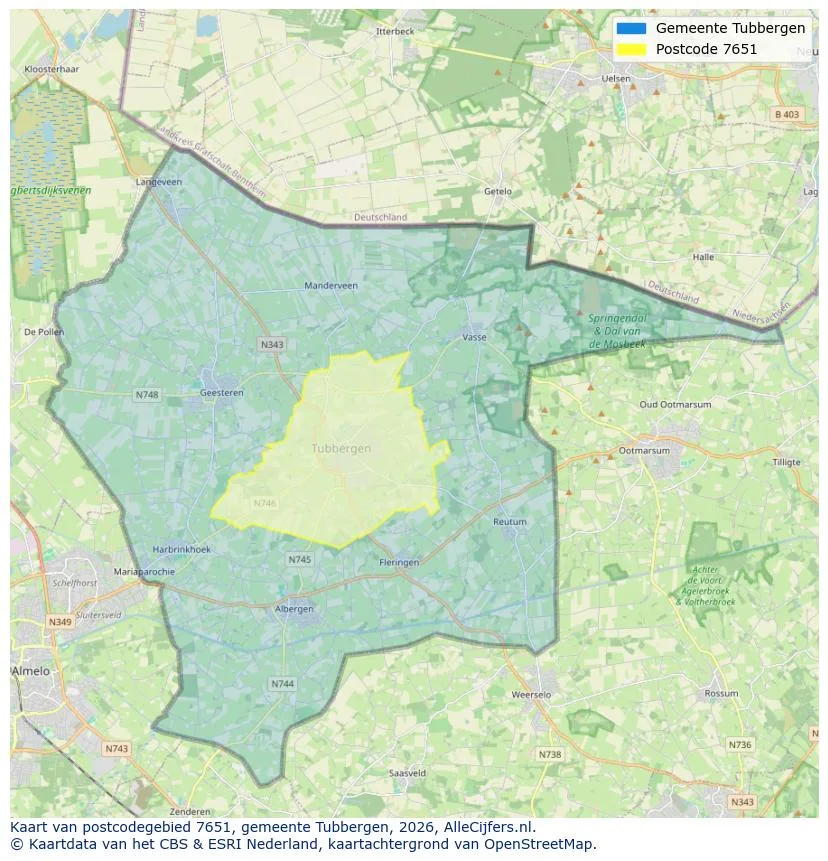
View the location and discover the brokers in this region
View current location data on residents, WOZ development, housing stock, energy consumption, business activity and safety in Tubbergen. In 2026 were there 5.900 residents. The average WOZ value in 2025 is EUR 391.000.
Residents
5.900
Last year: 2026
Average WOZ
EUR 391.000
Last year: 2025
Average income per person.
EUR 32.600
Source: AllNumbers
Crimes (current year)
97
Total registered
| Year | Residents |
|---|---|
| 2021 | 5.768 |
| 2022 | 5.778 |
| 2023 | 5.850 |
| 2024 | 5.860 |
| 2025 | 5.900 |
| 2026 | 5.900 |
| Year | Average WOZ |
|---|---|
| 2021 | EUR 293.000 |
| 2022 | EUR 331.000 |
| 2023 | EUR 372.000 |
| 2024 | EUR 383.000 |
| 2025 | EUR 391.000 |
Hoger
1.230
Praktisch
1.090
Middelbaar
1.980
Europa
260
Nederland
5.345
Buiten Europa
295
Label A
814
Label C
605
Label B
434
Label D
216
Label A+++
135
Label F
115
Label G
88
Label A++
62
Label A+
60
Label E
57
Label A++++
46
Label A+++++
0
| Year | Gas (m3) | Electricity (kWh) |
|---|---|---|
| 2020 | 1.400 | 3.220 |
| 2021 | 1.640 | 3.280 |
| 2022 | 1.290 | 3.000 |
| 2023 | 1.050 | 2.960 |
| 2024 | 960 | 3.050 |
Hoekwoning
Gas: 970 • Electricity: 2.740
Huurwoning
Gas: 780 • Electricity: 2.060
Koopwoning
Gas: 1.210 • Electricity: 3.460
Appartement
Gas: 730 • Electricity: 1.990
Tussenwoning
Gas: 900 • Electricity: 2.500
Vrijstaande woning
Gas: 1.380 • Electricity: 3.970
Twee-onder-één-kap woning
Gas: 1.120 • Electricity: 3.080
Total number of company establishments: 685
| Period | Crimes |
|---|---|
| jan 2026 | 6 |
| jul 2025 | 8 |
| jun 2025 | 4 |
| mei 2025 | 9 |
| mrt 2025 | 12 |
| mrt 2026 | 11 |
| nov 2024 | 13 |
| nov 2025 | 7 |
| okt 2024 | 6 |
| okt 2025 | 11 |
| sep 2024 | 21 |
| sep 2025 | 7 |
These figures give an indicative picture of safety trends in the living environment of Tubbergen.
Short answers based on current local statistics, handy for a quick comparison of the living environment.
Tubbergen telt in 2026 ongeveer 5.900 inwoners.
De gemiddelde WOZ-waarde in Tubbergen is in 2025 circa € 391.000.
Het gemiddelde inkomen per inwoner in Tubbergen ligt rond € 32.600 per jaar.
Voor het huidige jaar gaat het om ongeveer 97 geregistreerde misdrijven. Gebruik deze cijfers als indicatie en vergelijk trends per periode.
In Tubbergen komt vooral "Vrijstaande woningen" veel voor, met ongeveer 776 woningen.
View more homes in this location.

7651EH Tubbergen
€ 639.000 k.k.
€ 2.766/m²
7651GA Tubbergen
€ 415.000 k.k.
€ 3.029/m²

7651BP Tubbergen
€ 469.000 k.k.
€ 3.693/m²
7651EB Tubbergen
€ 745.000 k.k.
€ 4.027/m²

7651DA Tubbergen
€ 745.000 k.k.
€ 4.331/m²

7651AD Tubbergen
€ 520.000 k.k.
€ 3.421/m²

7651GK Tubbergen
€ 389.000 k.k.
€ 2.903/m²

7651GP Tubbergen
€ 1.075.000 k.k.
€ 4.594/m²
