
Residents
9.710
Last year: 2025
3645HN Vinkeveen • Utrecht

For this property, no detailed description is available yet.
€ 475.000
Cost of copper (estimated): € 11.350
2% transfer tax (€ 9.500) + notary (€ 1.150) + valuation (€ 700)
Total purchase (incl. p.p.): € 486.350
3,04%
Yearly
€ 23.750
Direct available
Estimated mortgage
Indicative gross monthly cost
Based on annuity and 30 year term
Indicative net monthly cost
iDisclaimer: this mortgage calculation is a simplified indication based on general assumptions. No rights can be derived from the results shown. Calculated with 10-annual interest (zonder NHG), automatically determined based on the price limit € 470.000. Source: 10-jaars rente uit mortgage_rates (04-05-2026 03:45). For non-NHG, an 80% mortgage of the market value has been used in this indication.
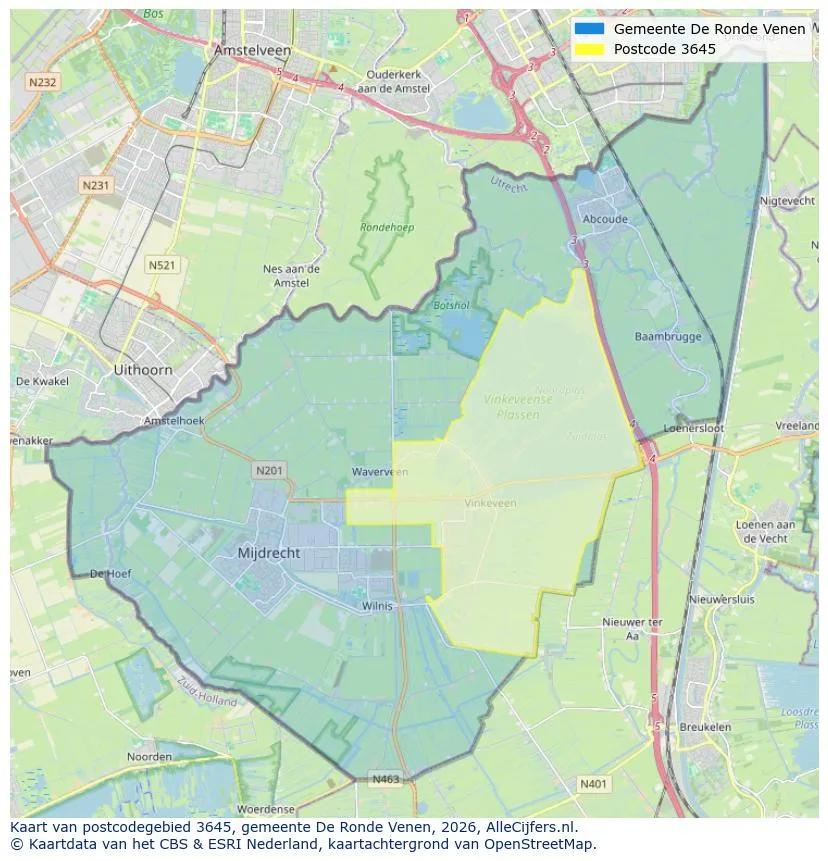
Discover where agents are active in Vinkeveen
View current location data on residents, WOZ development, housing stock, energy consumption, business activity and safety in Vinkeveen. In 2025 were there 9.710 residents. The average WOZ value in 2025 is EUR 583.000.
Residents
9.710
Last year: 2025
Average WOZ
EUR 583.000
Last year: 2025
Average income per person.
EUR 42.100
Source: AllNumbers
Crimes (current year)
224
Total registered
| Year | Residents |
|---|---|
| 2021 | 9.490 |
| 2022 | 9.480 |
| 2023 | 9.545 |
| 2024 | 9.600 |
| 2025 | 9.710 |
| Year | Average WOZ |
|---|---|
| 2021 | EUR 434.000 |
| 2022 | EUR 474.000 |
| 2023 | EUR 557.000 |
| 2024 | EUR 555.000 |
| 2025 | EUR 583.000 |
Hoger
2.660
Praktisch
1.560
Middelbaar
2.960
Europa
630
Nederland
7.920
Buiten Europa
1.160
Label C
1.232
Label A
1.193
Label B
745
Label D
336
Label G
243
Label F
195
Label E
179
Label A+
39
Label A+++
30
Label A++
24
Label A++++
6
Label A+++++
1
| Year | Gas (m3) | Electricity (kWh) |
|---|---|---|
| 2020 | 1.320 | 3.070 |
| 2021 | 1.500 | 3.210 |
| 2022 | 1.170 | 3.000 |
| 2023 | 1.010 | 2.850 |
| 2024 | 970 | 2.900 |
Hoekwoning
Gas: 1.010 • Electricity: 2.570
Huurwoning
Gas: 820 • Electricity: 1.950
Koopwoning
Gas: 1.100 • Electricity: 3.290
Appartement
Gas: 650 • Electricity: 1.850
Tussenwoning
Gas: 850 • Electricity: 2.540
Vrijstaande woning
Gas: 1.520 • Electricity: 4.250
Twee-onder-één-kap woning
Gas: 1.200 • Electricity: 3.360
Total number of company establishments: 1.825
| Period | Crimes |
|---|---|
| jan 2025 | 25 |
| jan 2026 | 9 |
| jul 2025 | 26 |
| jun 2025 | 21 |
| mei 2025 | 19 |
| mrt 2025 | 12 |
| nov 2024 | 26 |
| nov 2025 | 19 |
| okt 2024 | 17 |
| okt 2025 | 18 |
| sep 2024 | 19 |
| sep 2025 | 19 |
These figures give an indicative picture of safety trends in the living environment of Vinkeveen.
Short answers based on current local statistics, handy for a quick comparison of the living environment.
Vinkeveen telt in 2025 ongeveer 9.710 inwoners.
De gemiddelde WOZ-waarde in Vinkeveen is in 2025 circa € 583.000.
Het gemiddelde inkomen per inwoner in Vinkeveen ligt rond € 42.100 per jaar.
Voor het huidige jaar gaat het om ongeveer 224 geregistreerde misdrijven. Gebruik deze cijfers als indicatie en vergelijk trends per periode.
In Vinkeveen komt vooral "Tussenwoningen" veel voor, met ongeveer 1.429 woningen.
View more homes in this location.

3645KW Vinkeveen
€ 669.000 k.k.

3645AR Vinkeveen
€ 585.000 k.k.

3645WG Vinkeveen
€ 539.000 k.k.

3645CK Vinkeveen
€ 2.300 p/m
€ 26/m²

3645JS Vinkeveen
€ 600.000 k.k.

3645AG Vinkeveen
€ 2.850.000 k.k.

3645KA Vinkeveen
€ 595.000 k.k.

3645BB Vinkeveen
€ 285.000 k.k.
