Residents
16.145
Last year: 2025
2291DD Wateringen • Zuid-Holland
€ 365.000 k.k.
Cost of copper (estimated): € 9.150
2% transfer tax (€ 7.300) + notary (€ 1.150) + valuation (€ 700)
Total incl. VAT: € 374.150
Purchase price /m²: € 5.530
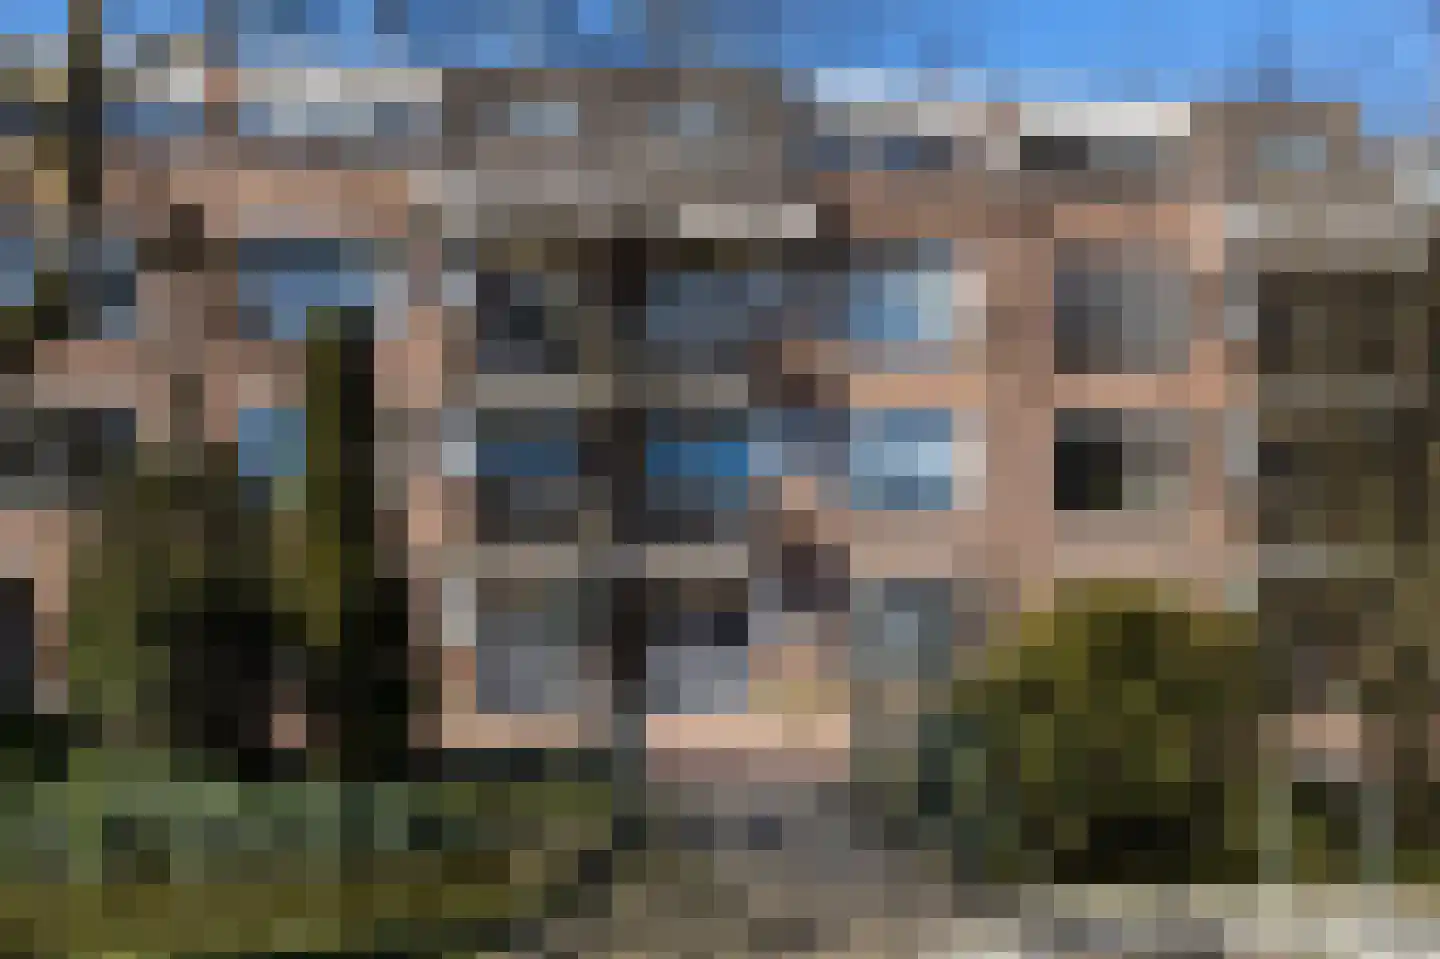
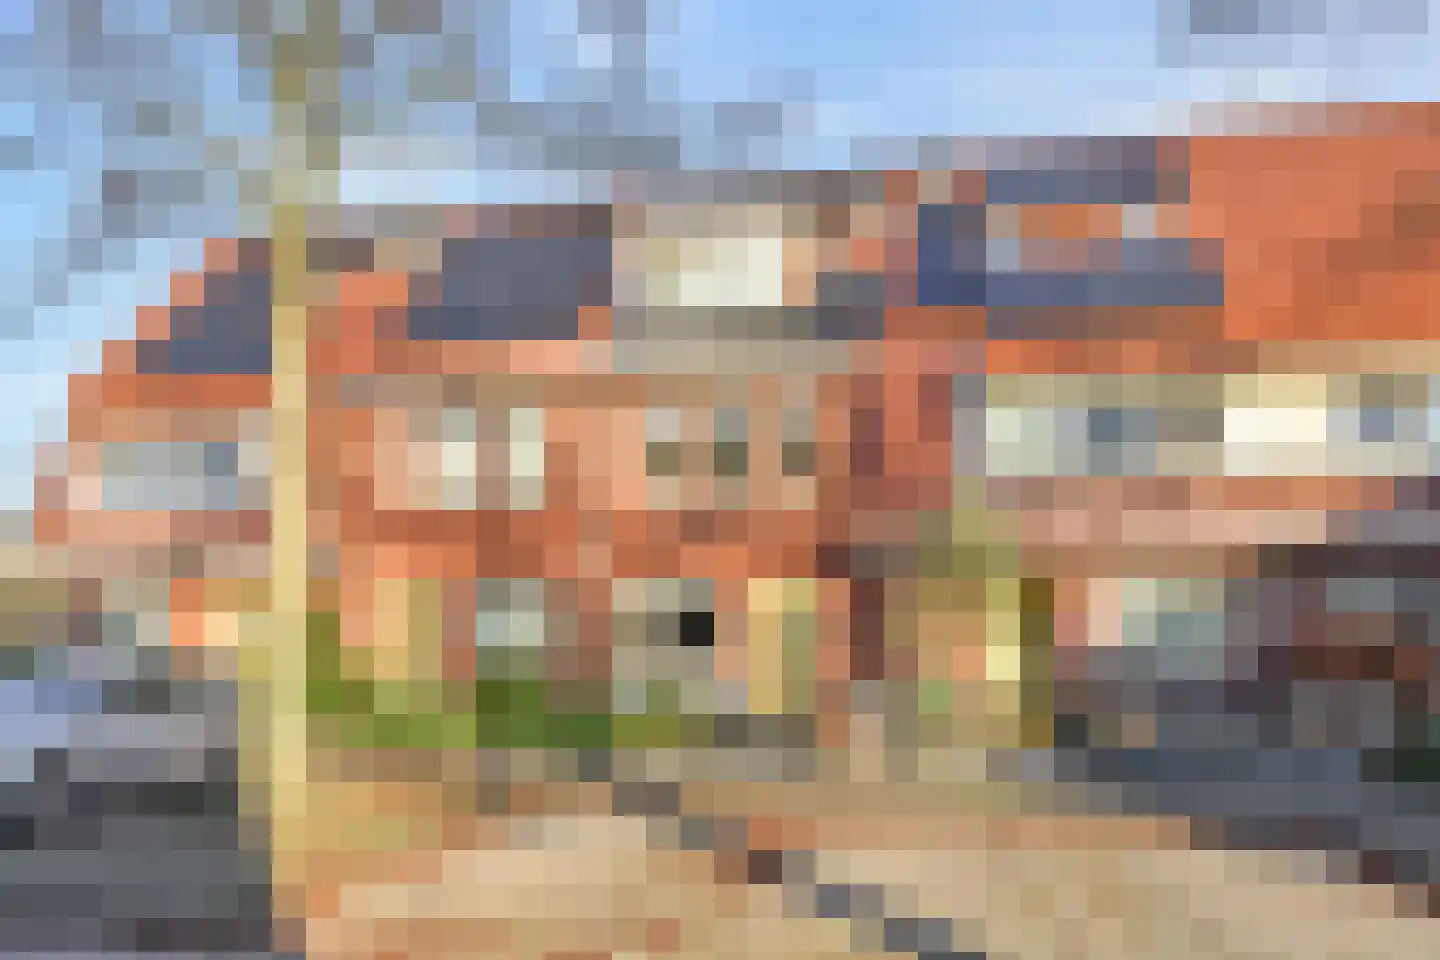
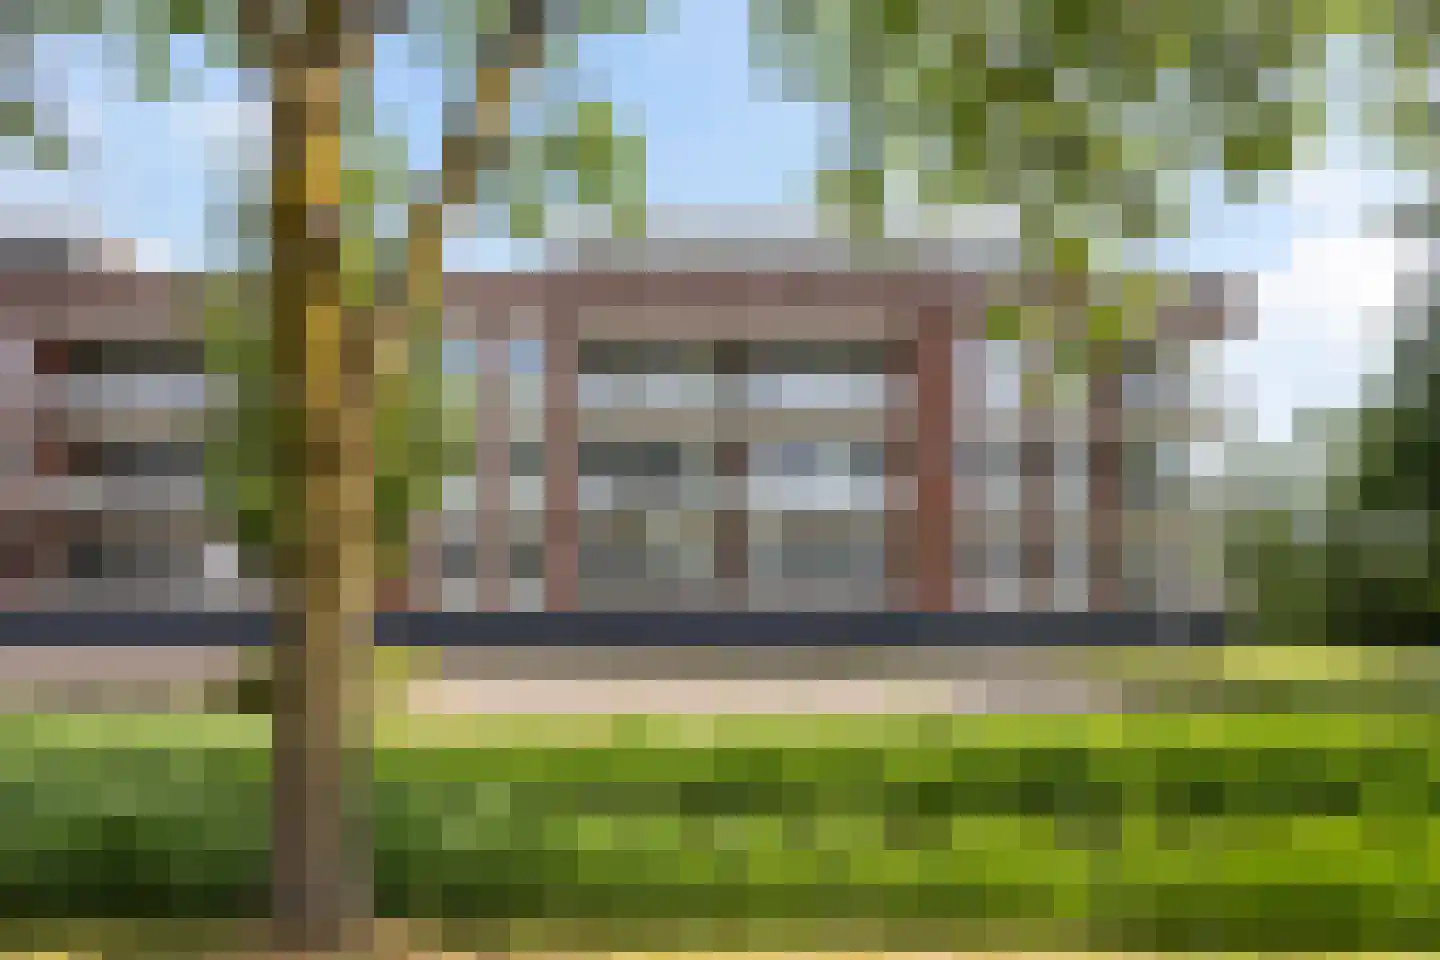
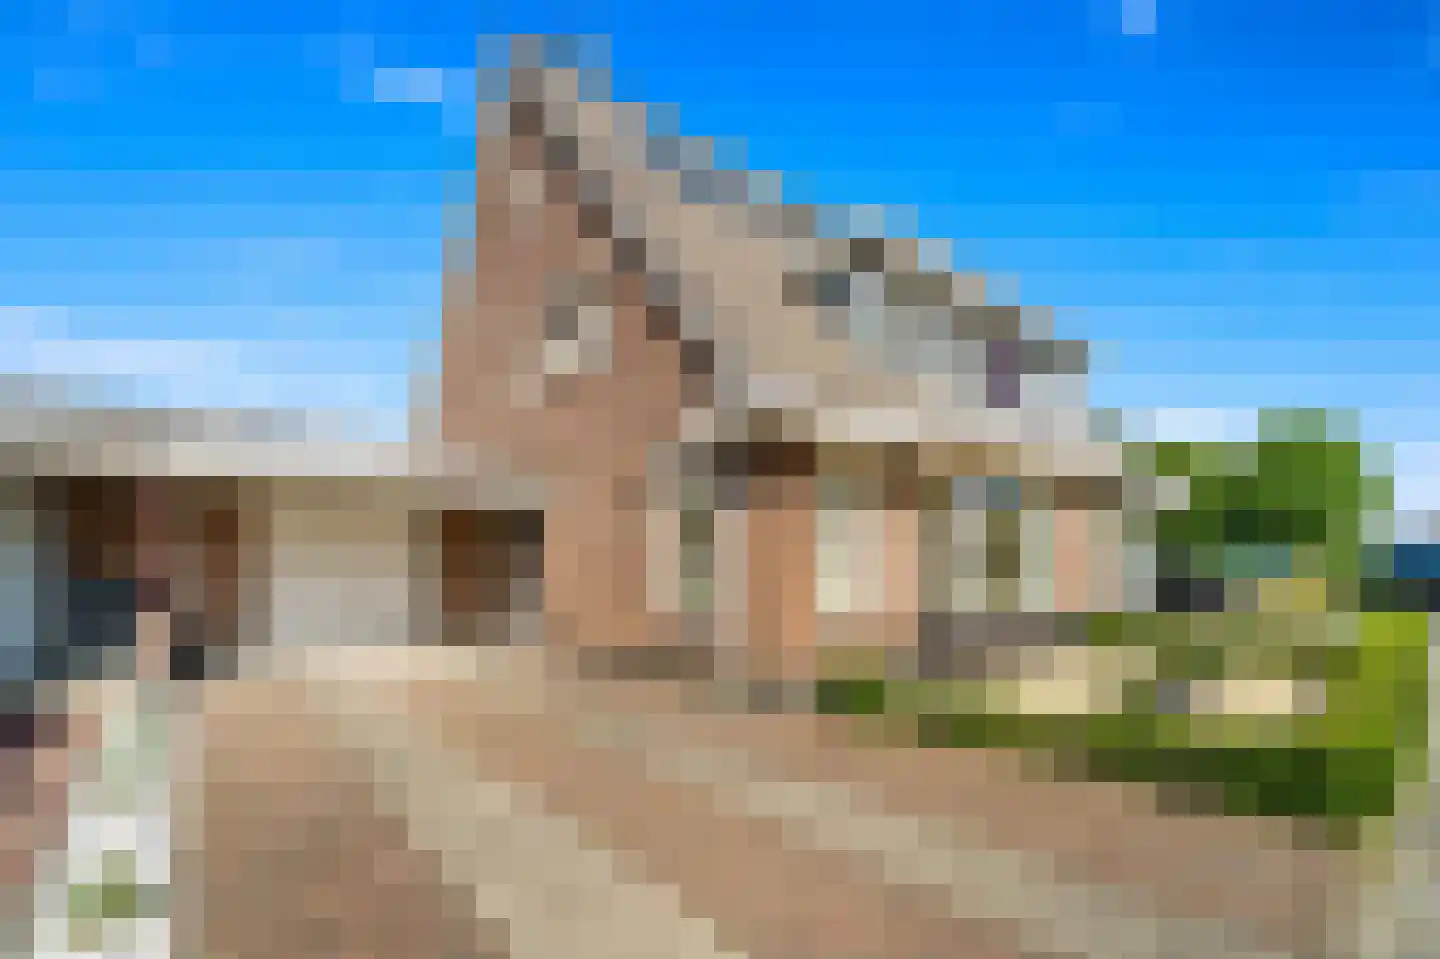
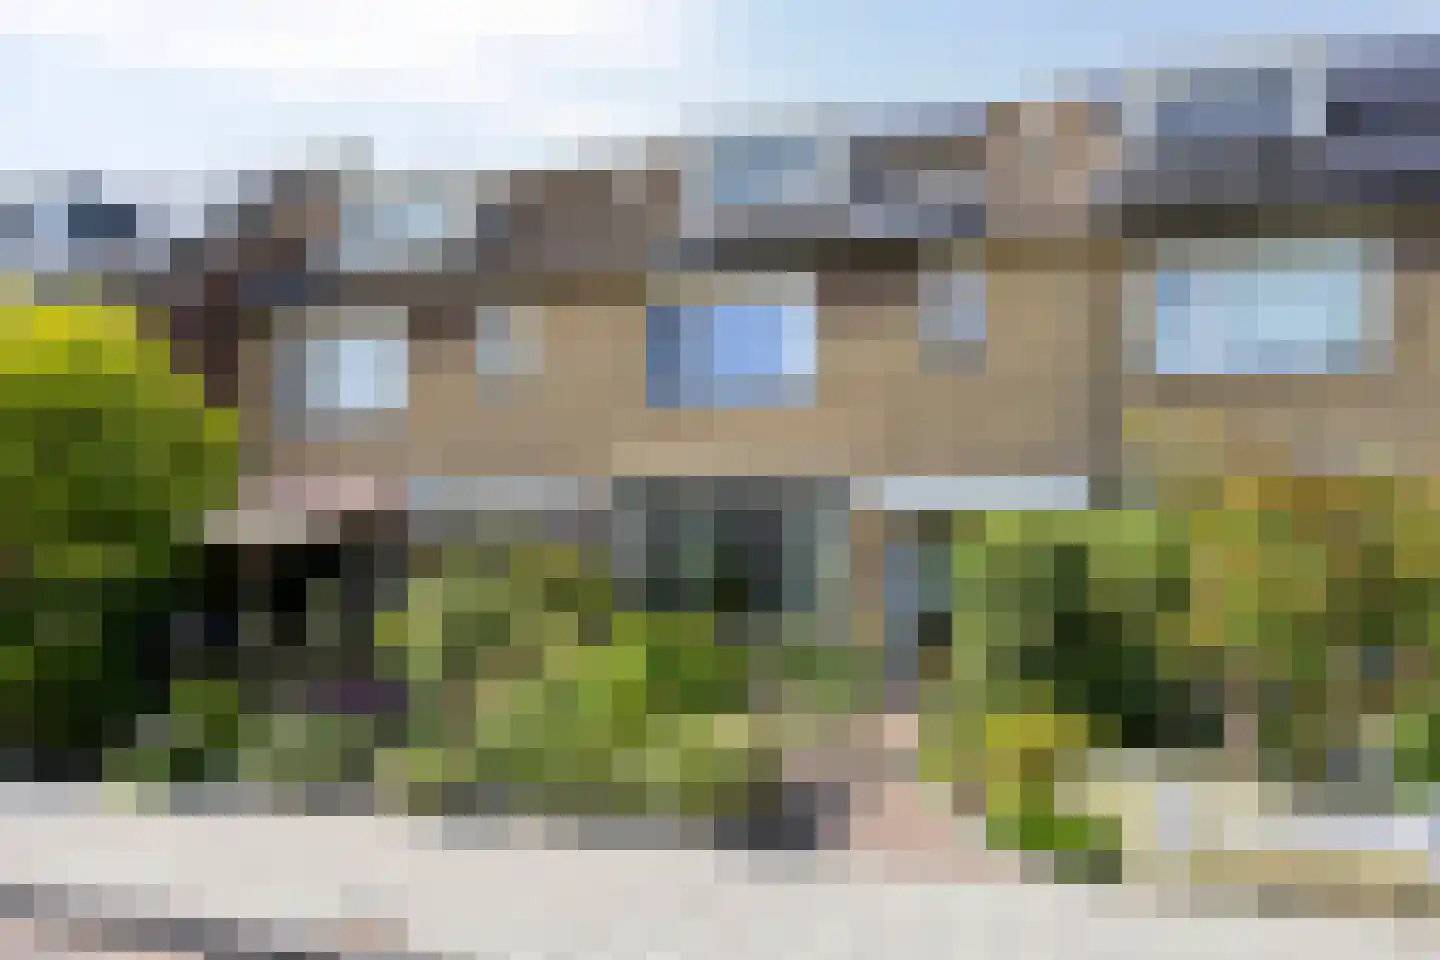
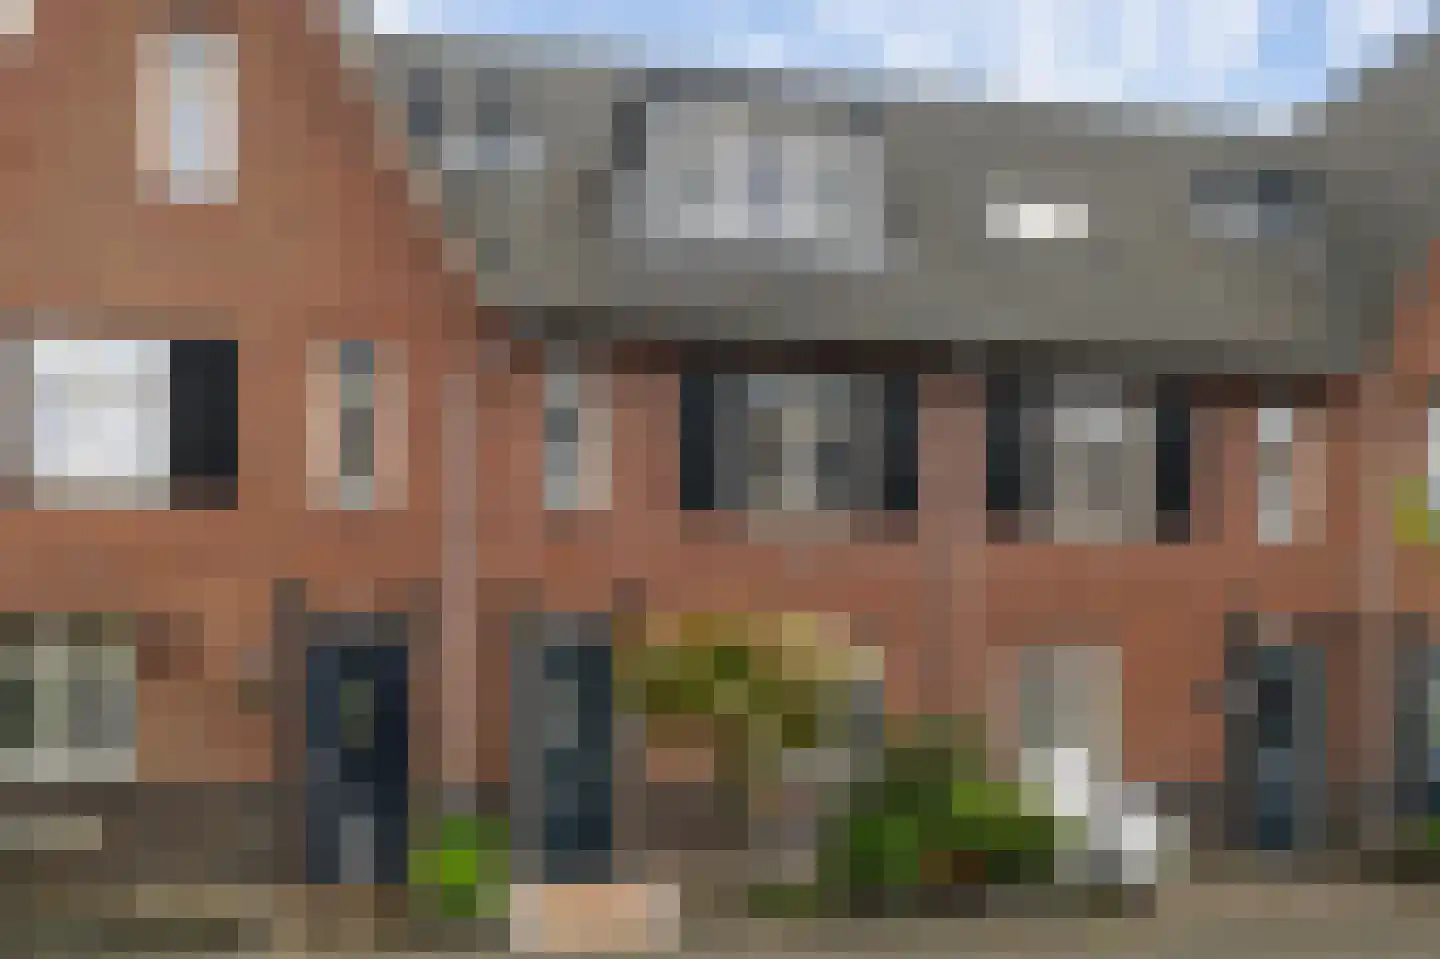
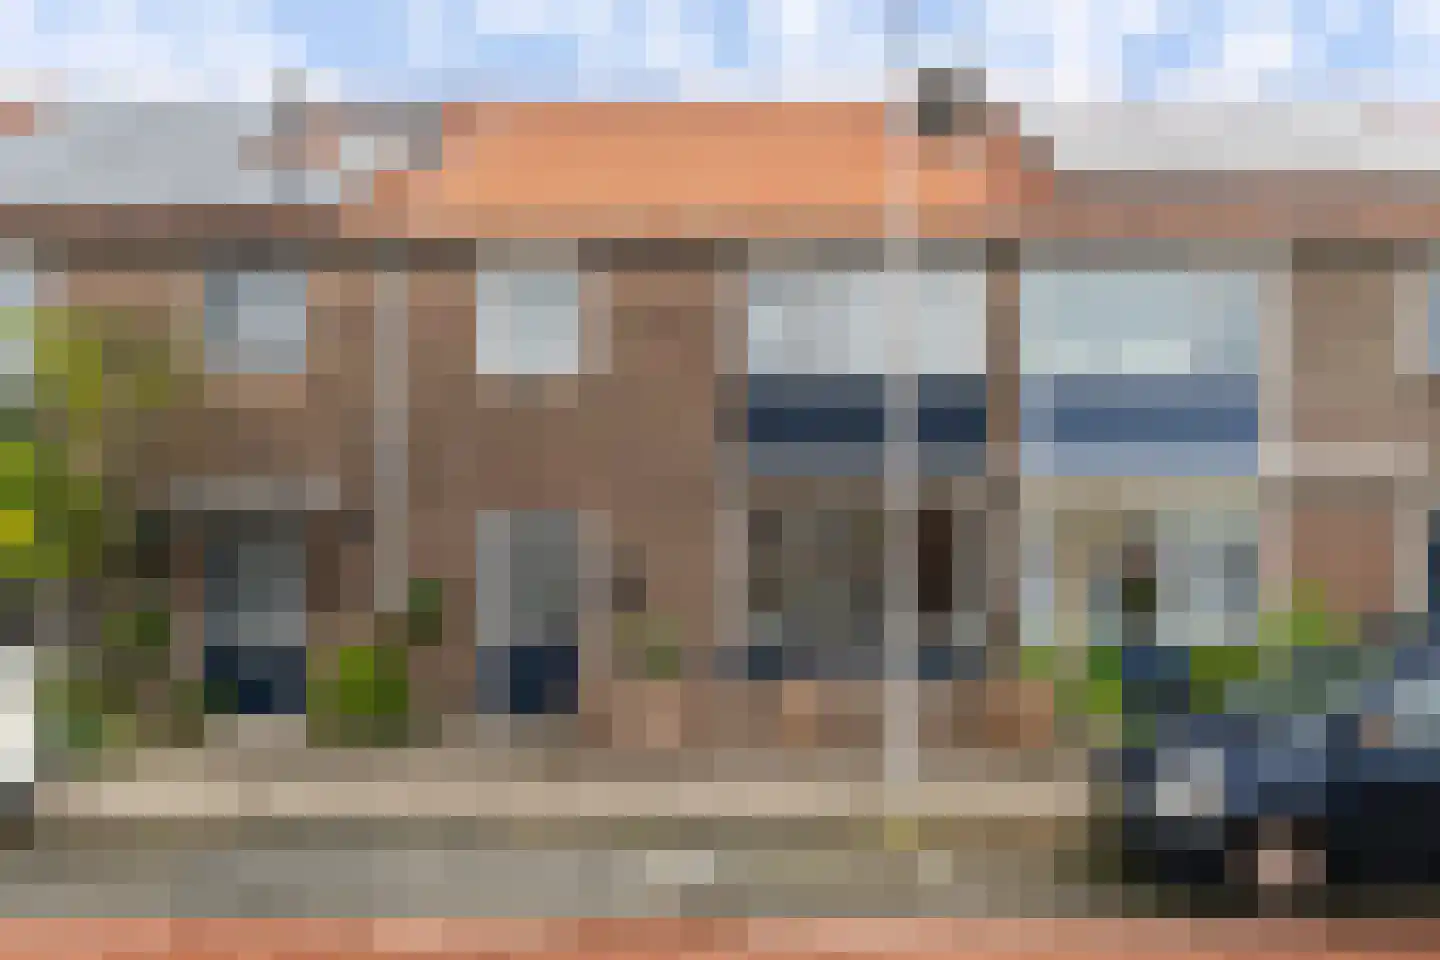
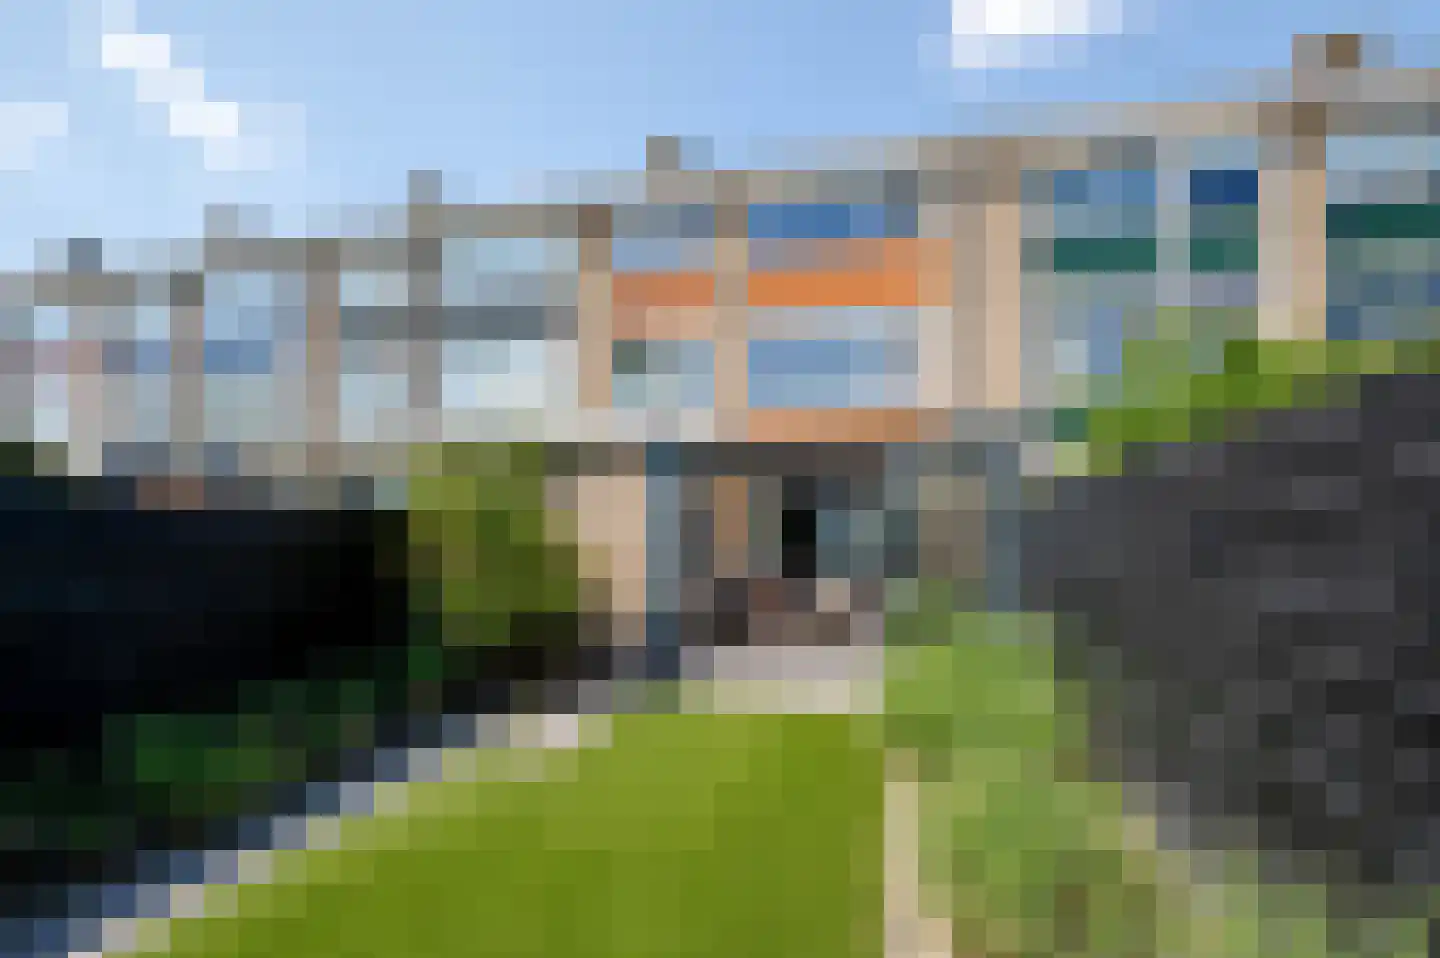
Bakkershof 64 in Wateringen is een ruim 3-kamerappartement op een uitstekende locatie, op steenworp afstand van het gezellige centrum. Gelegen op de derde verdieping beschikt de woning over een zonnig balkon en een eigen berging op de begane grond. Vanuit de woonkamer en vanaf het balkon geniet je van een fraai vrij uitzicht op de karakteristieke St. Jan de Doperkerk. Een licht appartement met een praktische indeling en volop mogelijkheden om het geheel naar eigen smaak verder af te werken. Dit leuke appartement maakt deel uit van het kleinschalige en goed onderhouden appartementencomplex ‘De Bakkershof’, gebouwd in 1988. Via de afgesloten entree met bellentableau, trappenhuis en lift bereik je het appartement op de derde verdieping. De entree van de woning geeft toegang tot de hal met meterkast en toegang tot alle vertrekken. De lichte en ruime woonkamer met aansluitend een aparte eethoek van circa 25 m² biedt direct toegang tot het zonnige balkon, waar je dankzij de ligging op het zuidoosten volop geniet van de zon en het vrije uitzicht. De eigentijdse keuken is voorzien van een 4-pits gaskookplaat, afzuigkap, oven, vaatwasser en combi koelkast. Vanuit de keuken bereik je een praktische separate ruimte met opstelplaats voor de cv-ketel en aansluitingen voor de wasmachine en droger, welke tevens uitstekend gebruikt kan worden als provisie- of voorraadkast. Aan de voorzijde van het appartement bevindt zich de ruime hoofdslaapkamer van circa 14 m². De tweede slaapkamer van circa 4,5 m² is bereikbaar vanuit de woonkamer en is perfect te gebruiken als werk-, slaap- of hobbykamer. De badkamer is ingericht met een inloopdouche, wastafelmeubel en radiator. Daarnaast beschikt de woning over een separate moderne toiletruimte met fonteintje. De woning is volledig geïsoleerd, grotendeels voorzien van dubbel glas en heeft energielabel B. Er is een actieve Vereniging van Eigenaren, met een maandelijkse bijdrage van € 172,--. Met een gebruiksoppervlakte van circa 66 m² biedt dit appartement alles voor comfortabel wonen. De praktische indeling, fijne lichtinval, het vrije uitzicht en de centrale ligging maken dit tot een bijzonder aantrekkelijk geheel. Zie jij jezelf al wonen aan de Bakkershof 64 in Wateringen? Plan dan snel een bezichtiging en ontdek het zelf! In de koopovereenkomst zal standaard een ouderdomsclausule worden opgenomen, omdat deze woning ouder dan 20 jaar is. En omdat de woning voor 1990 is gebouwd, wordt er eveneens standaard een asbestclausule opgenomen. Tevens is voor deze woning de niet-zelfbewoningsclausule van toepassing. Deze woning komt in aanmerking voor de starterslening van de gemeente Westland. De starterslening is een aanvullende lening van maximaal € 30.000,-. De eerste drie jaar betaal je geen rente of aflossing. Na drie jaar betaal je naar draagkracht rente en aflossing. Meer informatie is te vinden op gemeentewestland.nl. Interesse in dit huis? Schakel direct je eigen NVM-aankoopmakelaar in. Jouw NVM-aankoopmakelaar komt op voor jouw belang en bespaart je tijd, geld en zorgen.
€ 365.000
Cost of copper (estimated): € 9.150
2% transfer tax (€ 7.300) + notary (€ 1.150) + valuation (€ 700)
Total purchase (incl. p.p.): € 374.150
3,02%
Yearly
€ 18.250
Direct available
Estimated mortgage
Indicative gross monthly cost
Based on annuity and 30 year term
Indicative net monthly cost
iDisclaimer: this mortgage calculation is a simplified indication based on general assumptions. No rights can be derived from the results shown. Calculated with 10-annual interest (met NHG), automatically determined based on the price limit € 470.000. Source: 10-jaars rente uit mortgage_rates (08-06-2026 03:45).
Inloopdouche, wastafel, en wastafelmeubel
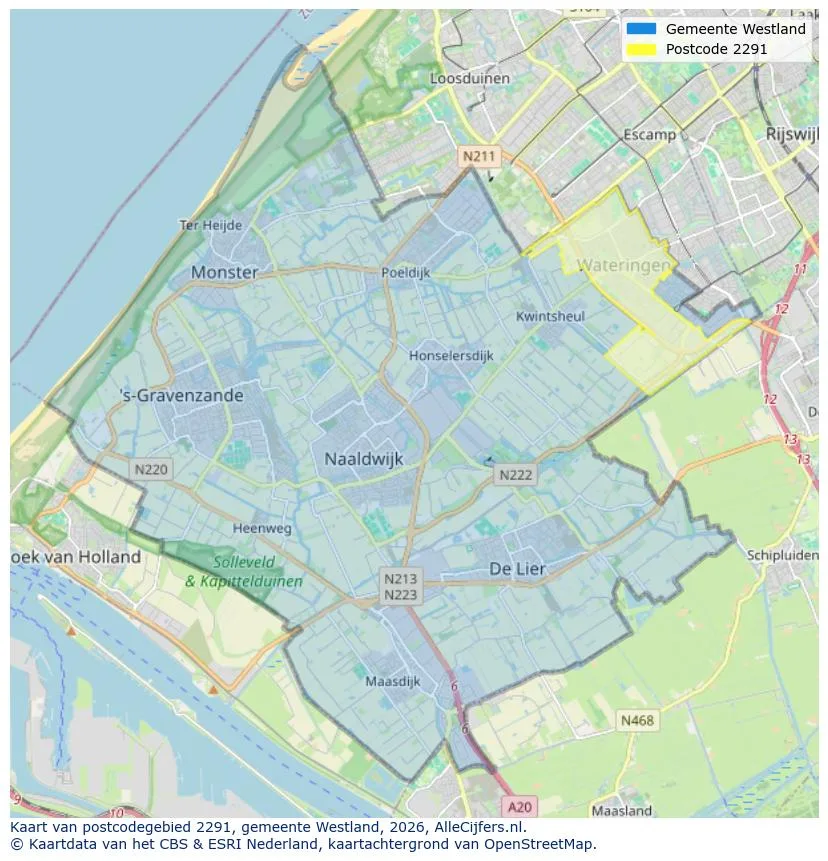
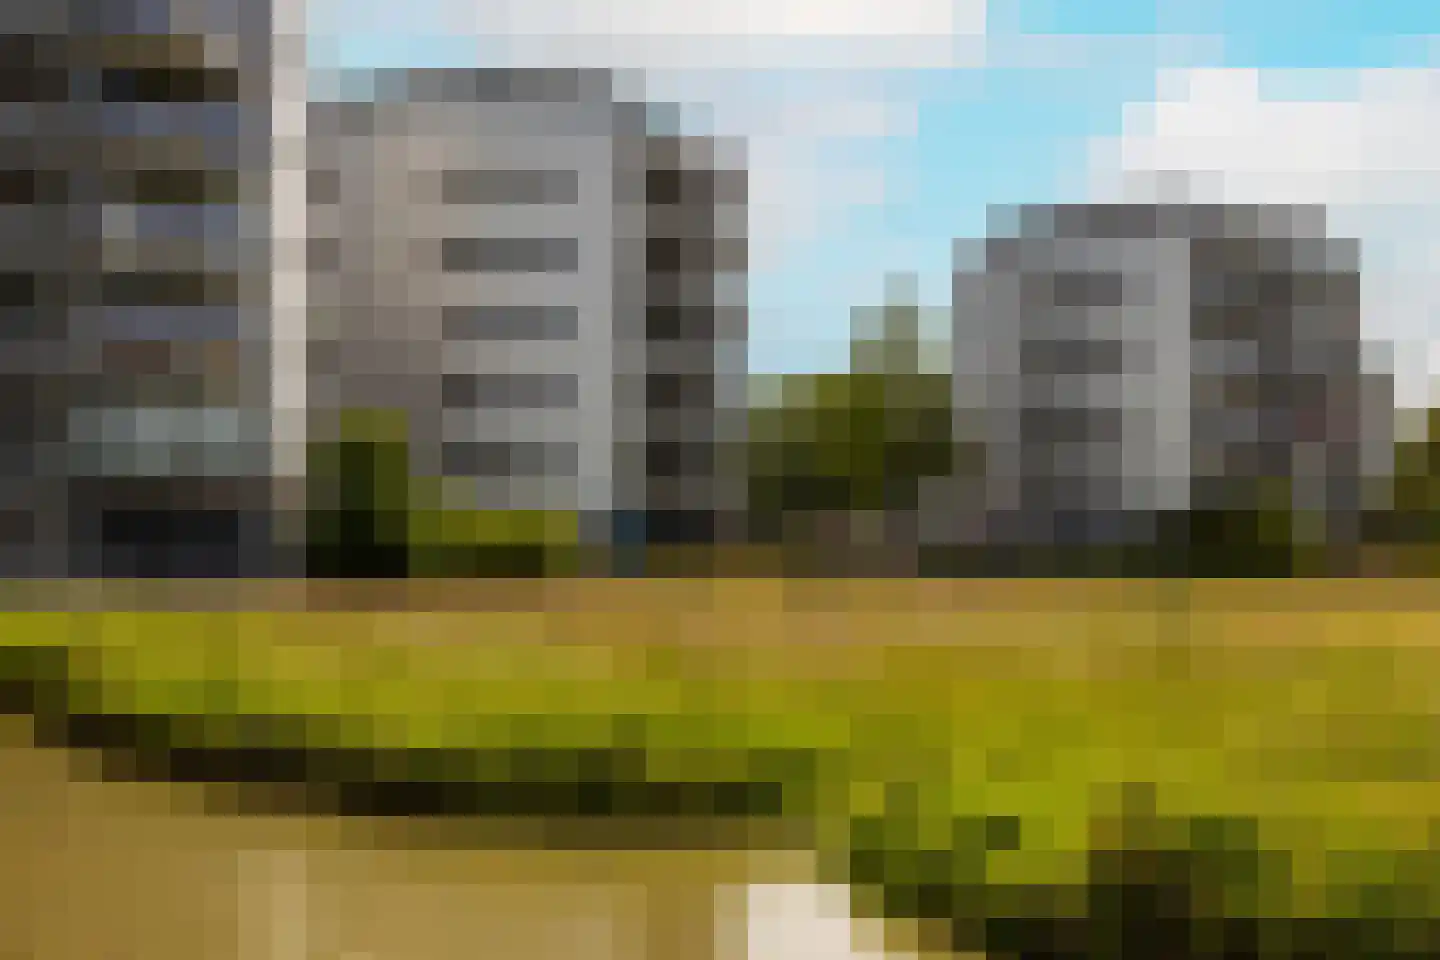
Spatial overview of the work area in Wateringen
View current location data on residents, WOZ development, housing stock, energy consumption, business activity and safety in Wateringen. In 2025 were there 16.145 residents. The average WOZ value in 2025 is EUR 448.000.
Residents
16.145
Last year: 2025
Average WOZ
EUR 448.000
Last year: 2025
Average income per person.
EUR 34.600
Source: AllNumbers
Crimes (current year)
613
Total registered
| Year | Residents |
|---|---|
| 2021 | 16.105 |
| 2022 | 16.150 |
| 2023 | 16.335 |
| 2024 | 16.245 |
| 2025 | 16.145 |
| Year | Average WOZ |
|---|---|
| 2021 | EUR 330.000 |
| 2022 | EUR 361.000 |
| 2023 | EUR 415.000 |
| 2024 | EUR 432.000 |
| 2025 | EUR 448.000 |
Hoger
3.520
Praktisch
2.980
Middelbaar
5.350
Europa
1.265
Nederland
12.020
Buiten Europa
2.865
Label A
2.830
Label C
2.020
Label B
1.252
Label D
286
Label E
267
Label F
245
Label G
158
Label A+
149
Label A++
58
Label A+++
52
Label A++++
14
Label A+++++
5
| Year | Gas (m3) | Electricity (kWh) |
|---|---|---|
| 2020 | 980 | 2.860 |
| 2021 | 1.110 | 2.890 |
| 2022 | 850 | 2.680 |
| 2023 | 770 | 2.520 |
| 2024 | 760 | 2.580 |
Hoekwoning
Gas: 890 • Electricity: 2.850
Huurwoning
Gas: 650 • Electricity: 1.910
Koopwoning
Gas: 820 • Electricity: 2.810
Appartement
Gas: 560 • Electricity: 1.720
Tussenwoning
Gas: 760 • Electricity: 2.640
Vrijstaande woning
Gas: 1.400 • Electricity: 4.340
Twee-onder-één-kap woning
Gas: 1.120 • Electricity: 3.370
Total number of company establishments: 2.605
| Period | Crimes |
|---|---|
| jan 2025 | 54 |
| jan 2026 | 37 |
| jul 2025 | 57 |
| jun 2025 | 45 |
| mei 2025 | 57 |
| mrt 2025 | 52 |
| nov 2024 | 61 |
| nov 2025 | 59 |
| okt 2024 | 54 |
| okt 2025 | 52 |
| sep 2024 | 73 |
| sep 2025 | 44 |
These figures give an indicative picture of safety trends in the living environment of Wateringen.
Short answers based on current local statistics, handy for a quick comparison of the living environment.
Wateringen telt in 2025 ongeveer 16.145 inwoners.
De gemiddelde WOZ-waarde in Wateringen is in 2025 circa € 448.000.
Het gemiddelde inkomen per inwoner in Wateringen ligt rond € 34.600 per jaar.
Voor het huidige jaar gaat het om ongeveer 613 geregistreerde misdrijven. Gebruik deze cijfers als indicatie en vergelijk trends per periode.
In Wateringen komt vooral "Tussenwoningen" veel voor, met ongeveer 3.109 woningen.
View more homes in this location.
2291ZC Wateringen
€ 625.000 k.k.
€ 5.000/m²
2291AL Wateringen
€ 515.000 k.k.
€ 5.659/m²
2292DC Wateringen
€ 698.000 k.k.
€ 4.562/m²
2291GV Wateringen
€ 530.000 k.k.
€ 4.206/m²
2291EJ Wateringen
€ 415.000 k.k.
€ 4.611/m²
2291ZN Wateringen
€ 625.000 k.k.
€ 4.960/m²
2291AV Wateringen
€ 498.500 k.k.
€ 4.840/m²
2291CD Wateringen
€ 650.000 k.k.
€ 3.988/m²
