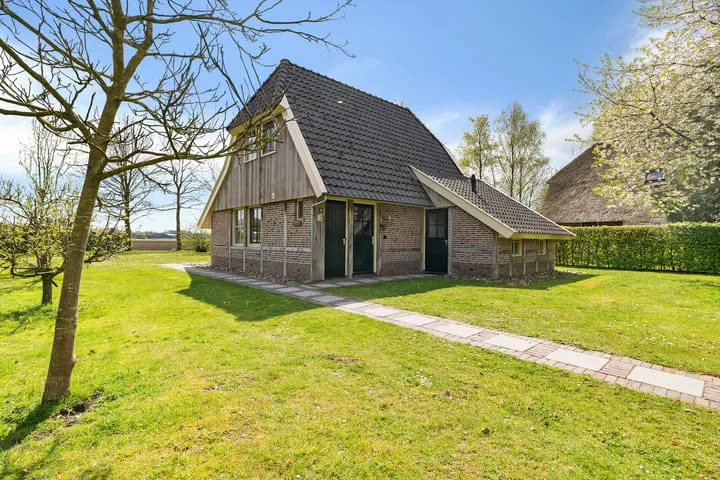
Houses sold in Witteveen

View 3 sold houses in Witteveen

Connected to: Vastgoed Nederland NVM Makelaars

On this page you will find recently sold homes in Witteveen. Use this overview to better estimate selling prices, popular neighborhoods, and the local housing supply before you choose a real estate agent. Also view the current housing supply with 8 houses in Witteveen.

Selection

Search and filter homes

Set your preferences and discover homes that suit you.

Total supply 240.836
Filters

Set price, area and other characteristics. Adjust a filter or click on Show homes. Location changes directly above.

Reset filters

You search for

  • Place Witteveen
  • Status Sold

Sell your house in Witteveen? Compare real estate agents

View recent sales and receive free quotes from local real estate agents. Compare more than 16 real estate agents in Witteveen.

Free request a quote

  • Quotes in Witteveen
  • Non-binding
  • Personal
  • Compare free rates

Selling your own home in Witteveen? Compare real estate agents in Witteveen or view the best real estate agents in Witteveen as a reference for your choice.

Compare multiple quotes

Real estate agents make sharper offers when they know you're comparing — ask for quotes for sale or purchase.

Frequently asked questions about sold homes in Witteveen

Short answers about housing prices, sold homes and comparing real estate agents in Witteveen.

Residential and neighborhood statistics in Witteveen

View current location data on residents, WOZ development, housing stock, energy consumption, business activity and safety in Witteveen. In 2025 were there 600 residents. The average WOZ value in 2025 is EUR 369.000.

These figures help to better assess and compare the housing stock in Witteveen with recent sold homes. Orient yourself then on suitable top real estate agents in Witteveen for sales advice in this region.

Residents

600

Last year: 2025

Average WOZ

EUR 369.000

Last year: 2025

Average income per person.

EUR 33.400

Source: AllNumbers

Crimes (current year)

13

Total registered

Demographics and WOZ development

Inhabitants per year

Inhabitants per year in Witteveen
Year Residents
2021 555
2022 555
2023 585
2024 600
2025 600

Annual WOZ value

WOZ value per year in Witteveen
Year Average WOZ
2021 EUR 269.000
2022 EUR 291.000
2023 EUR 322.000
2024 EUR 347.000
2025 EUR 369.000

Composition of residents

Age build-up

65+: 155 0-15: 75 15-25: 45 25-45: 130 45-65: 200

Education level

Hoger

140

Praktisch

90

Middelbaar

250

Origin of residents (2025)

Europa

40

Nederland

535

Buiten Europa

25

Housing stock and construction periods

Types of homes

Appartementen 23
Vrijstaande woningen 177
Twee-onder-één-kap woningen 56

Construction period of buildings

Voor 1700 0
1700 tot 1900 1
1900 tot 1925 0
1925 tot 1950 101
1950 tot 1970 31
1970 tot 1980 15
1980 tot 1990 36
1990 tot 2000 34
2000 tot 2010 32
2010 tot 2020 218
2020 en later 9

Energy and sustainability

Energy label distribution

Label B

240

Label G

77

Label A

70

Label C

45

Label F

27

Label D

14

Label E

3

Label A+

3

Label A++++

2

Label A++

1

Label A+++

1

Label A+++++

0

Average energy consumption per year

Average energy consumption per year in Witteveen
Year Gas (m3) Electricity (kWh)
2020 1.810 3.550
2021 1.970 3.600
2022 1.500 3.310
2023 1.160 3.080
2024 1.080 3.140

Consumption per house type

Huurwoning

Gas: 980 • Electricity: 2.120

Koopwoning

Gas: 1.200 • Electricity: 3.330

Appartement

Gas: 900 • Electricity: 2.350

Vrijstaande woning

Gas: 1.260 • Electricity: 3.430

Twee-onder-één-kap woning

Gas: 920 • Electricity: 2.290

Business activity in Witteveen (2025)

Handel en HORECA 20
Nijverheid en energie 20
Zakelijke dienstverlening 15
Overheid, onderwijs en zorg 15
Landbouw, bosbouw en visserij 35
Vervoer, informatie en communicatie 5
Financiele diensten en onroerendgoed 5
Cultuur, recreatie en overige diensten 10

Total number of company establishments: 120

Recent crime statistics

Recent crime statistics in Witteveen
Period Crimes
jan 2025 1
jan 2026 1
jul 2025 0
jun 2025 0
mei 2025 0
mrt 2025 2
nov 2024 1
nov 2025 2
okt 2024 1
okt 2025 1
sep 2024 0
sep 2025 3

These figures give an indicative picture of safety trends in the living environment of Witteveen.

Frequently asked questions about living in Witteveen

Short answers based on current local statistics, handy for a quick comparison of the living environment.

Hoeveel inwoners heeft Witteveen?

Witteveen telt in 2025 ongeveer 600 inwoners.

Wat is de gemiddelde WOZ-waarde in Witteveen?

De gemiddelde WOZ-waarde in Witteveen is in 2025 circa € 369.000.

Wat is het gemiddelde inkomen per inwoner in Witteveen?

Het gemiddelde inkomen per inwoner in Witteveen ligt rond € 33.400 per jaar.

Hoe veilig is wonen in Witteveen?

Voor het huidige jaar gaat het om ongeveer 13 geregistreerde misdrijven. Gebruik deze cijfers als indicatie en vergelijk trends per periode.

Welke woningtypen komen het meest voor in Witteveen?

In Witteveen komt vooral "Vrijstaande woningen" veel voor, met ongeveer 177 woningen.

Receive free, non-binding quotes

Compare multiple real estate agents and choose the best match.