
Residents
13.485
Last year: 2025
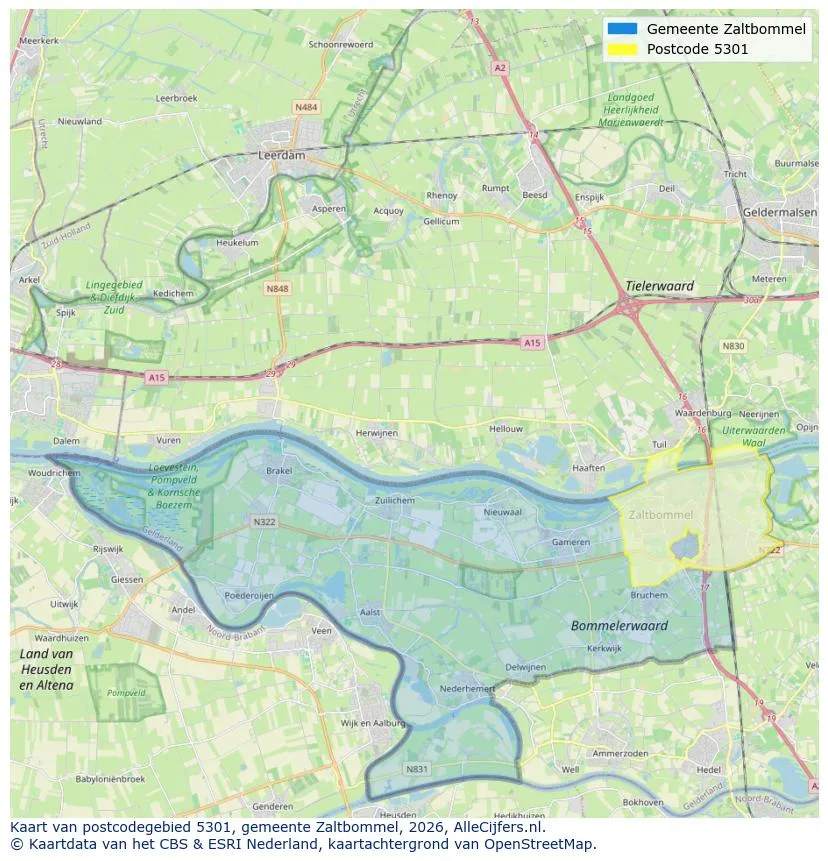
5301JN Zaltbommel • Gelderland
€ 425.000 k.k.
Cost of copper (estimated): € 10.350
2% transfer tax (€ 8.500) + notary (€ 1.150) + valuation (€ 700)
Total incl. VAT: € 435.350
Purchase price /m²: € 3.899
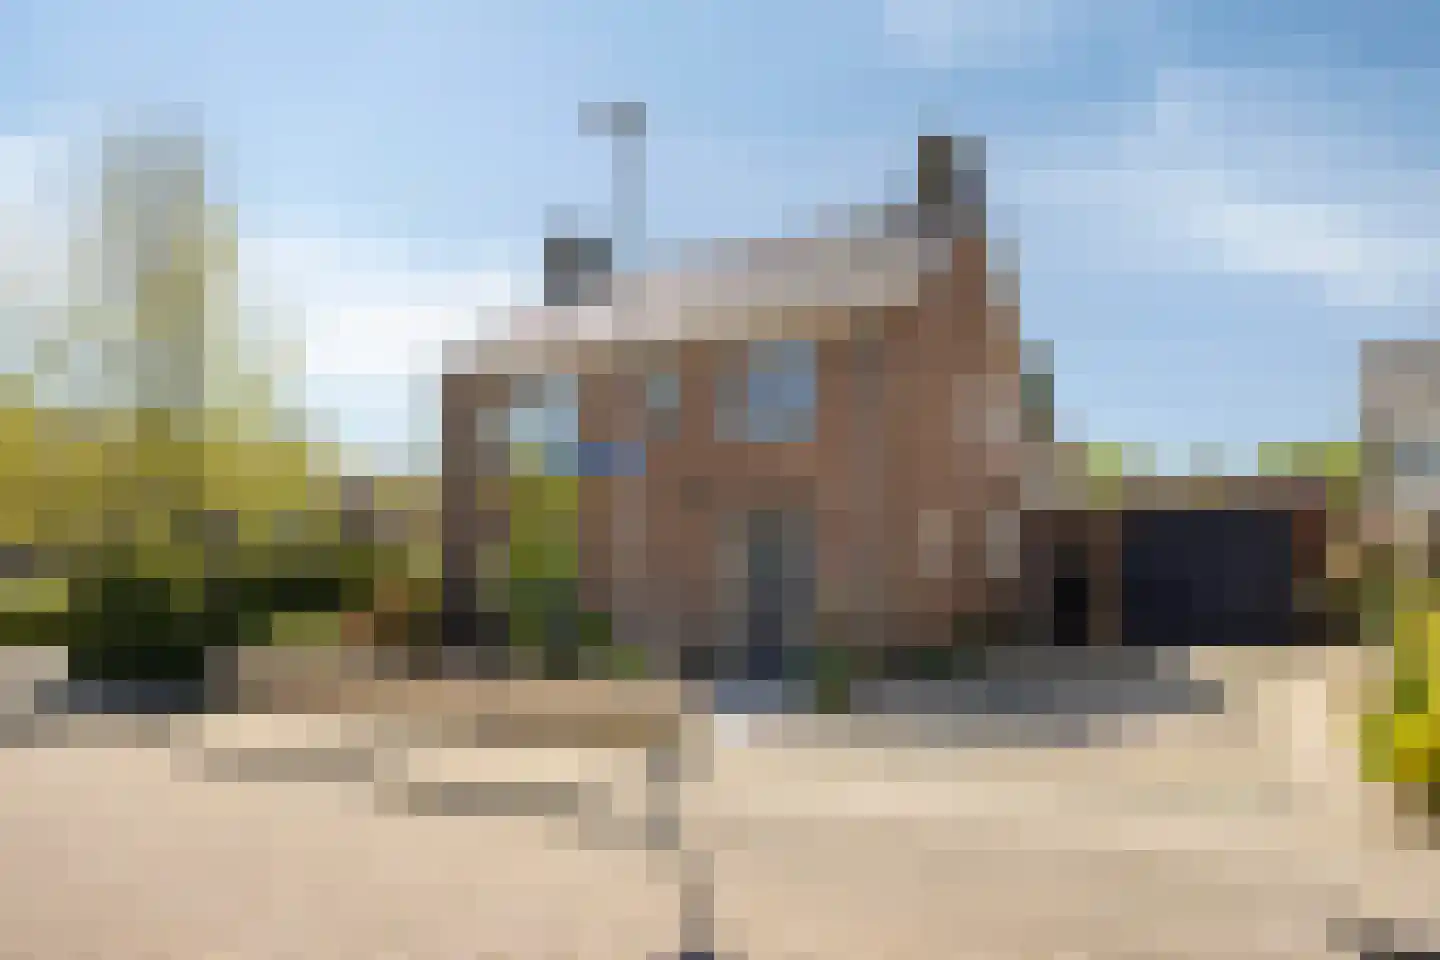
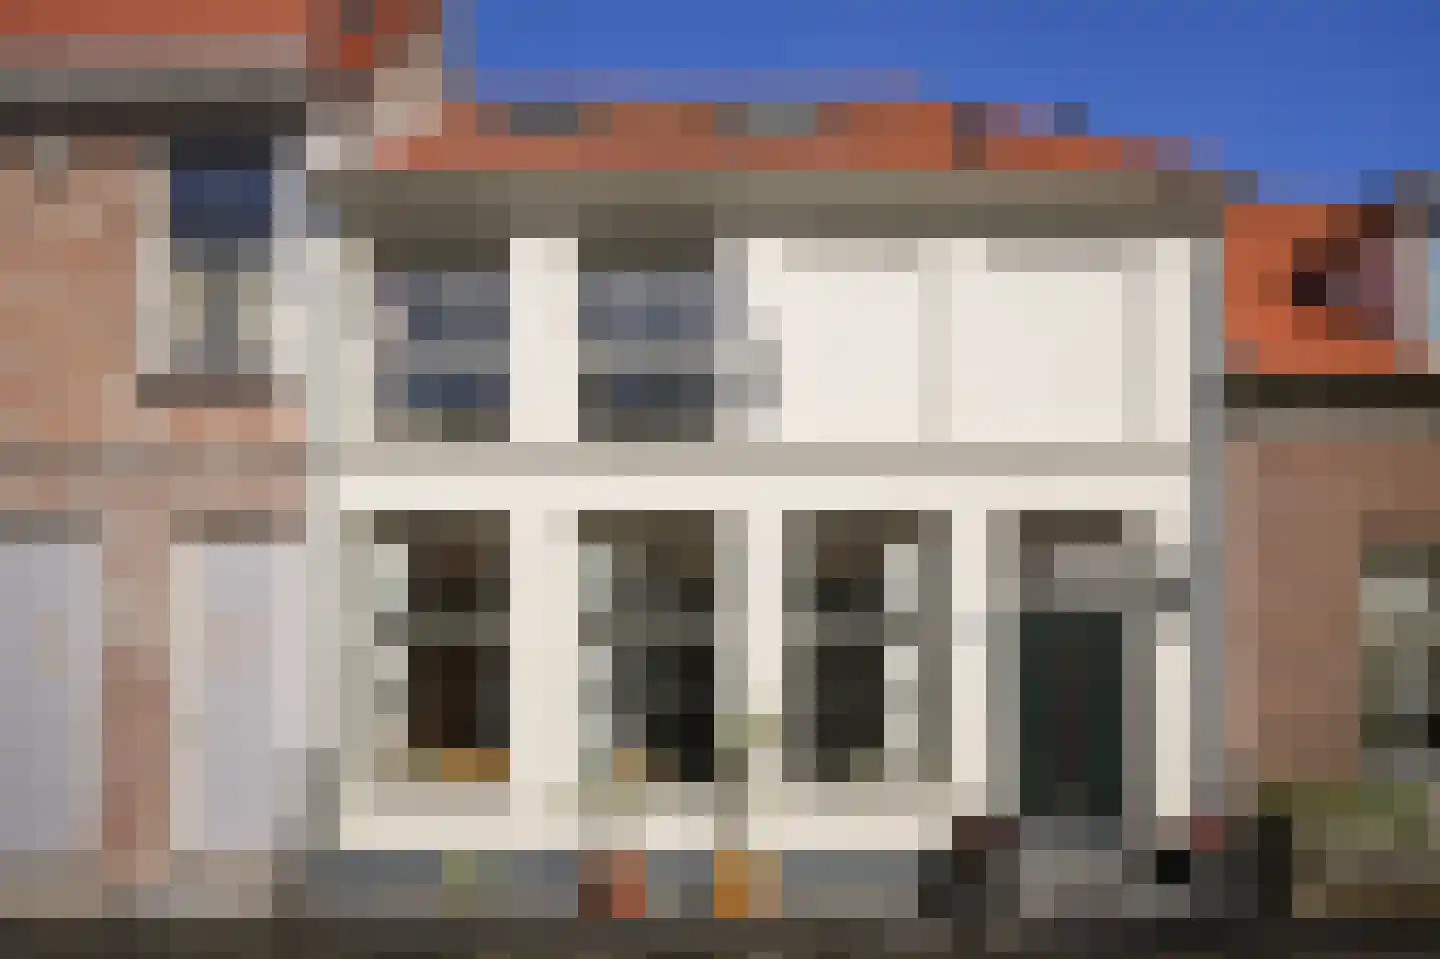
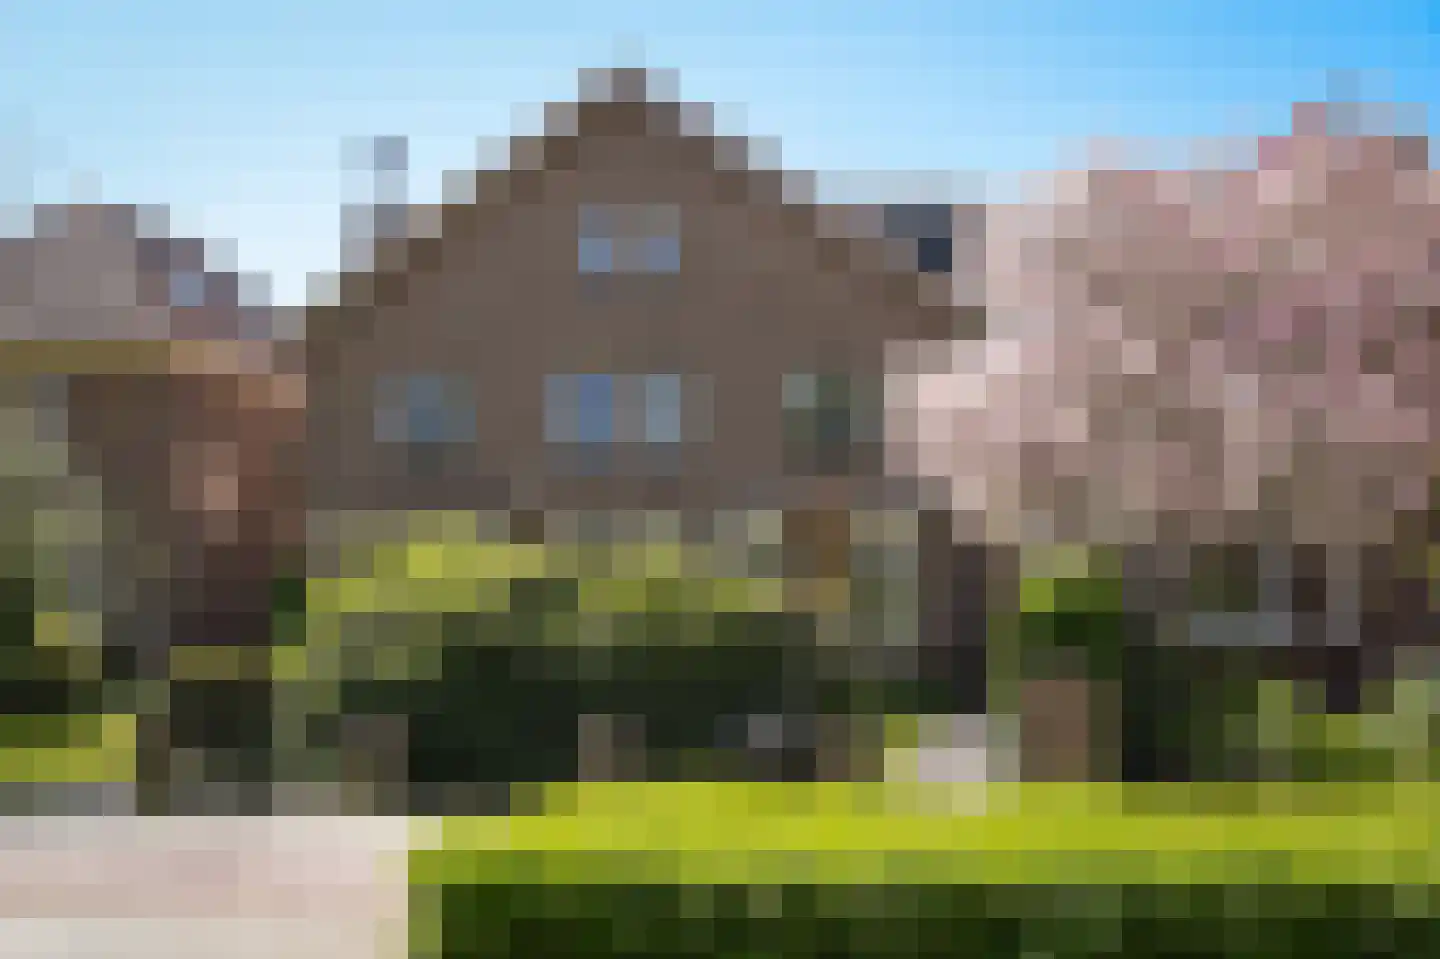
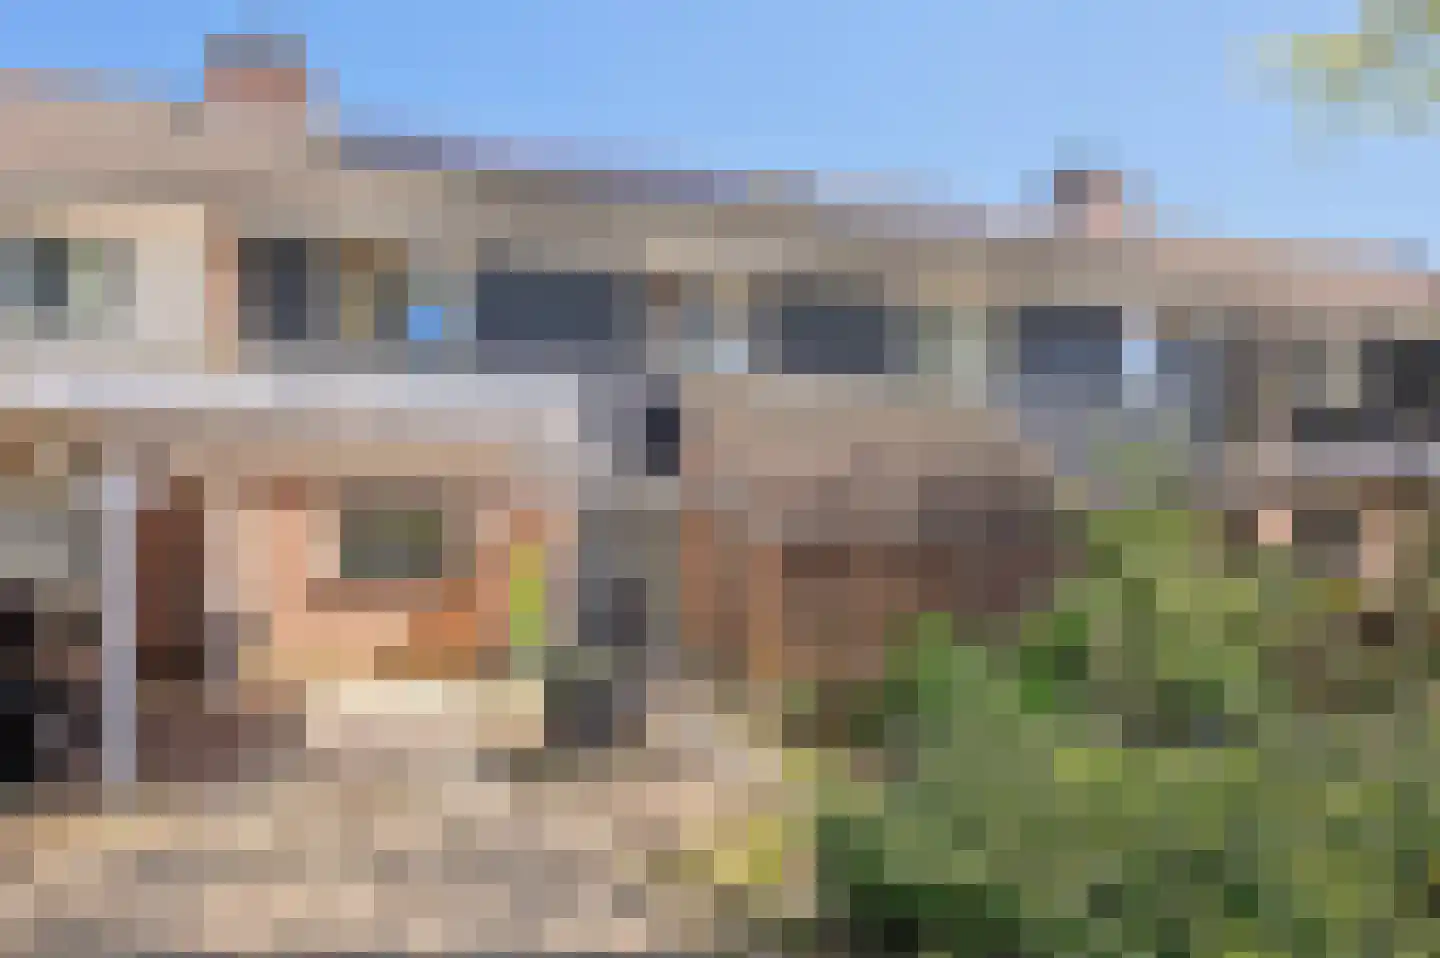
Welkom bij Citadel 32 in Zaltbommel – een lichte, ruime en vriendelijk ogende middenwoning in de populaire wijk "De Spellewaard". Deze rustige woonwijk is ideaal gelegen, op korte afstand van het gezellige stadscentrum én het kleinschalige natuurgebied De Kloosterwiel. De woning beschikt over maar liefst vier slaapkamers, met een ruime zolderkamer die eenvoudig is op te delen in een vierde én vijfde slaapkamer – perfect voor gezinnen, thuiswerkers of hobbyisten. De tuingerichte woonkamer zorgt voor veel natuurlijk licht en een directe verbinding met de achtertuin, wat bijdraagt aan de prettige woonsfeer die het huis kenmerkt. De straat is rustig, met voornamelijk bestemmingsverkeer, wat zorgt voor een kindvriendelijke en veilige woonomgeving. Winkels, scholen en andere voorzieningen bevinden zich op slechts vijf minuten rijafstand, waardoor gemak en comfort hand in hand gaan. Kortom: Citadel 32 is een fijne gezinswoning op een geweldige locatie – licht, ruim en klaar voor de volgende stap!
€ 425.000
Cost of copper (estimated): € 10.350
2% transfer tax (€ 8.500) + notary (€ 1.150) + valuation (€ 700)
Total purchase (incl. p.p.): € 435.350
2,78%
Yearly
€ 21.250
Direct available
Estimated mortgage
Indicative gross monthly cost
Based on annuity and 30 year term
Indicative net monthly cost
iDisclaimer: this mortgage calculation is a simplified indication based on general assumptions. No rights can be derived from the results shown. Calculated with 10-annual interest (met NHG), automatically determined based on the price limit € 470.000. Source: 10-jaars rente uit mortgage_rates (04-05-2026 03:45).
Douche, ligbad, toilet, en wastafel
View the location and discover the brokers in this region
View current location data on residents, WOZ development, housing stock, energy consumption, business activity and safety in Zaltbommel. In 2025 were there 13.485 residents. The average WOZ value in 2025 is EUR 382.000.
Residents
13.485
Last year: 2025
Average WOZ
EUR 382.000
Last year: 2025
Average income per person.
EUR 35.000
Source: AllNumbers
Crimes (current year)
711
Total registered
| Year | Residents |
|---|---|
| 2021 | 13.070 |
| 2022 | 13.325 |
| 2023 | 13.530 |
| 2024 | 13.565 |
| 2025 | 13.485 |
| Year | Average WOZ |
|---|---|
| 2021 | EUR 273.000 |
| 2022 | EUR 303.000 |
| 2023 | EUR 344.000 |
| 2024 | EUR 358.000 |
| 2025 | EUR 382.000 |
Hoger
3.410
Praktisch
2.750
Middelbaar
3.950
Europa
1.090
Nederland
10.265
Buiten Europa
2.130
Label A
2.022
Label C
1.452
Label B
1.188
Label D
401
Label F
302
Label G
268
Label A+++
229
Label A+
167
Label E
165
Label A++
65
Label A++++
57
Label A+++++
1
| Year | Gas (m3) | Electricity (kWh) |
|---|---|---|
| 2020 | 1.140 | 2.800 |
| 2021 | 1.280 | 2.820 |
| 2022 | 1.000 | 2.660 |
| 2023 | 840 | 2.520 |
| 2024 | 830 | 2.580 |
Hoekwoning
Gas: 910 • Electricity: 2.570
Huurwoning
Gas: 680 • Electricity: 2.040
Koopwoning
Gas: 960 • Electricity: 2.860
Appartement
Gas: 580 • Electricity: 1.820
Tussenwoning
Gas: 790 • Electricity: 2.410
Vrijstaande woning
Gas: 1.380 • Electricity: 4.060
Twee-onder-één-kap woning
Gas: 1.060 • Electricity: 3.110
Total number of company establishments: 2.250
| Period | Crimes |
|---|---|
| jan 2025 | 49 |
| jan 2026 | 96 |
| jul 2025 | 39 |
| jun 2025 | 50 |
| mei 2025 | 46 |
| mrt 2025 | 49 |
| nov 2024 | 55 |
| nov 2025 | 80 |
| okt 2024 | 50 |
| okt 2025 | 86 |
| sep 2024 | 54 |
| sep 2025 | 69 |
These figures give an indicative picture of safety trends in the living environment of Zaltbommel.
Short answers based on current local statistics, handy for a quick comparison of the living environment.
Zaltbommel telt in 2025 ongeveer 13.485 inwoners.
De gemiddelde WOZ-waarde in Zaltbommel is in 2025 circa € 382.000.
Het gemiddelde inkomen per inwoner in Zaltbommel ligt rond € 35.000 per jaar.
Voor het huidige jaar gaat het om ongeveer 711 geregistreerde misdrijven. Gebruik deze cijfers als indicatie en vergelijk trends per periode.
In Zaltbommel komt vooral "Tussenwoningen" veel voor, met ongeveer 2.907 woningen.
View more homes in this location.
5301RN Zaltbommel
€ 625.000 k.k.
5301BC Zaltbommel
€ 389.000 k.k.
€ 5.329/m²
5301GJ Zaltbommel
€ 750.000 k.k.
€ 4.545/m²
5301VM Zaltbommel
€ 409.000 k.k.
€ 3.466/m²
5301VX Zaltbommel
€ 425.000 k.k.
€ 3.484/m²
5301AH Zaltbommel
€ 500.000 k.k.
€ 3.049/m²

5301HL Zaltbommel
€ 969.000 k.k.
€ 3.388/m²

5301WP Zaltbommel
€ 495.000 k.k.
€ 4.381/m²
