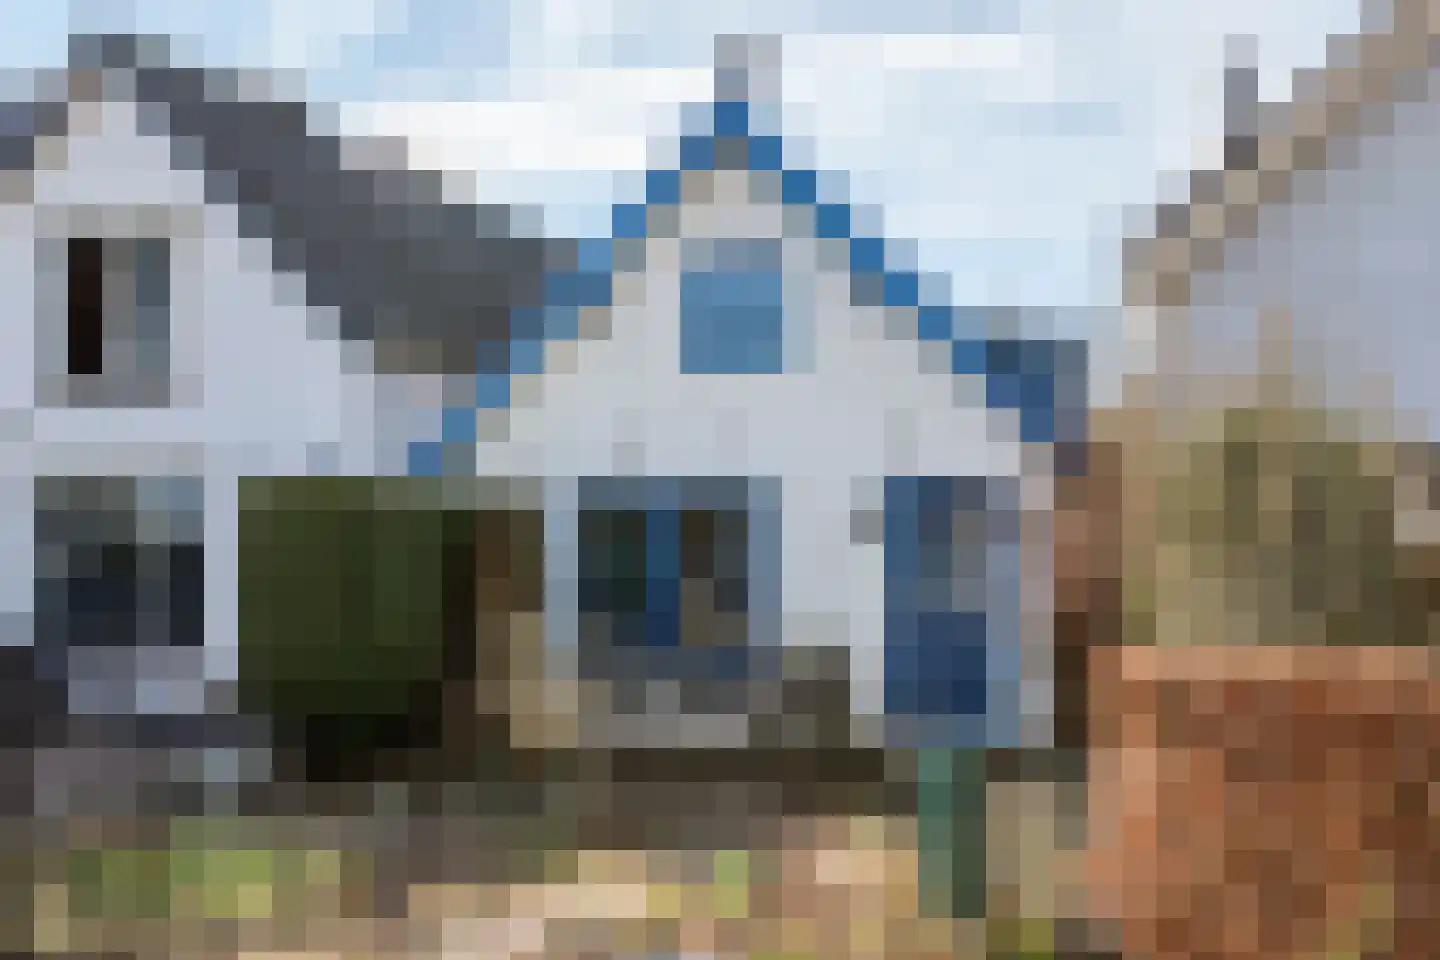
- Sold
Kerkstraat 12
4011EM Zoelen
€ 889.000 k.k.
€ 3.848/m²
- Living area
- 231 m²
- Land area
- 5288 m²
- Bedrooms
- 5
View 18 sold houses in Zoelen
Type to search. Use arrow down and arrow up to navigate through results and press Enter to open.
Hidden search suggestions.
Compare sold homes in Zoelen or view the current offering in this location directly.
On this page you will find recently sold homes in Zoelen. Use this overview to better estimate selling prices, popular neighborhoods, and the local housing supply before you choose a real estate agent. Also view the current housing supply with 24 houses in Zoelen.
4011EM Zoelen
€ 889.000 k.k.
€ 3.848/m²
4011GJ Zoelen
€ 395.000 k.k.
€ 4.877/m²
4011ES Zoelen
Price upon request
4011KB Zoelen
€ 689.000 k.k.
€ 4.416/m²
4011LK Zoelen
€ 229.000 k.k.
€ 2.862/m²
4011EP Zoelen
€ 518.000 k.k.
€ 4.543/m²
4011EG Zoelen
€ 820.000 k.k.
€ 5.324/m²
4011GJ Zoelen
€ 865.000 k.k.
€ 4.042/m²
4011EJ Zoelen
€ 595.000 k.k.
€ 4.507/m²
4011GE Zoelen
€ 368.000 k.k.
€ 3.471/m²
4011EH Zoelen
€ 630.000 k.k.
€ 3.559/m²
4011GR Zoelen
€ 498.000 k.k.
€ 3.342/m²
4011GJ Zoelen
€ 565.000 k.k.
€ 5.000/m²
4011GE Zoelen
€ 420.000 k.k.
€ 4.772/m²
4011KD Zoelen
€ 398.000 k.k.
€ 4.471/m²
4011KC Zoelen
€ 469.000 k.k.
€ 4.690/m²
4011JS Zoelen
€ 745.000 k.k.
€ 5.912/m²
4011GJ Zoelen
€ 425.000 k.k.
€ 4.207/m²
Bekijk recente verkopen en ontvang gratis offertes van lokale verkoopmakelaars in Zoelen.
Zelf je woning verkopen in Zoelen? Vergelijk verkoopmakelaars in Zoelen of bekijk de beste verkoopmakelaars in Zoelen als referentie bij jouw keuze.
Makelaars maken scherpere voorstellen als ze weten dat je vergelijkt — vraag offertes aan voor verkoop of aankoop.
Short answers about housing prices, sold homes and comparing real estate agents in Zoelen.
The costs of a real estate agent in Zoelen vary per office, property type and sales approach. Therefore, compare multiple quotes and also look at the real estate agents in Zoelen to better compare rates, presentation and local experience.
On this page we currently show 18 sold houses in Zoelen from our selection. This helps you to better assess recent transactions and the local housing market.
Houses sold in Zoelen give insight into asking prices, house types and neighborhoods where recent transactions have taken place. Compare this also with the current housing stock in Zoelen to better understand the market.
You can use sold homes as a first market indication, but a local real estate agent can better take into account finishing, location, maintenance and current demand in Zoelen.
Vergelijk makelaars in Zoelen op lokale verkoopervaring, reviews, verwachte opbrengst, courtage en marketingaanpak. Bekijk verkoopmakelaars in Zoelen of de top 10 makelaars in Zoelen om snel sterke kantoren te ontdekken.
View current location data on residents, WOZ development, housing stock, energy consumption, business activity and safety in Zoelen. In 2025 were there 1.785 residents. The average WOZ value in 2025 is EUR 519.279.
These figures help to better assess and compare the housing stock in Zoelen with recent sold homes. Orient yourself then on suitable top real estate agents in Zoelen for sales advice in this region.
Residents
1.785
Last year: 2025
Average WOZ
EUR 519.279
Last year: 2025
Average income per person.
EUR 35.194
Source: AllNumbers
Crimes (current year)
47
Total registered
| Year | Residents |
|---|---|
| 2021 | 1.715 |
| 2022 | 1.750 |
| 2023 | 1.770 |
| 2024 | 1.780 |
| 2025 | 1.785 |
| Year | Average WOZ |
|---|---|
| 2021 | EUR 375.254 |
| 2022 | EUR 410.889 |
| 2023 | EUR 452.896 |
| 2024 | EUR 485.631 |
| 2025 | EUR 519.279 |
Hoger
310
Praktisch
310
Middelbaar
520
Europa
105
Nederland
1.570
Buiten Europa
115
Label G
160
Label A
156
Label C
118
Label D
88
Label B
75
Label F
60
Label E
21
Label A+++
8
Label A+
4
Label A++
1
Label A++++
1
Label A+++++
0
| Year | Gas (m3) | Electricity (kWh) |
|---|---|---|
| 2020 | 1.685 | 3.732 |
| 2021 | 1.901 | 3.799 |
| 2022 | 1.435 | 3.566 |
| 2023 | 1.179 | 3.429 |
| 2024 | 1.136 | 3.638 |
Hoekwoning
Gas: 853 • Electricity: 2.872
Huurwoning
Gas: 1.012 • Electricity: 2.478
Koopwoning
Gas: 1.220 • Electricity: 3.664
Appartement
Gas: 1.203 • Electricity: 2.727
Tussenwoning
Gas: 785 • Electricity: 2.152
Vrijstaande woning
Gas: 1.405 • Electricity: 4.036
Twee-onder-één-kap woning
Gas: 994 • Electricity: 3.224
Total number of company establishments: 335
| Period | Crimes |
|---|---|
| jan 2026 | 3 |
| jul 2025 | 2 |
| jun 2025 | 4 |
| mei 2025 | 5 |
| mrt 2025 | 4 |
| mrt 2026 | 1 |
| nov 2024 | 3 |
| nov 2025 | 4 |
| okt 2024 | 6 |
| okt 2025 | 7 |
| sep 2024 | 6 |
| sep 2025 | 6 |
These figures give an indicative picture of safety trends in the living environment of Zoelen.
Short answers based on current local statistics, handy for a quick comparison of the living environment.
Zoelen telt in 2025 ongeveer 1.785 inwoners.
De gemiddelde WOZ-waarde in Zoelen is in 2025 circa € 519.279.
Het gemiddelde inkomen per inwoner in Zoelen ligt rond € 35.194 per jaar.
Voor het huidige jaar gaat het om ongeveer 47 geregistreerde misdrijven. Gebruik deze cijfers als indicatie en vergelijk trends per periode.
In Zoelen komt vooral "Vrijstaande woningen" veel voor, met ongeveer 371 woningen.