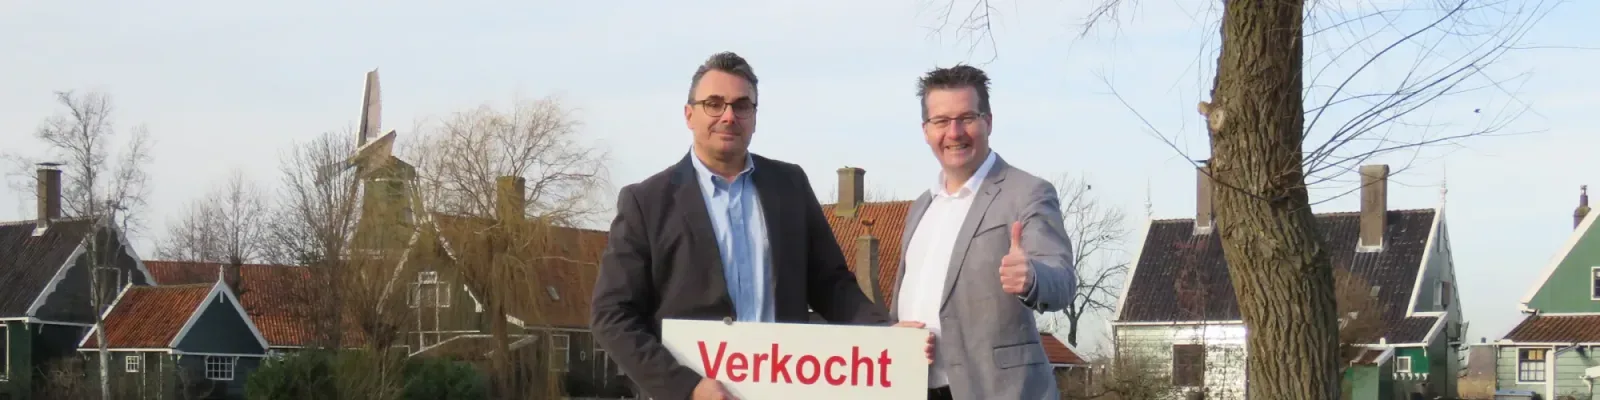
All brokers in Egmond aan Zee

In Egmond aan Zee are 61 real estate agents active

Connected to: Vastgoed Nederland NVM Makelaars

Uitgelichte makelaars in Egmond aan Zee

Een korte selectie uit de lokale vergelijking. Bekijk de volledige lijst hieronder of vergelijk direct offertes.

Compare all brokers in Egmond aan Zee

61 real estate agents in Egmond aan Zee average a 9.1 out of 3.546 ratings! Bekijk de top 10 beste makelaars in Egmond aan Zee

Verkoopintentie

Huis verkopen in Egmond aan Zee?

Vergelijk lokale verkoopmakelaars in Egmond aan Zee op tarieven, reviews en verkoopervaring. Ontvang gratis en vrijblijvend meerdere offertes voor jouw woning.

Welke lokale makelaar past bij jou in Egmond aan Zee?

Gratis makelaarsoffertes vergelijken in Egmond aan Zee

  • Quotes in Egmond aan Zee
  • Non-binding
  • Personal
  • Gratis tarieven vergelijken
  • Gratis & vrijblijvend
  • Verkoop & aankoop
  • 61 real estate agents
  • 9,1 uit 3.546 reviews

Ontvang gerichte offertes: makelaars in Egmond aan Zee maken scherpere voorstellen als ze weten dat ze worden vergeleken. Op basis van een paar korte vragen over jouw situatie ontvang je vrijblijvend offertes van een verkoopmakelaar of aankoopmakelaar. Komt jouw woning op Funda? Dan ontvang je daarbij gratis een speciale woningwebsite.

What does a real estate agent cost in Egmond aan Zee?

Compare brokers in Egmond aan Zee

Compare different brokers in Egmond aan Zee to find the ideal balance between costs and quality. In a high-end housing market like Egmond aan Zee, the right real estate agent is essential for optimal sales or purchase results. Due to the large competition between brokers in Egmond aan Zee, attractive rates can be found. Start requesting quotes today and find the ideal real estate agent who fits your specific situation.

Broker fees in Egmond aan Zee

With an average property value of €576.794 in Egmond aan Zee, real estate agent fees for sale or purchase are usually between €3.300,- and €10.900,-. The fee structure for a buyer's agent or selling agent varies: some work with a combination of startup costs and commission (1-2% of the sale price), while others charge a fixed rate. By comparing different quotes, you will find the agent who offers the best price-quality ratio for your specific situation.

Business activity in Egmond aan Zee

The activity in Egmond aan Zee shows a broad and varied local economy, with room for both established entrepreneurs and new initiatives. With 40 NVM real estate agents in Egmond aan Zee, the real estate market is professionally organized and active. In combination with the population structure and education levels, this gives a practical picture of the economic dynamics in the area.

Market information Bergen

Recent developments in the housing market of Bergen

Average house prices in Egmond aan Zee

Average house price last month

€576.794,-

In Egmond aan Zee the housing market is currently very dynamic with prices well above the national average. Relevant for those who want to sell or buy a house. Based on 611 recent transactions with a high number of recent transactions in the region.

These averages are indicative and help with orientation when buying or selling a house.

Apartments

€461.435,-

Average price

Terraced houses

€605.634,-

Average price

Corner houses

€524.883,-

Average price

Bungalow

€853.655,-

Average price

two-under-one-roof

€807.512,-

Average price

Detached

€922.870,-

Average price

Comparison of brokerage fees in Egmond aan Zee

Rates are based on the average house price of €576.794 in Egmond aan Zee.

Agent type Startup costs Brokerage Total price
FSBO (self selling)
€0,- 0% €0,-
Internet broker
€1.595,- 0% €1.595,-
Freelance broker
€0,- 1,00% €5.768,-
Vastgoed NL real estate agent
€495,- 1,20% €7.417,-
NVM real estate agent
€695,- 1,35% €8.482,-

An online real estate agent does everything except viewings; you do those yourself.

The above prices are indicative and may vary by broker. Always request multiple quotes for an accurate price comparison.

All amounts are inclusive of 21% VAT.

Market information for sales & purchase brokers in Egmond aan Zee

Current statistics for when you want to buy or sell a house and information about purchase & sale brokers in Egmond aan Zee

How is the housing market in Egmond aan Zee?

How much competition is there in Egmond aan Zee?

How many brokers are active in Egmond aan Zee?

In Egmond aan Zee there are 61 active brokers available to help you as a buyer's agent or seller's agent with buying or selling a house. Finding the right broker can be a challenge, but by comparing brokers in Egmond aan Zee on expertise, price and reviews, you can make an informed choice. Our platform provides an overview of all brokers in Egmond aan Zee.

How many brokers are located in Egmond aan Zee?

With 3 established brokers in Egmond aan Zee, you have plenty of choice from local experts. These brokers often have in-depth knowledge of the housing market in your region. Whether you want to sell or buy a house, a sales or purchase broker in real estate agents can guide you through every step of the process. Easily compare brokers and receive quotes to see which broker best suits your wishes.

What is the average rating of brokers in Egmond aan Zee?

Real estate agents in Egmond aan Zee average a score of 9.1 out of 3546 reviews. These high scores provide insight into the satisfaction of previous clients. When choosing a real estate agent, however, it is also important to pay attention to their specializations, experience and rates. On our platform you can compare real estate agents in Egmond aan Zee and make the ideal choice based on your personal preferences.

What is the average asking price in Egmond aan Zee?

The average asking price in Egmond aan Zee is €576.794,- based on april data from 611 registered properties. This price is an indication of current trends in the housing market in Egmond aan Zee. Whether you want to buy or sell a house, a purchasing or selling broker in Egmond aan Zee can help you make the most of this market and achieve your goals.

How many NVM real estate agents are there in Egmond aan Zee?

In Egmond aan Zee there are 40 NVM real estate agents active. These agents offer a guarantee of quality and professionalism because they are bound by strict guidelines. By choosing an NVM agent, you benefit from extensive knowledge and experience in the housing market of Egmond aan Zee. View and compare NVM agents on our platform to find your ideal match.

How many Real Estate Netherlands agents are there in Egmond aan Zee?

There are 5 Real Estate Netherlands brokers active in Egmond aan Zee. Real Estate Netherlands brokers are known for their flexible services and customer-focused approach. They offer expert advice and guide you through the entire process of buying, selling or renting. Discover which Real Estate NL broker in Egmond aan Zee best suits your needs.

Frequently asked questions about brokers in Egmond aan Zee

Important information about enabling brokers in Egmond aan Zee

Map of Egmond aan Zee

Spatial overview of the work area in Egmond aan Zee

Residential and neighborhood statistics in Egmond aan Zee

View current location data on residents, WOZ development, housing stock, energy consumption, business activity and safety in Egmond aan Zee. In 2025 were there 4.535 residents. The average WOZ value in 2025 is EUR 435.000.

Residents

4.535

Last year: 2025

Average WOZ

EUR 435.000

Last year: 2025

Average income per person.

EUR 34.200

Source: AllNumbers

Crimes (current year)

214

Total registered

Demographics and WOZ development

Inhabitants per year

Inhabitants per year in Egmond aan Zee
Year Residents
2021 4.530
2022 4.575
2023 4.635
2024 4.590
2025 4.535

Annual WOZ value

WOZ value per year in Egmond aan Zee
Year Average WOZ
2021 EUR 313.000
2022 EUR 343.000
2023 EUR 388.000
2024 EUR 409.000
2025 EUR 435.000

Composition of residents

Age build-up

65+: 1.705 0-15: 425 15-25: 375 25-45: 765 45-65: 1.265

Education level

Hoger

880

Praktisch

860

Middelbaar

1.390

Origin of residents (2025)

Europa

340

Nederland

3.850

Buiten Europa

345

Housing stock and construction periods

Types of homes

Hoekwoningen 394
Appartementen 1.378
Tussenwoningen 733
Vrijstaande woningen 227
Twee-onder-één-kap woningen 192

Construction period of buildings

Voor 1700 0
1700 tot 1900 28
1900 tot 1925 282
1925 tot 1950 292
1950 tot 1970 976
1970 tot 1980 399
1980 tot 1990 247
1990 tot 2000 36
2000 tot 2010 96
2010 tot 2020 20
2020 en later 14

Energy and sustainability

Energy label distribution

Label C

799

Label G

433

Label E

374

Label A

366

Label B

326

Label F

291

Label D

257

Label A+

183

Label A++

47

Label A+++

2

Label A++++

1

Label A+++++

0

Average energy consumption per year

Average energy consumption per year in Egmond aan Zee
Year Gas (m3) Electricity (kWh)
2020 1.170 2.340
2021 1.350 2.390
2022 1.070 2.220
2023 920 2.070
2024 890 2.040

Consumption per house type

Hoekwoning

Gas: 1.150 • Electricity: 2.390

Huurwoning

Gas: 720 • Electricity: 1.560

Koopwoning

Gas: 1.050 • Electricity: 2.410

Appartement

Gas: 700 • Electricity: 1.630

Tussenwoning

Gas: 1.010 • Electricity: 2.370

Vrijstaande woning

Gas: 1.570 • Electricity: 3.420

Twee-onder-één-kap woning

Gas: 1.260 • Electricity: 2.470

Business activity in Egmond aan Zee (2025)

Handel en HORECA 170
Nijverheid en energie 110
Zakelijke dienstverlening 140
Overheid, onderwijs en zorg 105
Landbouw, bosbouw en visserij 5
Vervoer, informatie en communicatie 30
Financiele diensten en onroerendgoed 30
Cultuur, recreatie en overige diensten 55

Total number of company establishments: 650

Recent crime statistics

Recent crime statistics in Egmond aan Zee
Period Crimes
jan 2025 9
jan 2026 10
jul 2025 48
jun 2025 33
mei 2025 11
mrt 2025 19
nov 2024 8
nov 2025 6
okt 2024 6
okt 2025 11
sep 2024 17
sep 2025 13

These figures give an indicative picture of safety trends in the living environment of Egmond aan Zee.

Frequently asked questions about living in Egmond aan Zee

Short answers based on current local statistics, handy for a quick comparison of the living environment.

Hoeveel inwoners heeft Egmond aan Zee?

Egmond aan Zee telt in 2025 ongeveer 4.535 inwoners.

Wat is de gemiddelde WOZ-waarde in Egmond aan Zee?

De gemiddelde WOZ-waarde in Egmond aan Zee is in 2025 circa € 435.000.

Wat is het gemiddelde inkomen per inwoner in Egmond aan Zee?

Het gemiddelde inkomen per inwoner in Egmond aan Zee ligt rond € 34.200 per jaar.

Hoe veilig is wonen in Egmond aan Zee?

Voor het huidige jaar gaat het om ongeveer 214 geregistreerde misdrijven. Gebruik deze cijfers als indicatie en vergelijk trends per periode.

Welke woningtypen komen het meest voor in Egmond aan Zee?

In Egmond aan Zee komt vooral "Appartementen" veel voor, met ongeveer 1.378 woningen.

Current knowledge articles

Discover everything about real estate agents and the housing market

Gratis vrijblijvende offertes ontvangen

Vergelijk meerdere makelaars en kies de beste match.