
Bij De Makelares in Alkmaar staat uw vertrouwen centraal. Of u nu een woning wilt verkopen of kopen, wij zorgen voor een professionele en persoonlijke benadering. Bij de verkoop houden wij u nauwkeurig op de hoogte van elke bezichtiging en zorgen we voor een optimale presentatie van uw huis. Onze motivatie is om u te helpen het beste resultaat behalen, zodat u na afloop niet alleen van de handel is overtuigd, maar ook van onze samenwerk...
Current housing stock
-

- Available
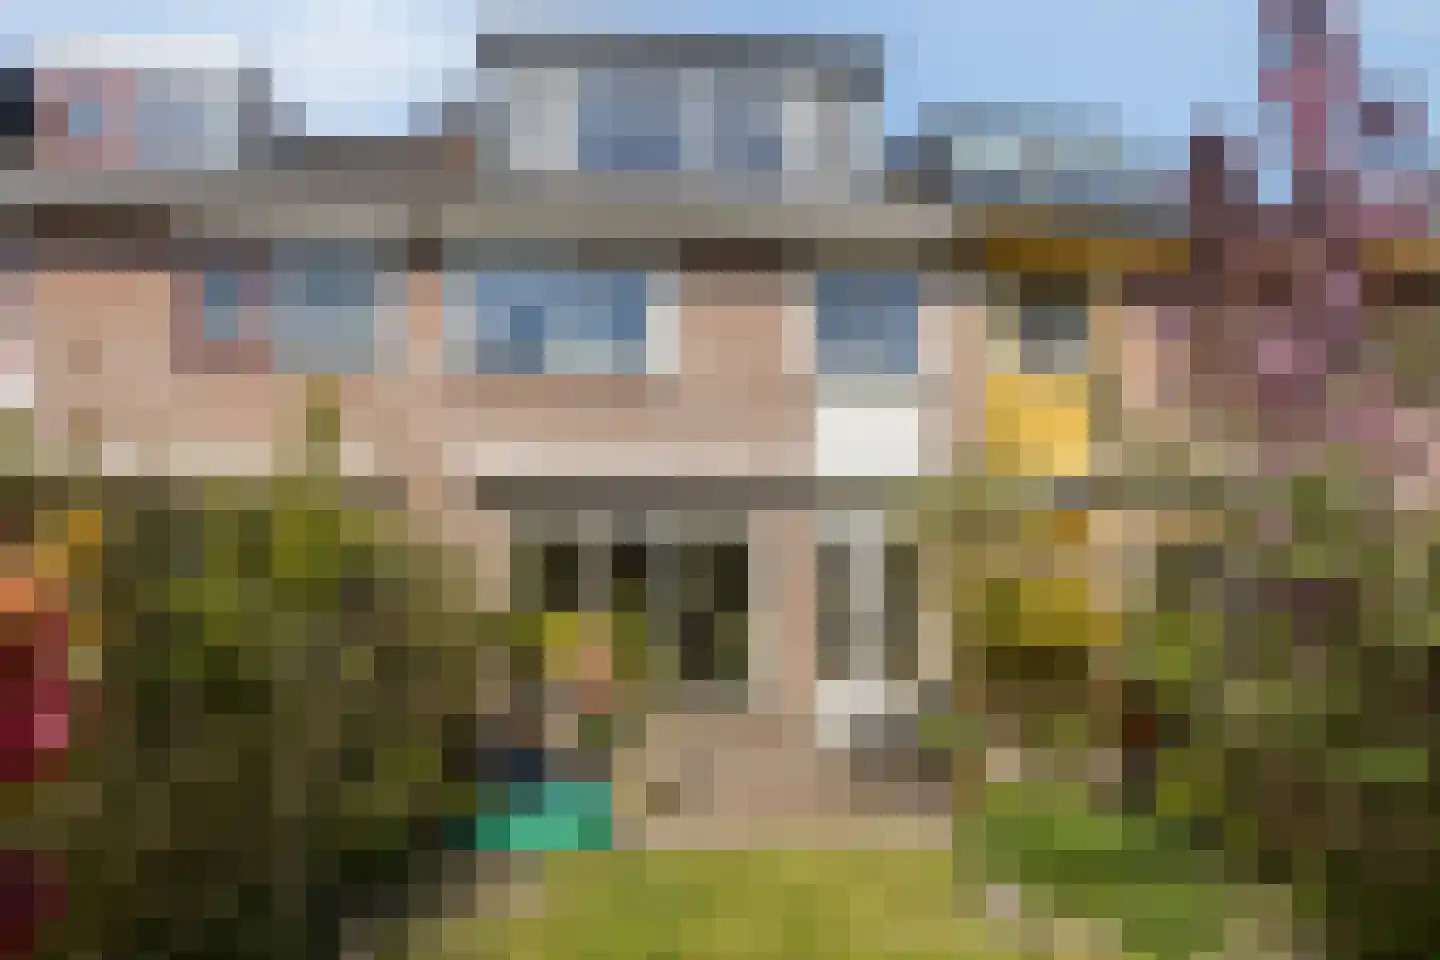
Briljant 88
1703GS Heerhugowaard
€ 400.000 k.k.
€ 3.226/m²
CSave as favorite- Living area
- 124 m²
- Land area
- 215 m²
- Bedrooms
- 4
-

- Available
Marsmanstraat 18
1702GA Heerhugowaard
€ 245.000 k.k.
€ 5.000/m²
BSave as favorite- Living area
- 49 m²
- Land area
- —
- Bedrooms
- 1
-

- Available
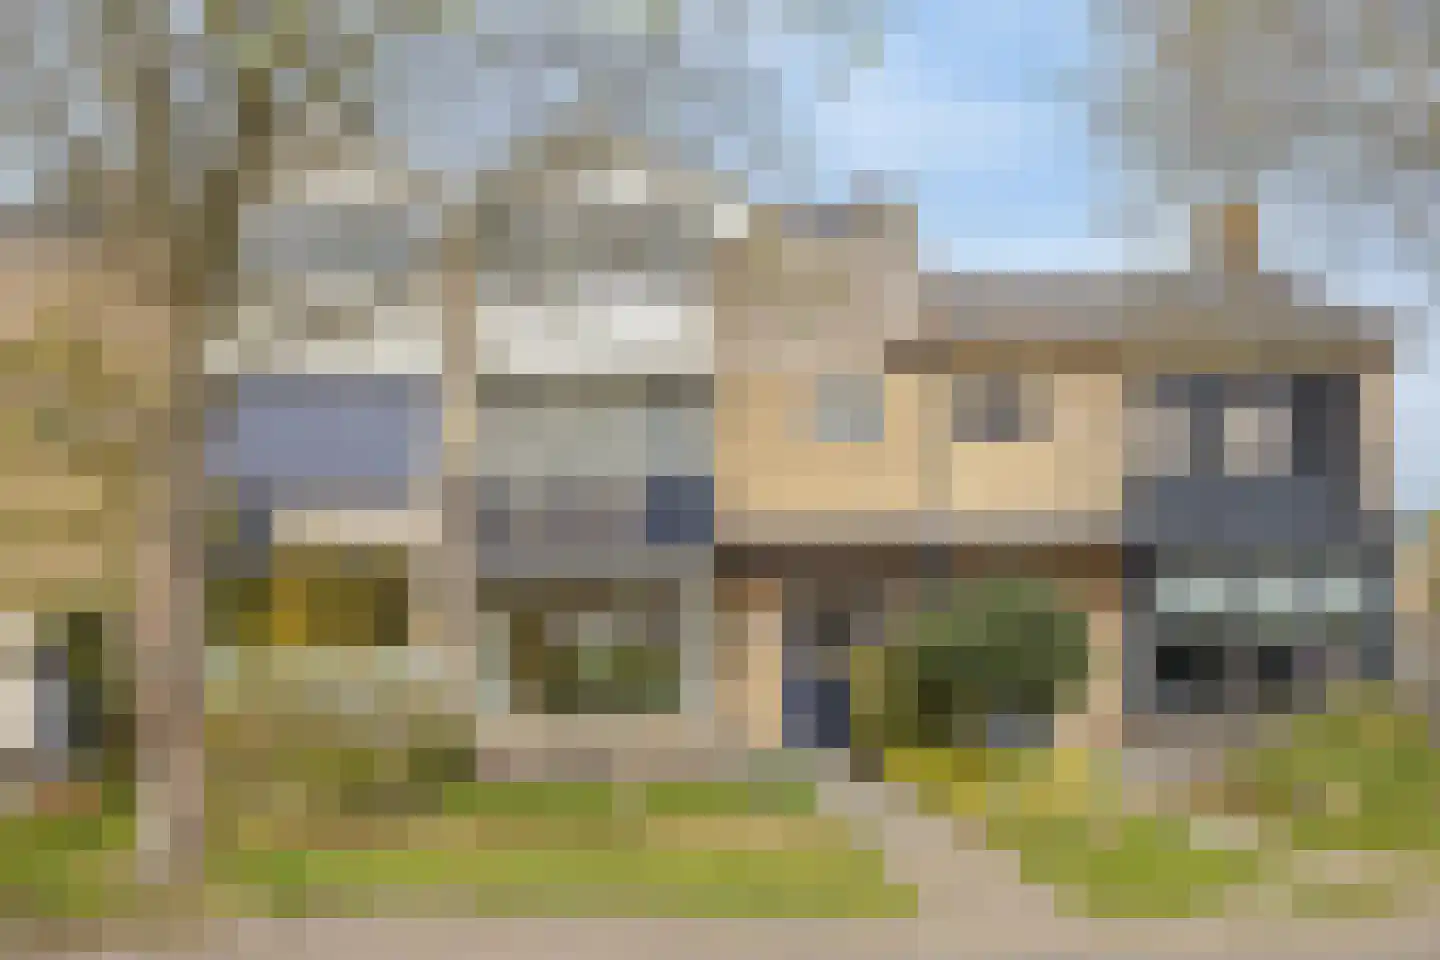
Lotte Beesedijk 21
1705NA Heerhugowaard
€ 850.000 k.k.
€ 4.167/m²
ASave as favorite- Living area
- 204 m²
- Land area
- 494 m²
- Bedrooms
- 6
-

- Available
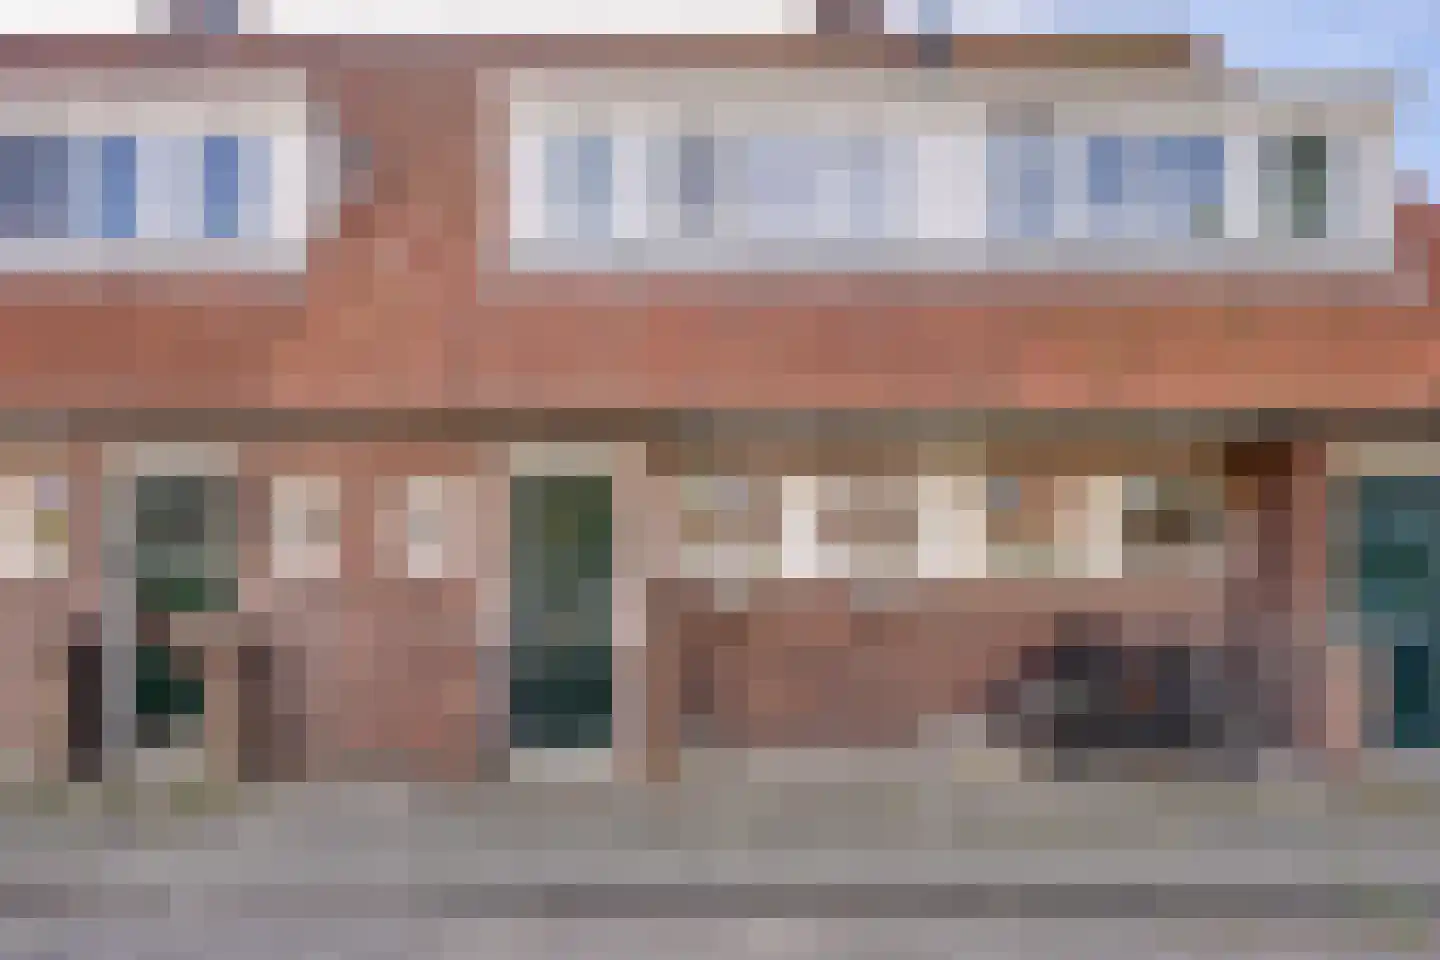
Hans de Riesstraat 20
1827NR Alkmaar
€ 475.000 k.k.
€ 3.711/m²
A+Save as favorite- Living area
- 128 m²
- Land area
- 179 m²
- Bedrooms
- 5
-

- Sold subject to confirmation
Kreekwaard 14
1824DT Alkmaar
€ 265.000 k.k.
€ 4.274/m²
CSave as favorite- Living area
- 62 m²
- Land area
- —
- Bedrooms
- 1
-

- Sold subject to confirmation
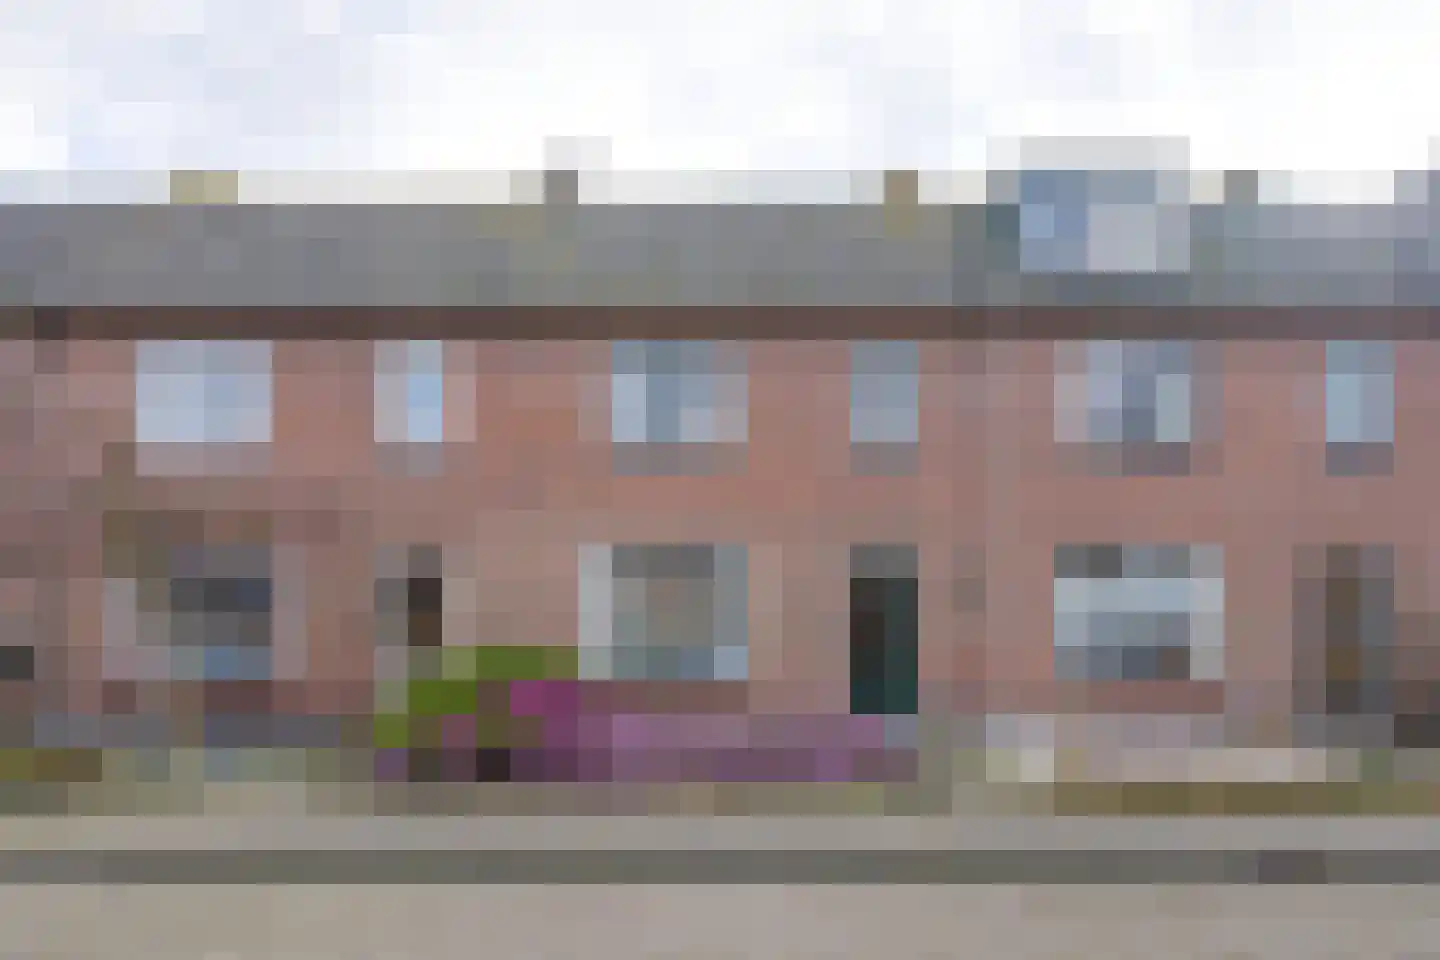
Cressantlaan 11
1816NX Alkmaar
€ 435.000 k.k.
€ 3.425/m²
BSave as favorite- Living area
- 127 m²
- Land area
- 152 m²
- Bedrooms
- 4
Reviews (81)
Review platforms
BronscoresTotal score
81 total reviews

Funda
59 reviews on Funda

22 reviews on Google
-
marko koprivica
10We kunnen Jiska van harte aanbevelen! Toen we naar een nieuwe stad als Alkmaar verhuisden, voelden we ons aanvankelijk overweldigd en misten we de lokale kennis. Jiska was echt een gamechanger voor ons. Ze begeleidde ons door het hele proces met ongelooflijke expertise, geduld en warmte. Wat haar onderscheidt, is haar diepgaande kennis van de markt en haar vermogen om bij elke stap waardevol advies te geven. Ze heeft niet zomaar een huis voor ons gevonden; ze heeft een fantastisch thuis voor ons gevonden. Haar onderhandelingsvaardigheden zijn van topniveau en ze wist een geweldige deal met de verkoper te sluiten die onze verwachtingen overtrof. Als u op zoek bent naar een makelaar die professioneel, proactief en oprecht begaan is met haar klanten, dan is Jiska de juiste keuze!
-
Heilooërdijk 43
9De Makelares was heel meedenkend en had goede ideeën over de aanpak van verkoop van mijn huis. Daarnaast waren de ondersteunende dames zeer geduldig en altijd bereid goed mee te denken. Een mooi voorbeeld van een vrouwelijke combinatie van kracht, zachtheid en toch ook zakelijkheid.
-
Vogelweg 57
10Jiska heeft ons een paar keer bijgestaan met de aan- /verkoop van een woning. Altijd weer met een opgewekt humeur en veel verstand van zaken. In alle gevallen met het meest gunstige resultaat. Kortom een Topmakelaar.
-
Noorderweg 20
10Prettige en directe communicatie, tijdige updates en goed advies over de huizenmarkt en de aangekochte en verkochte woning. Ook fijne, directe communicatie met de backoffice, die de administratie verzorgt en veel zorgen en vooral regelwerk uit handen neemt.
-
Bakkerstraat 33
10Prettige en directe communicatie, tijdige updates en goed advies over de huizenmarkt en de aangekochte woning. Ook fijne, directe communicatie met de backoffice, die de administratie verzorgt en veel zorgen en vooral regelwerk uit handen neemt.
-
Van Ostadelaan 352
10Deze Makelares is zeker een aanrader. Sociaal betrokken, empatisch, vriendelijk, maar wat ook heel belangrijk is, goede bereikbaarheid. Kennis van zaken en een goed team waar ze mee samen werkt. Wij zijn zeer tevreden. Met vriendelijke groet, Mevr. W.m. Mooijen
-
Guldenpad 17
9Tijdens het eerste gesprek hadden wij meteen een goed gevoel bij Jiska. Haar aanpak voelde meteen goed. Het contact verliep heel gemakkelijk tijdens het verkoopproces via whatsapp, mail of telefonisch. Ik vond het vooral fijn om via whatsapp even een berichtje te kunnen sturen. Ook het verkoopplan en snelle handelen en tijdens de verkoop vond ik heel prettig!
-
Laan van Rome 59
10Zoals altijd een makelaar die je duidelijk,eerlijk en goed advies geeft. Je met beide benen op de grond laat staan. Samen met haar team een top makelaar.
-
Melissa Weijers
10Translated by AIWe purchased a house as starters that Jiska and her team had for sale. Despite the fact that we were the buying party, we always felt that Jiska was also ready for us. We have experienced this very pleasantly! Jiska takes the extra step for sellers but also for the buyers of the house. Moreover, the appointments with Jiska are also very pleasant! Thank you very much, the real estate agent!
-
Vangstok 14
9Translated by AIActually, De Makelares just deserves a thick ten. Knowledge of the market, pleasant and good communication and switches at the right moments. In addition, a good supporting team. I definitely recommend De Makelares!
-
Pruikenmakerstraat 45
9Translated by AIThe whole team are top professionals, good explanation of the next step and why this step makes sense. This team has 25 years of experience and I have asked them multiple times in that time to arrange a purchase and/or sale to satisfaction!
-
Nicole De Groot
10Translated by AII have had Jiska multiple times as a selling agent during different economic periods. The Real Estate Agent always thinks with you, sees opportunities that others might not see, and her team is always expert and reliable for you. A nice party to work with!
-
Vogelweg 115
10Translated by AITo start with price/quality: we found the commission percentage quite on the high side, but then you do get something! The real estate agent, Jiska and her team, have a 'no nonsense' attitude; they implement, in consultation with us, a nice sales strategy and have achieved a great result!
-
Van Ostadelaan 370
9Translated by AIPleasant contact and excellent guidance! Apartment sold within no time. Has knowledge of the subject and is forthright.
-
Bellinistraat 129
9Translated by AIProceeded with great initiative. Various new ideas. Sold relatively quickly. Good guidance.
-
Aquamarijn 117
10Translated by AIReal estate agent with a completely unique professional style, sharp eye for both technical construction details and sales value as well as social interaction with potential buyers and/or purchasing agents. Friendly and helpful. Excellent team in the office.
-
Randersdijk 6
10Translated by AIJiska is a very good communicator. From the first conversation, she has not only been very friendly but also very clear. She understands the market well and uses that knowledge to explain why she makes certain proposals. Jiska always thinks along and is very personally involved in every step of the process. I am very happy that Jiska completely relieved me of worries and achieved a beautiful result. In any possible next time, I will definitely choose Jiska again.
-
Vlietwaard 17
9Translated by AIEverything ran like a train. Skilled people and good service with a portion of humour as well. I am very satisfied!
-
Koorstraat 21 C
10Translated by AIVery satisfied. Available when needed, professional, reliable and expert. Understands what's important. And takes the time to answer my questions.
-
Wilgenlaan 37
10Translated by AIGood contact. No nonsense and quickly sold. Professional and clear communication. Easily accessible and very happy with the result