Spauwen | Werrij

In Heerlen, Spauwen | Werrij offers reliable real estate services with a strong focus on the region. We combine knowledge of the local market with a personal approach to help you with every transaction, whether it's about residential or commercial property. Our promise is transparency, professionalism and an approach that aligns with your goals. We offer service in sales, purchases, rentals and appraisals. Our working method is results-...
Current housing stock
-
- Available
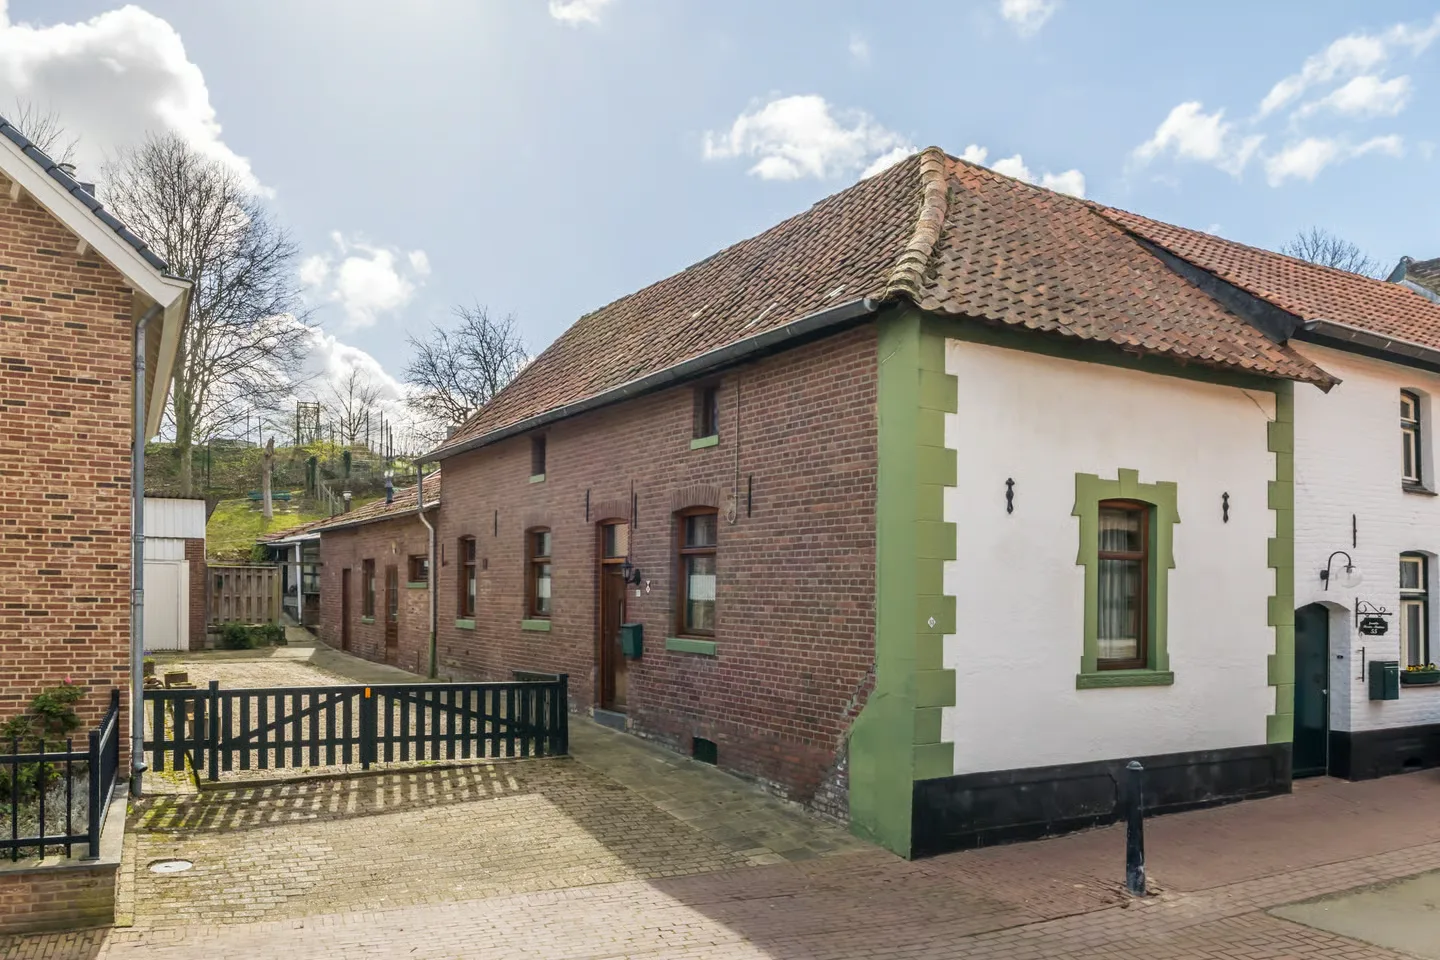
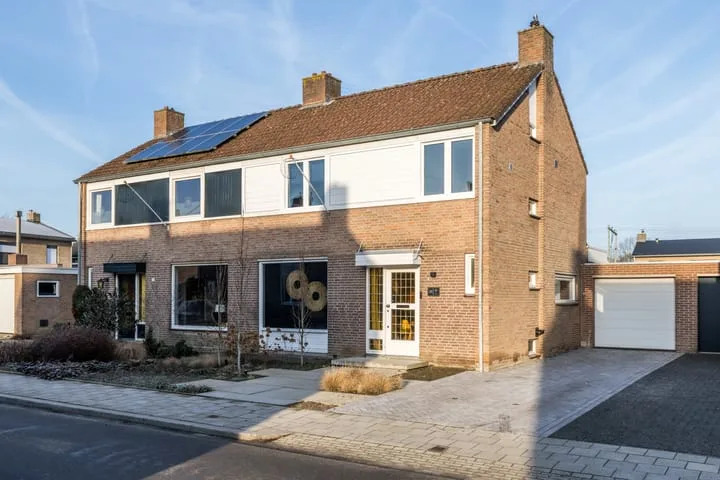
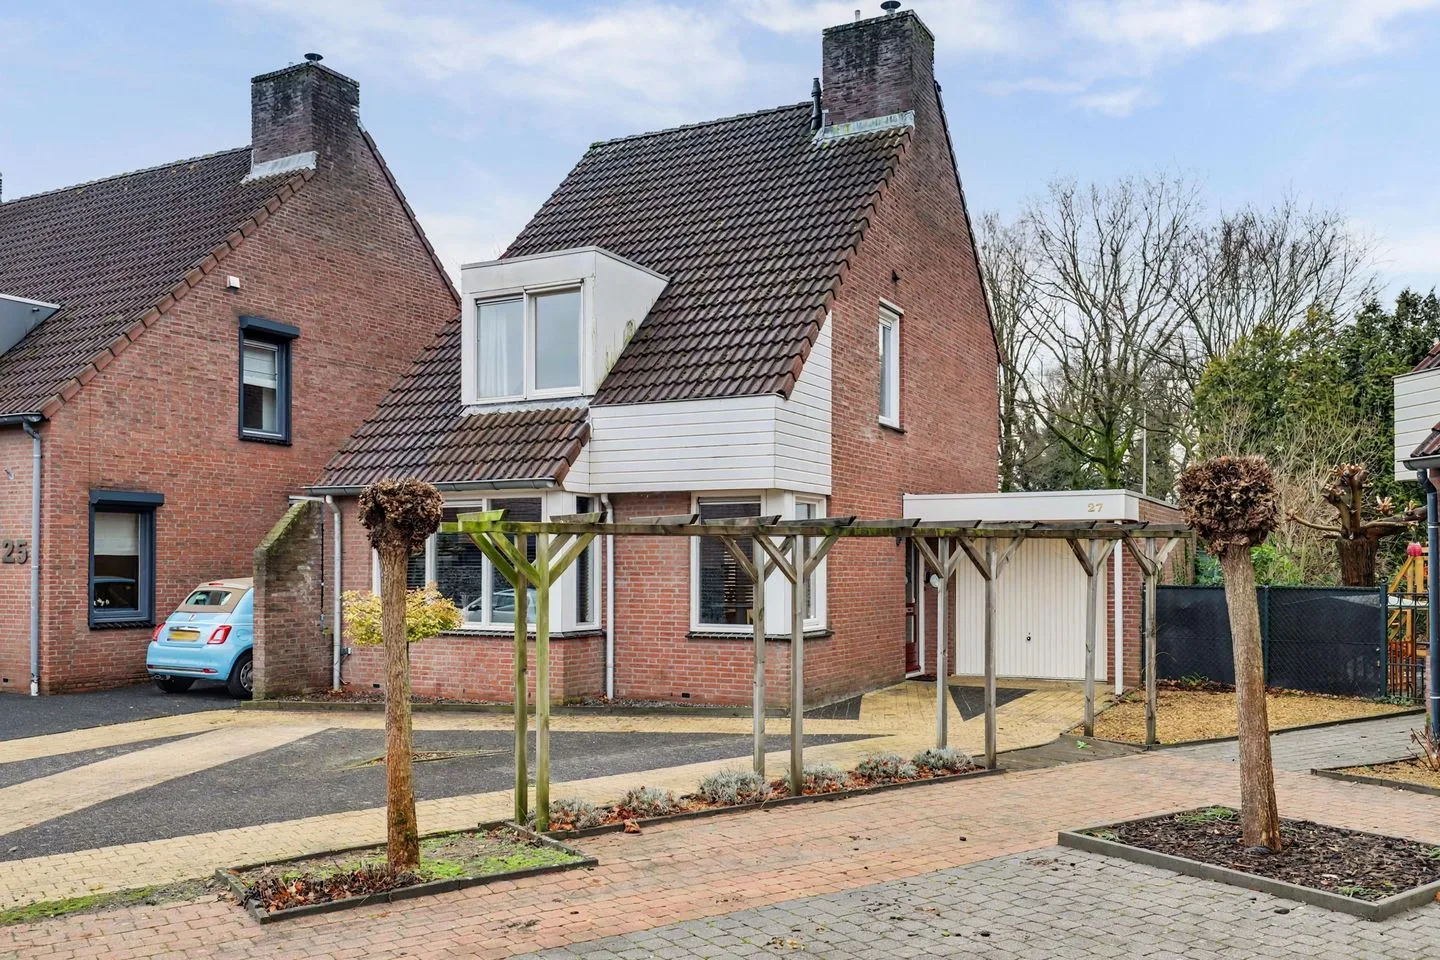
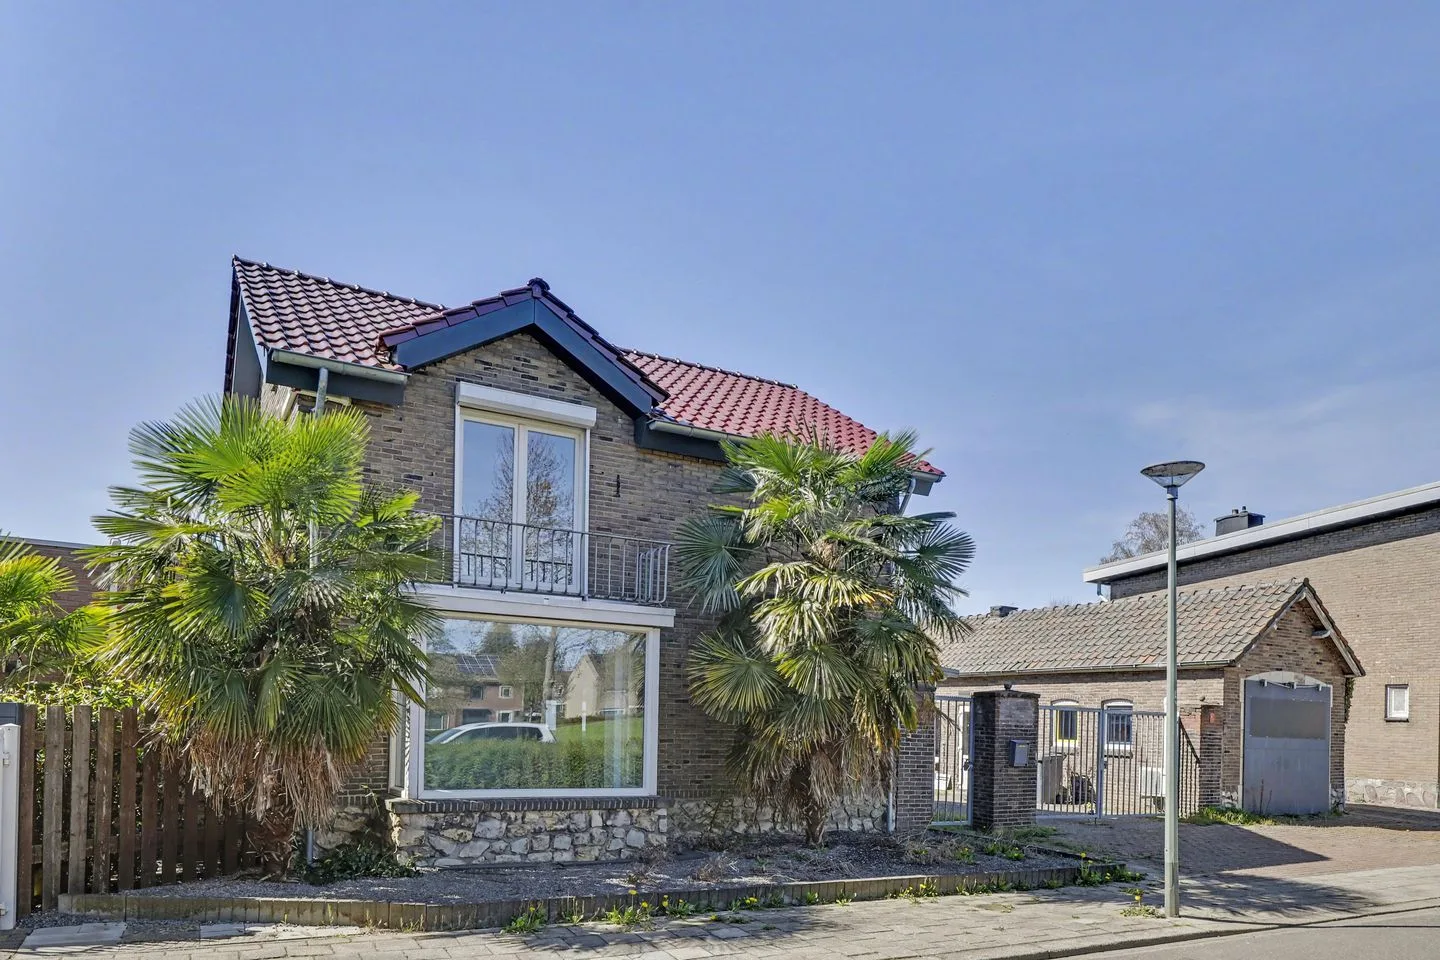
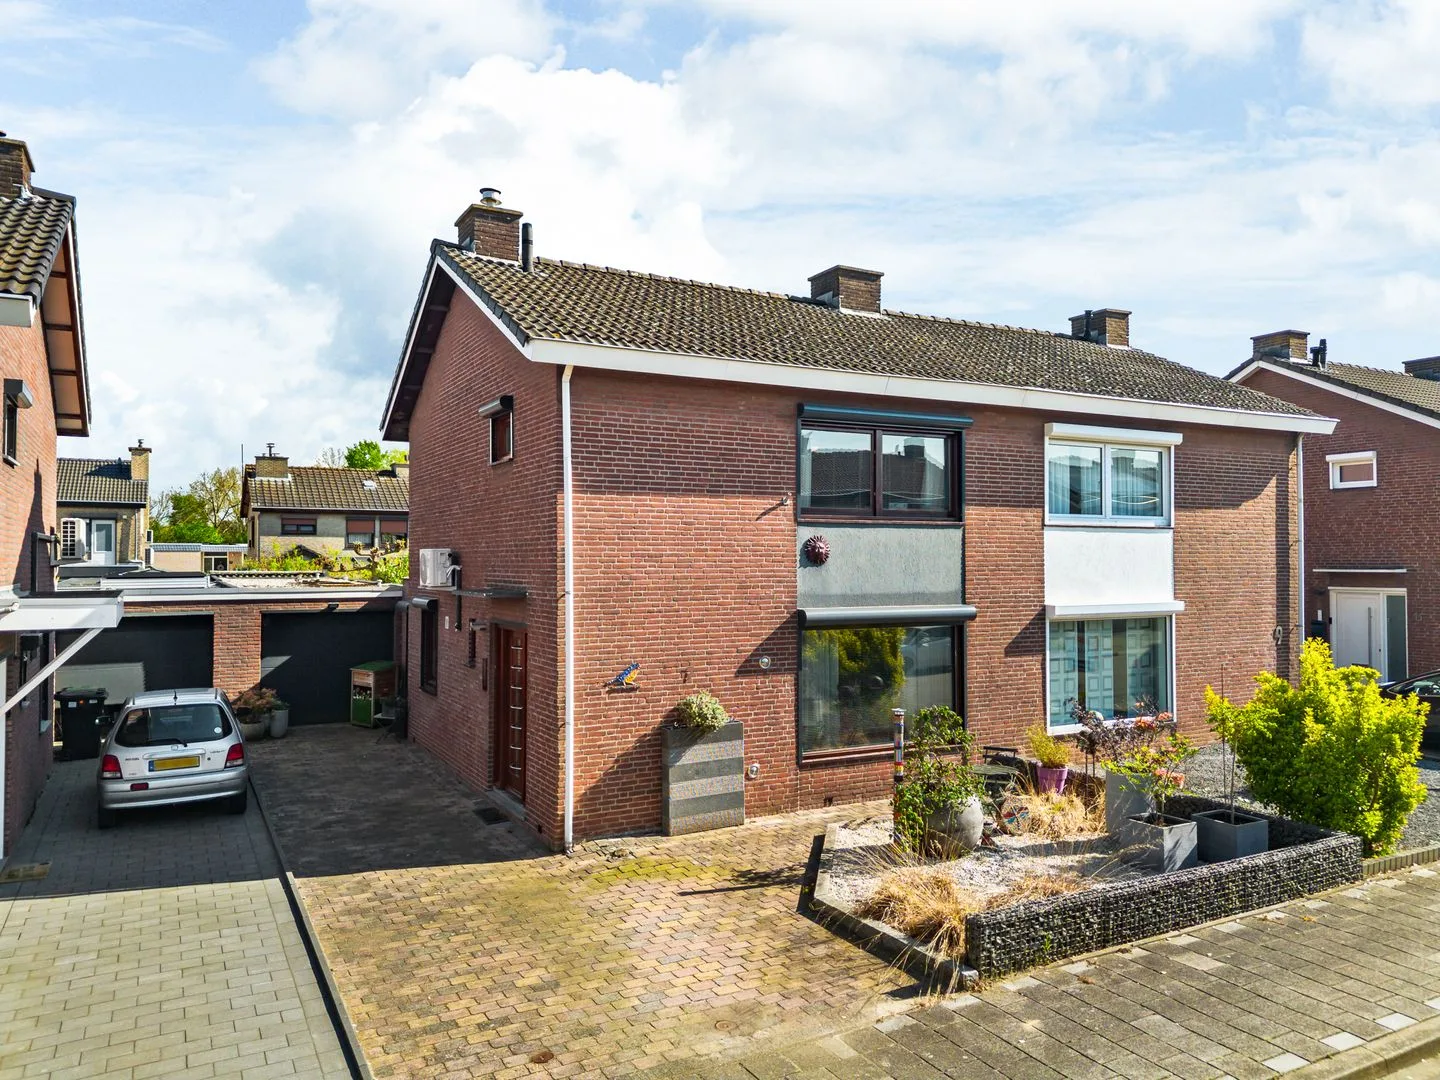
Nieuwenhagerstraat 19
6374XN Landgraaf
€ 215.000 k.k.
GSave as favorite- Living area
- 78 m²
- Land area
- 256 m²
- Bedrooms
- 3
-
- Available
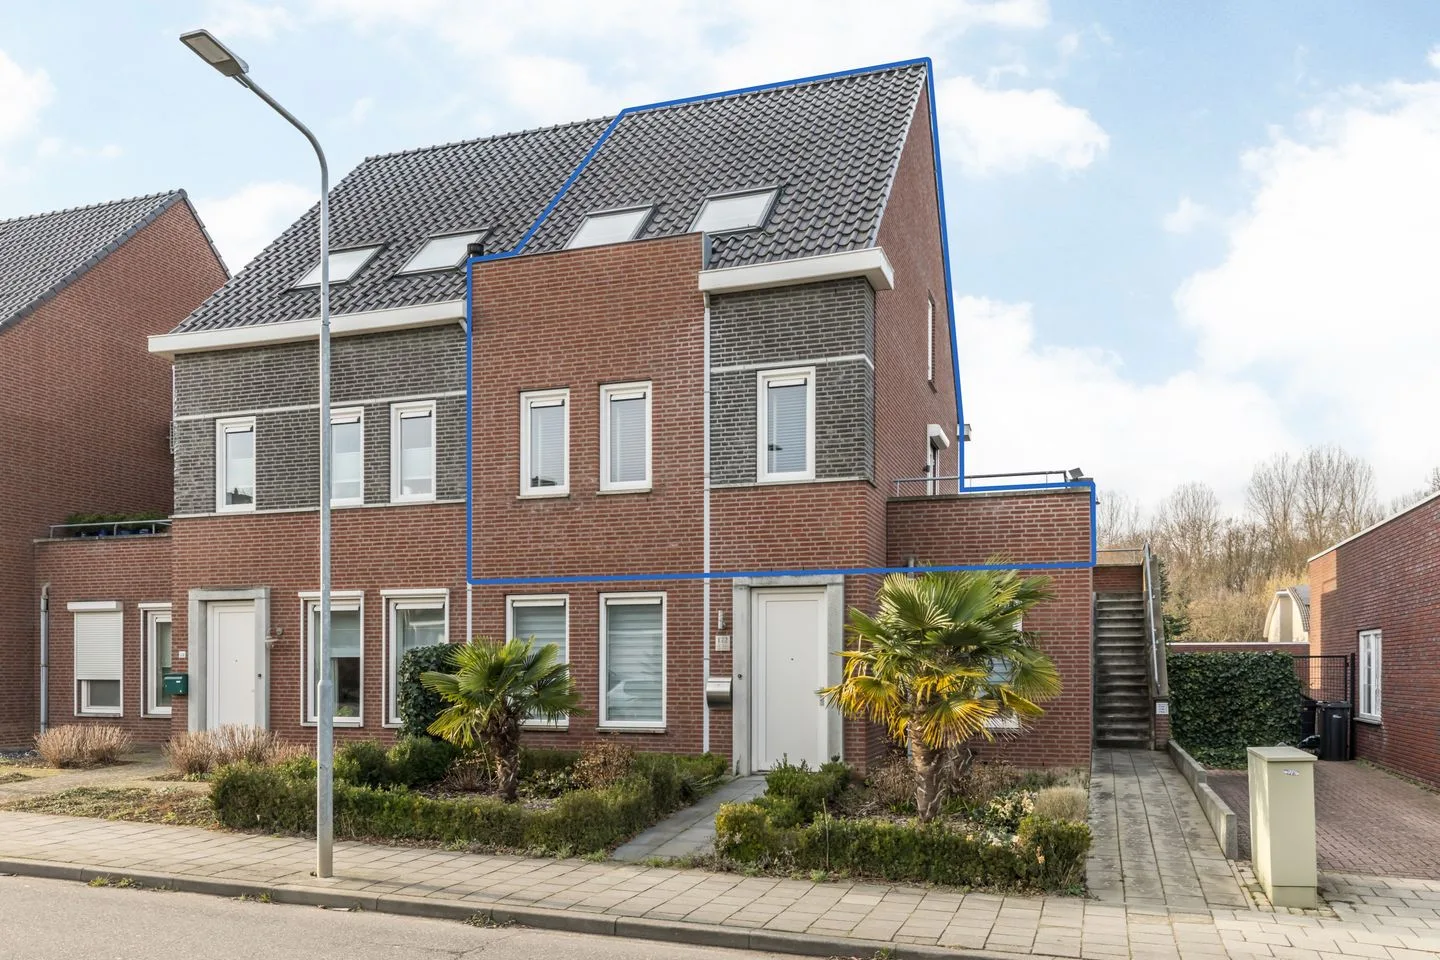
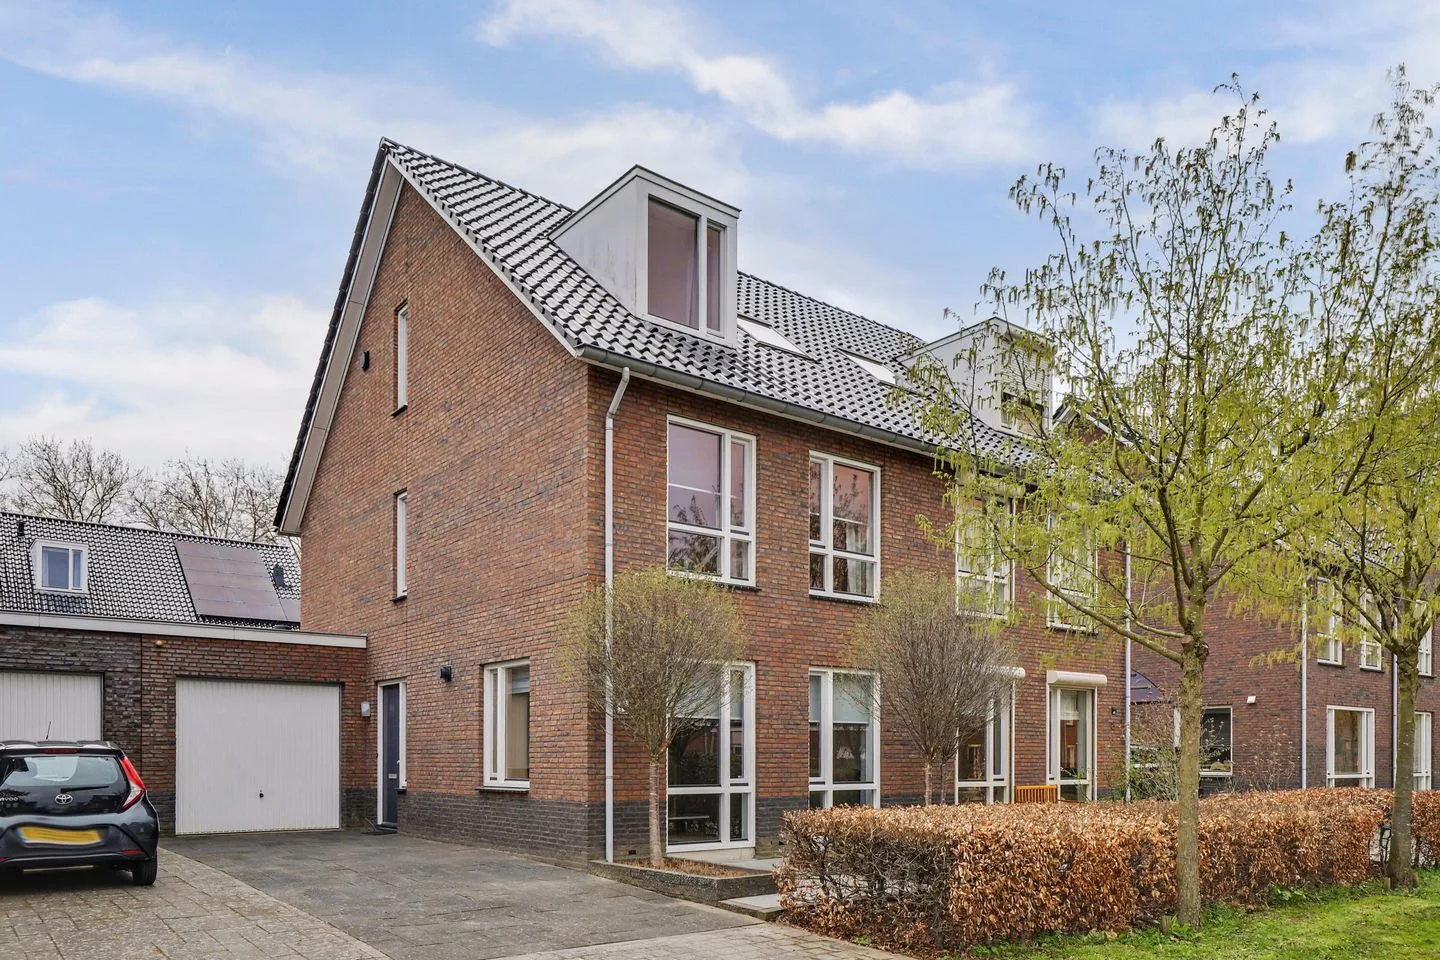
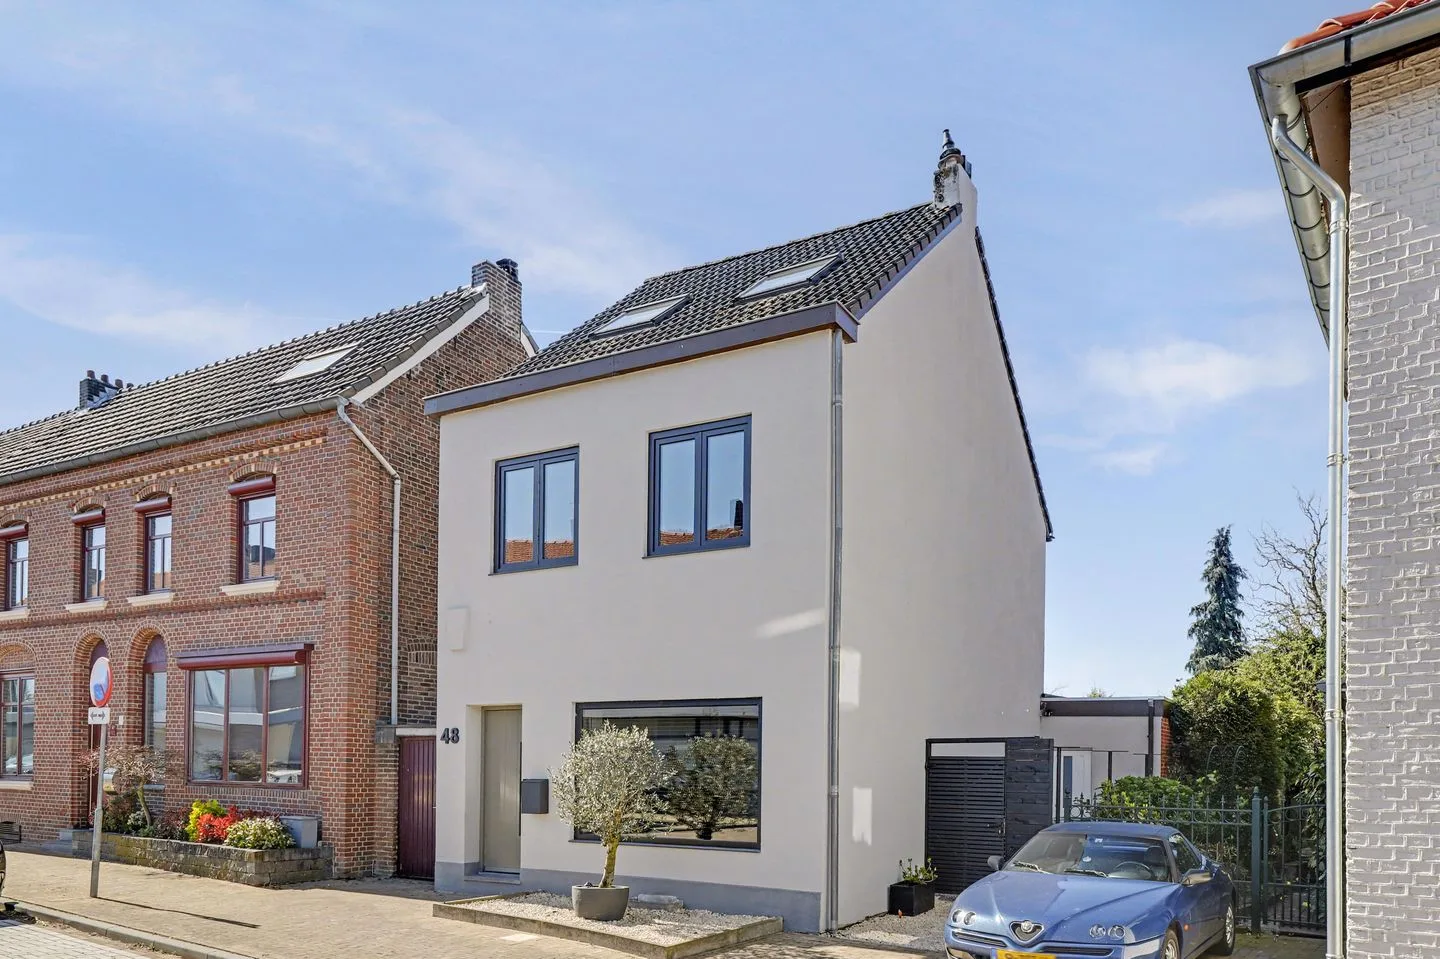
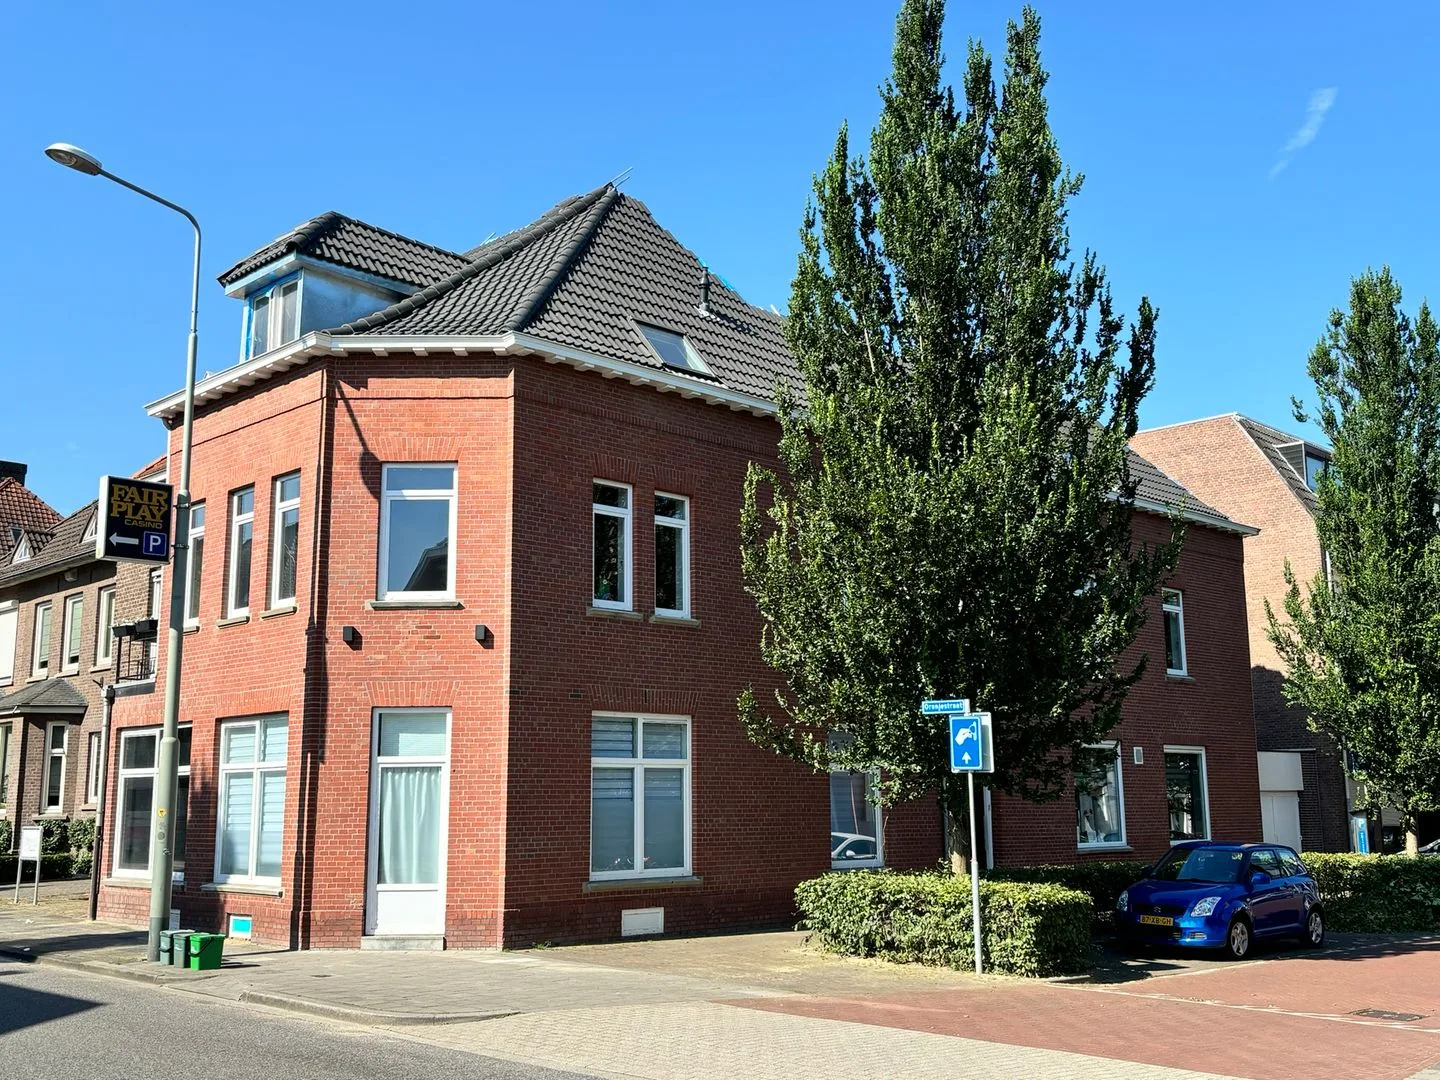
Stiftstraat 7
6374AW Landgraaf
€ 395.000 k.k.
€ 3.496/m²
BSave as favorite- Living area
- 113 m²
- Land area
- 269 m²
- Bedrooms
- 3
-
- Available
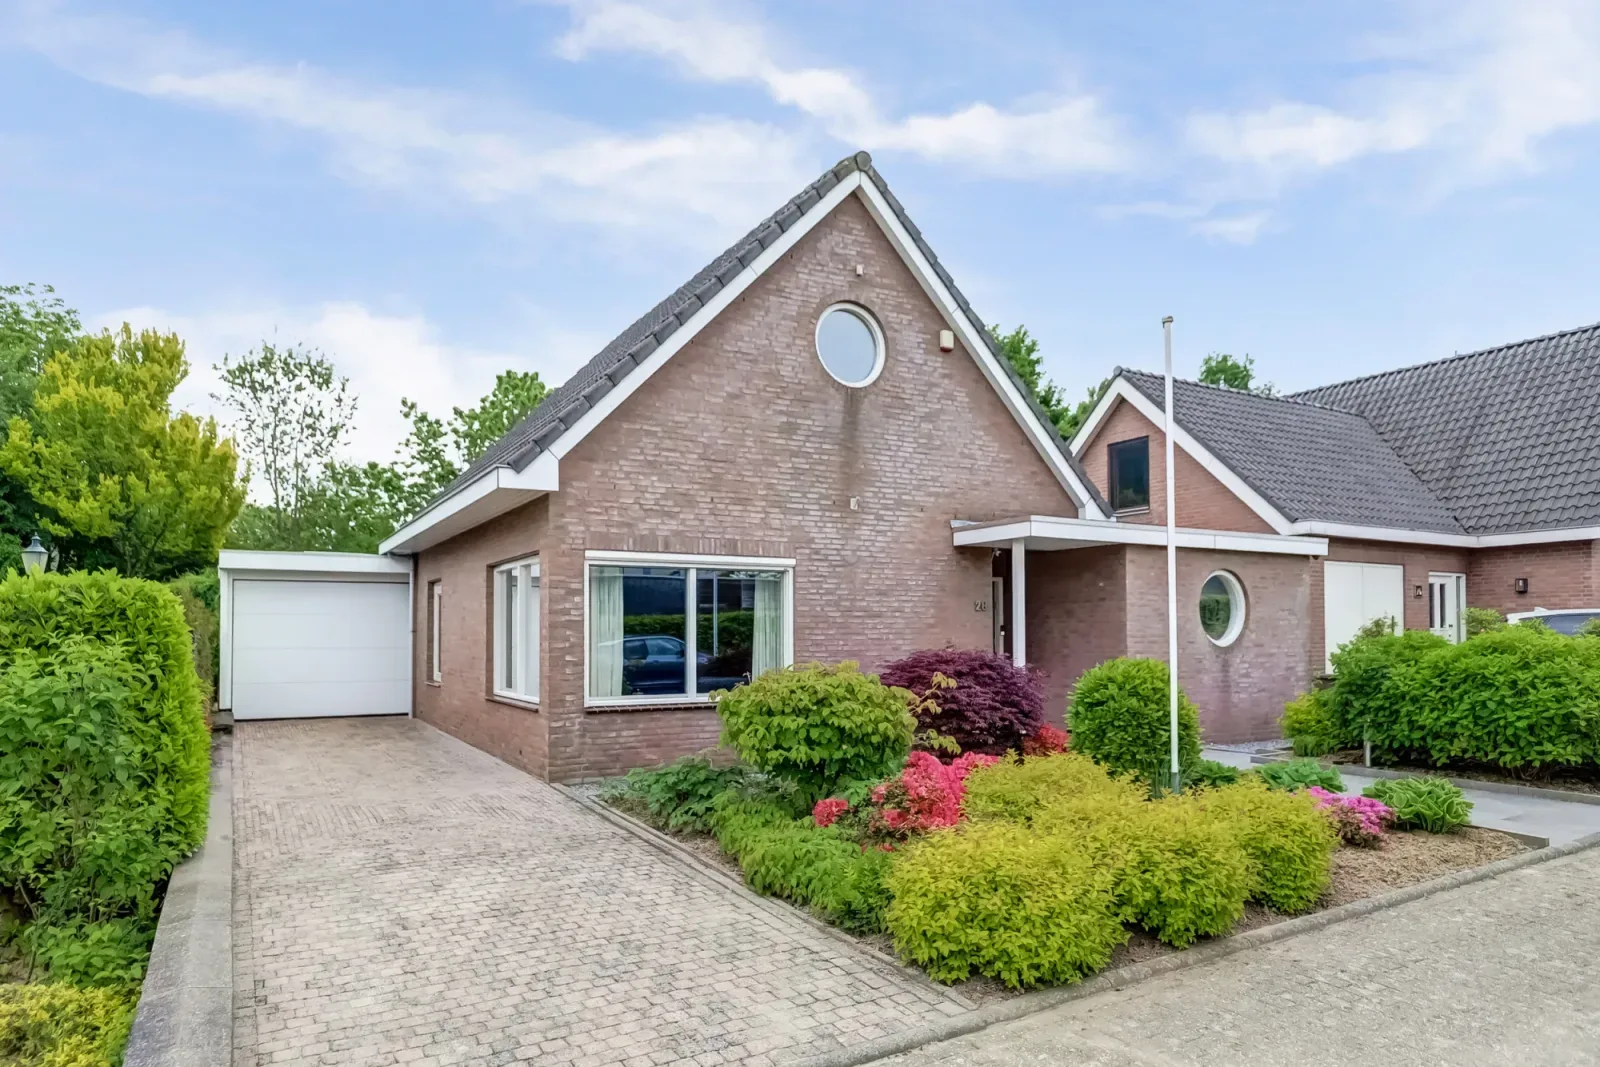
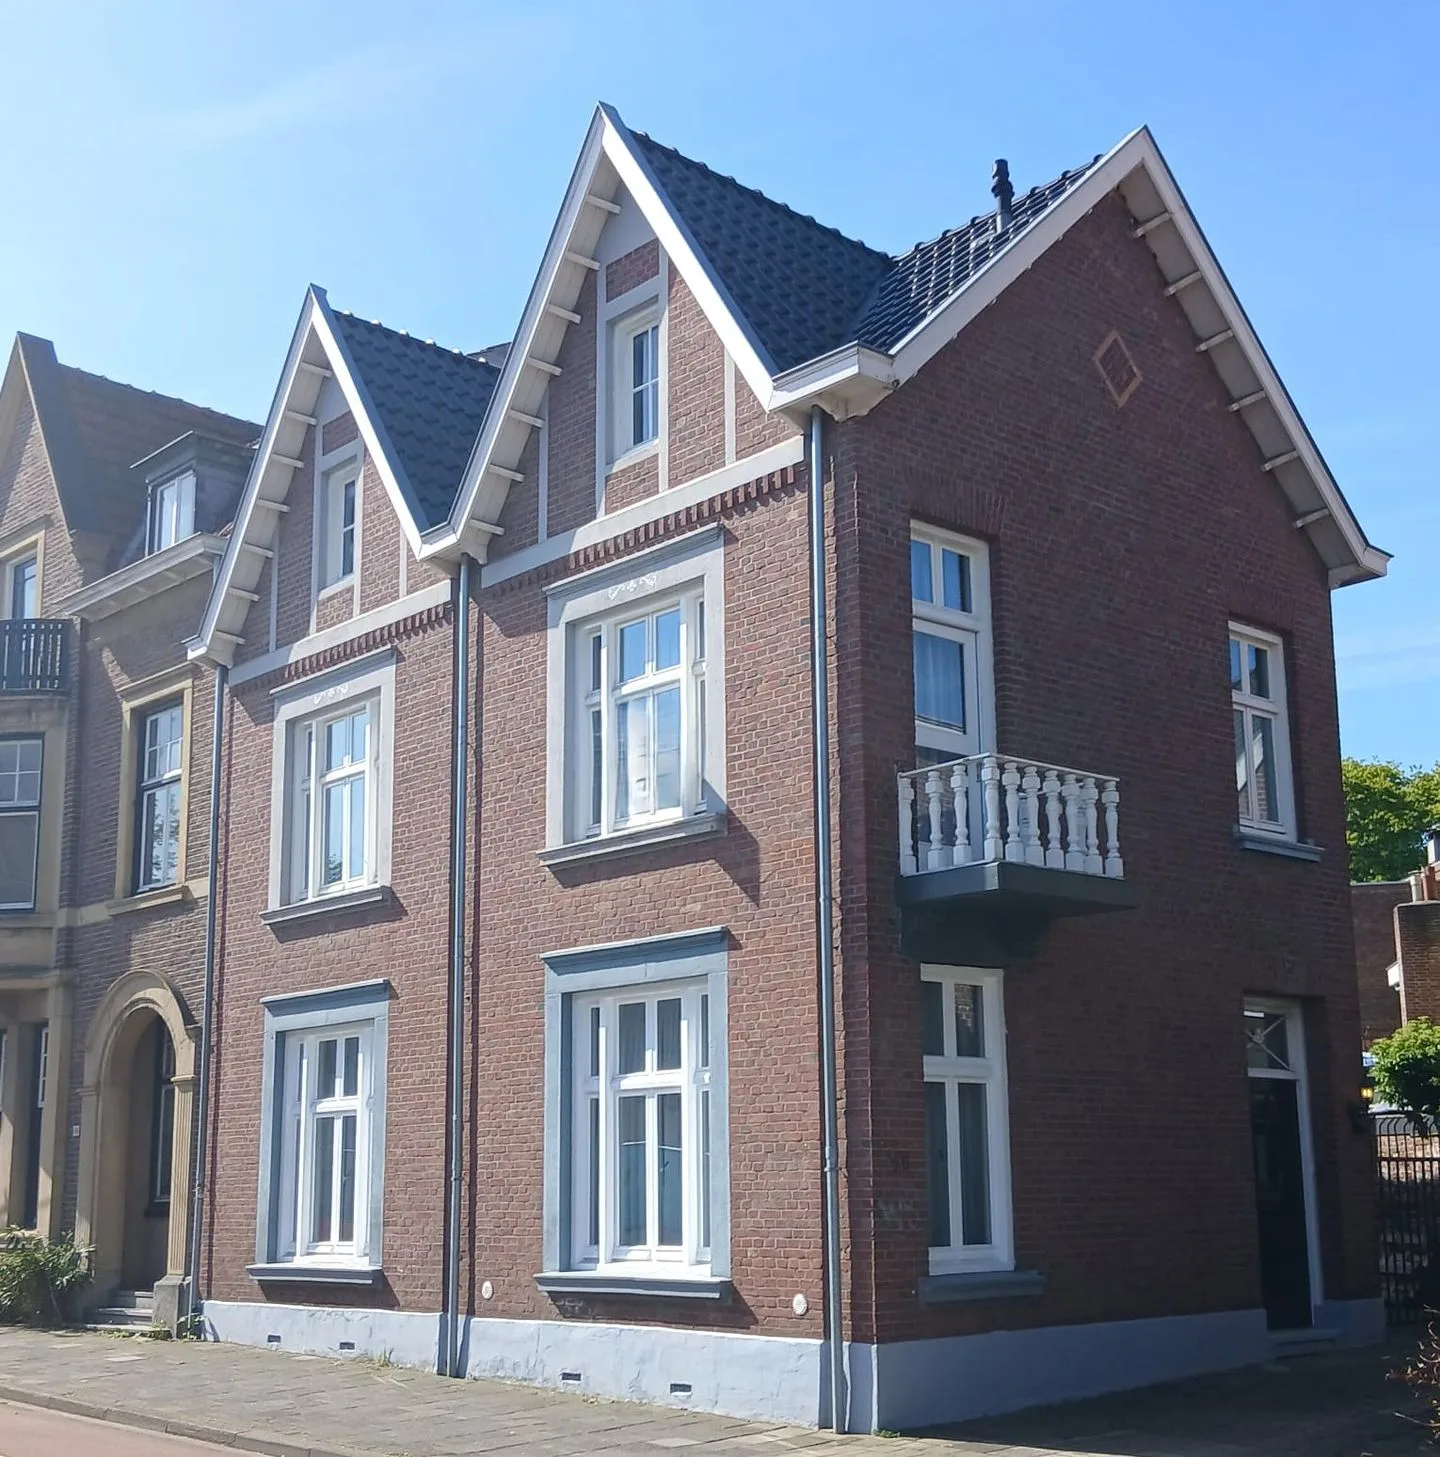
Kloosterraderstraat 64
6461CD Kerkrade
€ 595.000 k.k.
€ 2.052/m²
DSave as favorite- Living area
- 290 m²
- Land area
- 287 m²
- Bedrooms
- 5
-
- Available
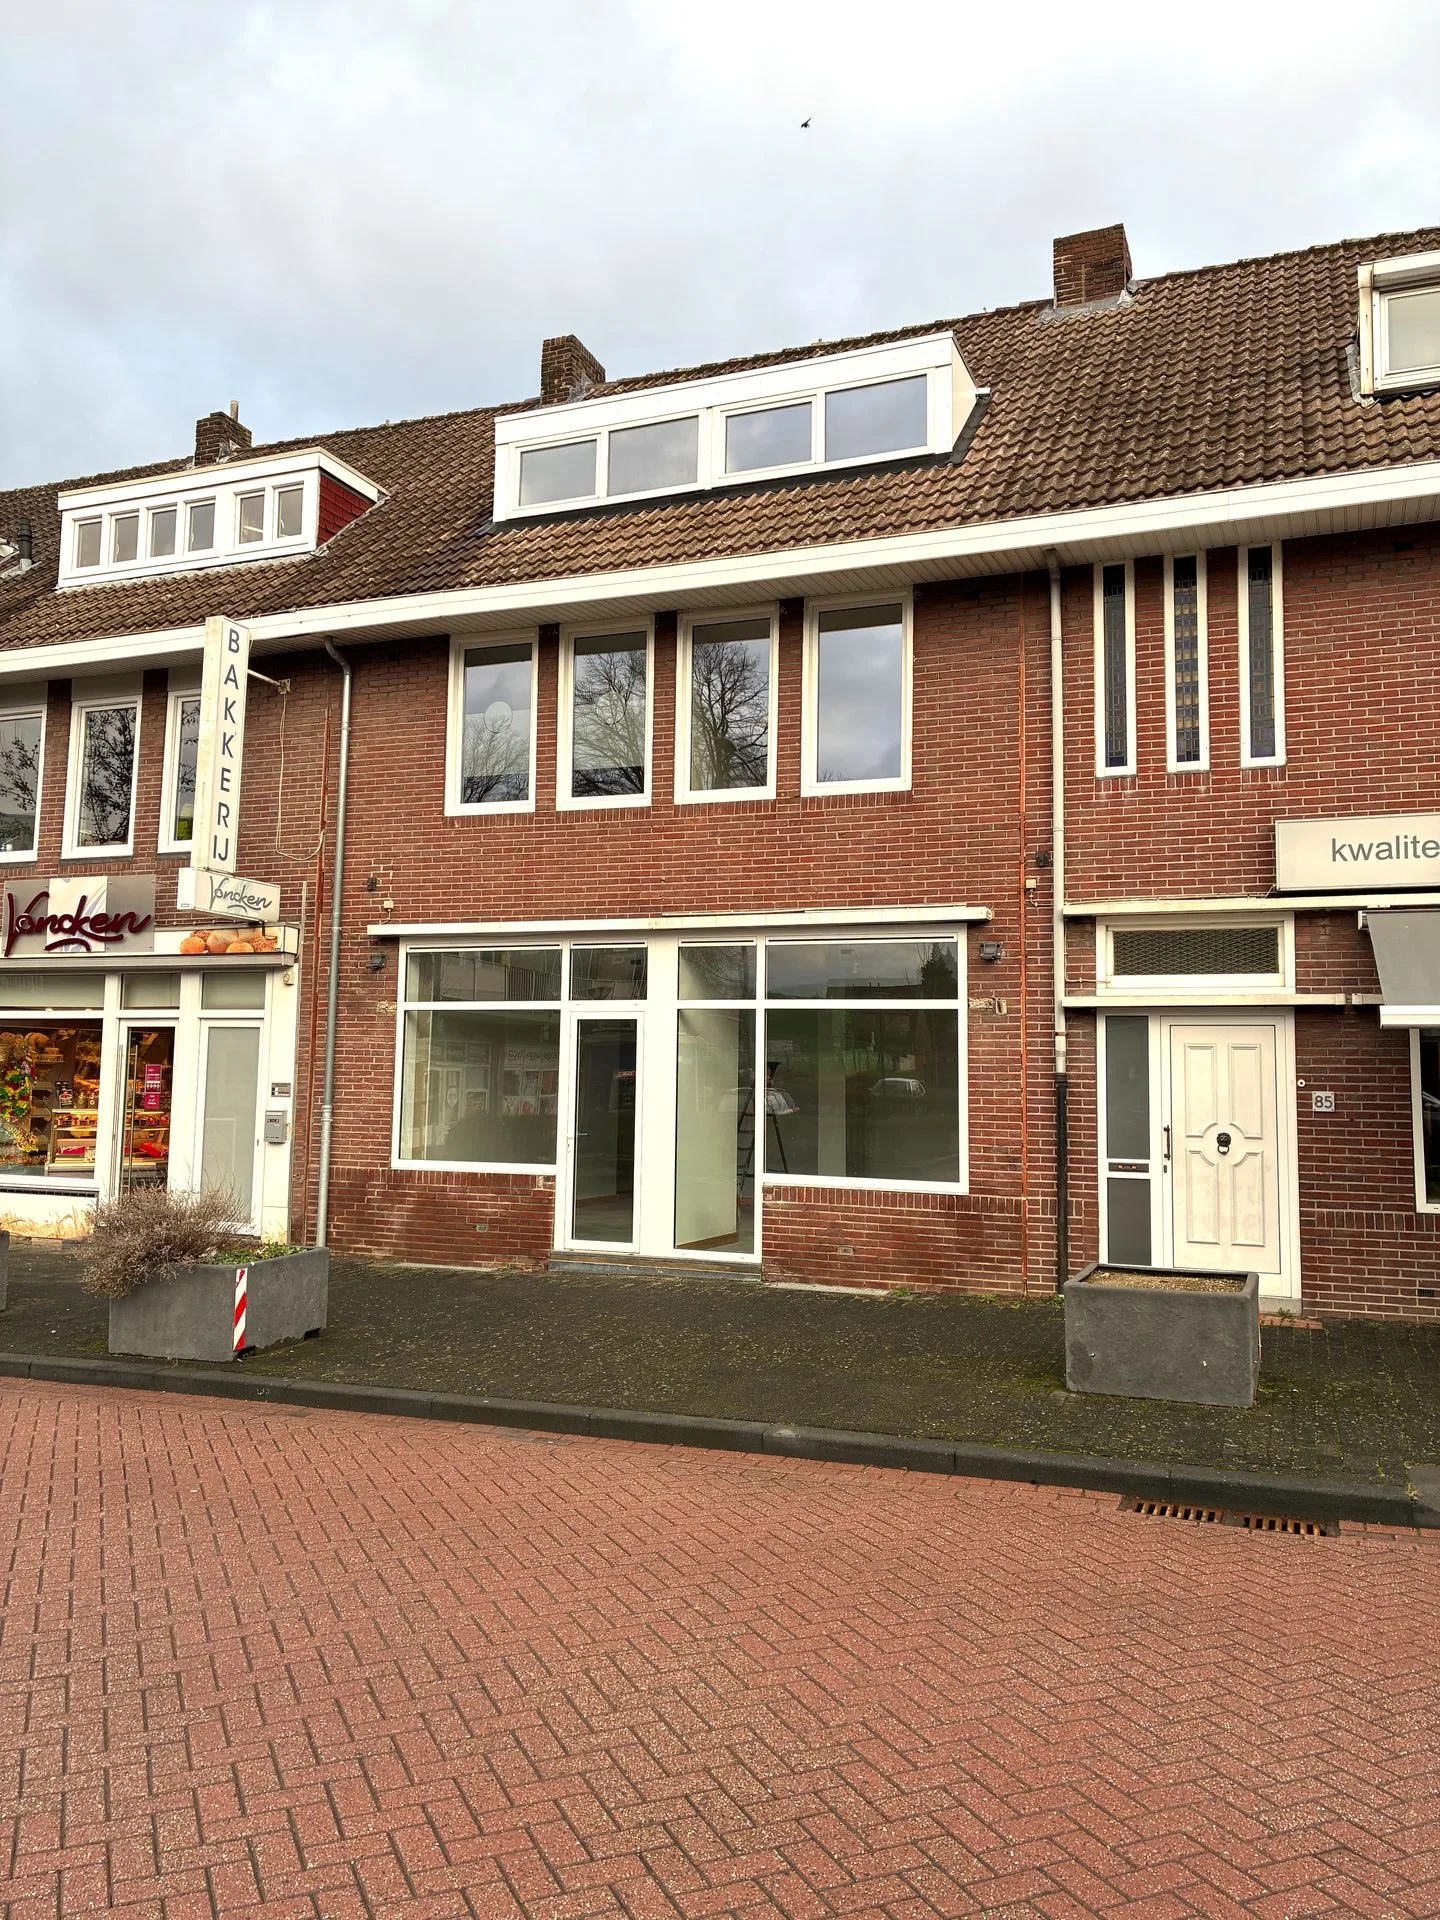
Kruisstraat 16
6411BT Heerlen
€ 549.000 k.k.
€ 3.268/m²
ESave as favorite- Living area
- 168 m²
- Land area
- 169 m²
- Bedrooms
- 4
-
- Available
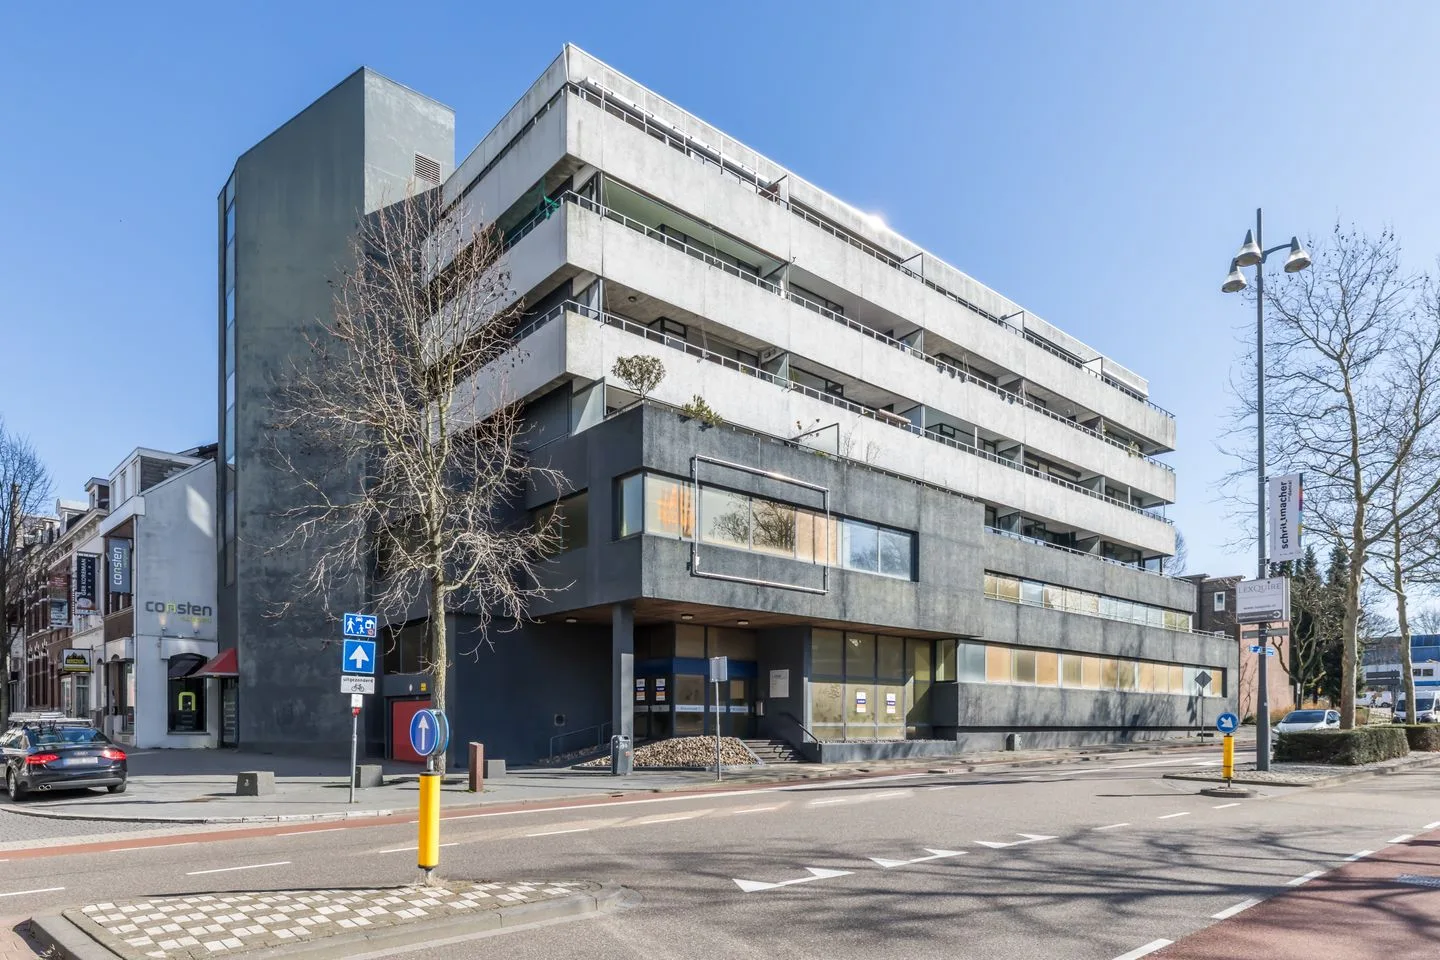
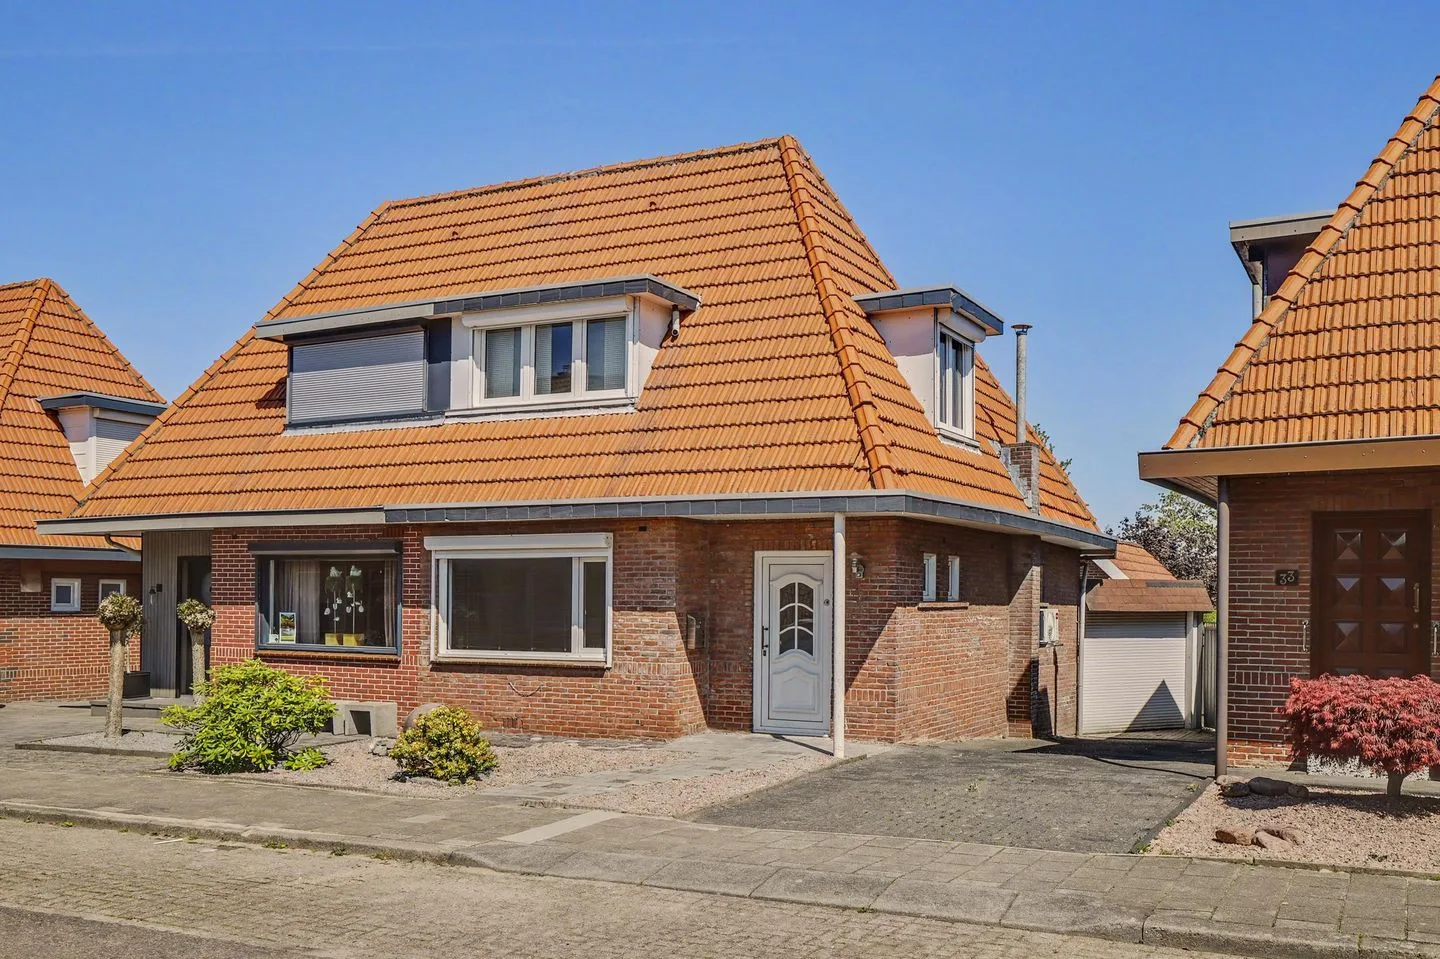
Kasteellaan 83
6415HN Heerlen
€ 299.000 k.k.
€ 1.812/m²
CSave as favorite- Living area
- 165 m²
- Land area
- 93 m²
- Bedrooms
- 4
-
- Under consideration
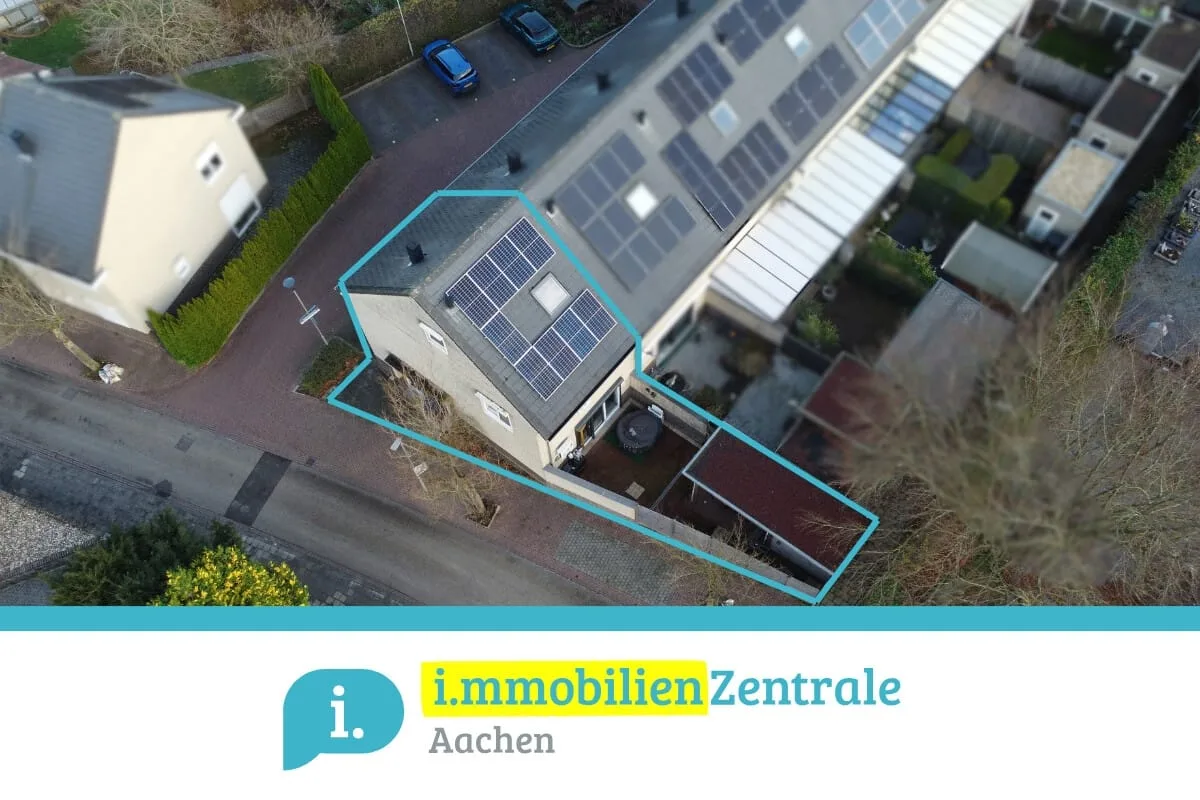
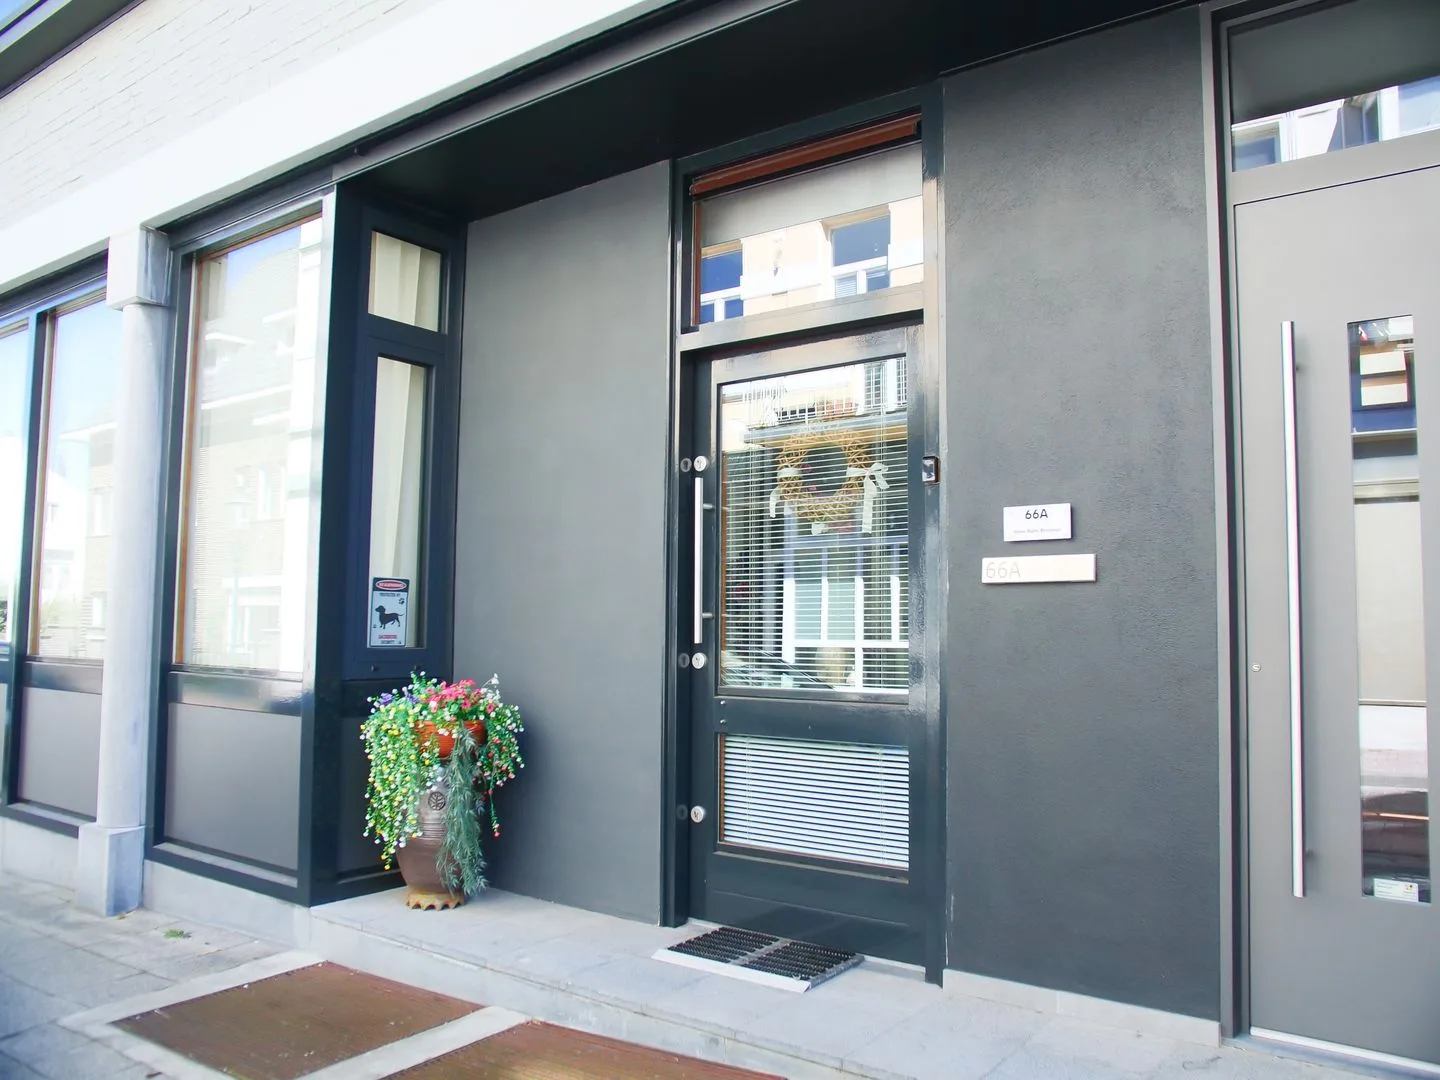
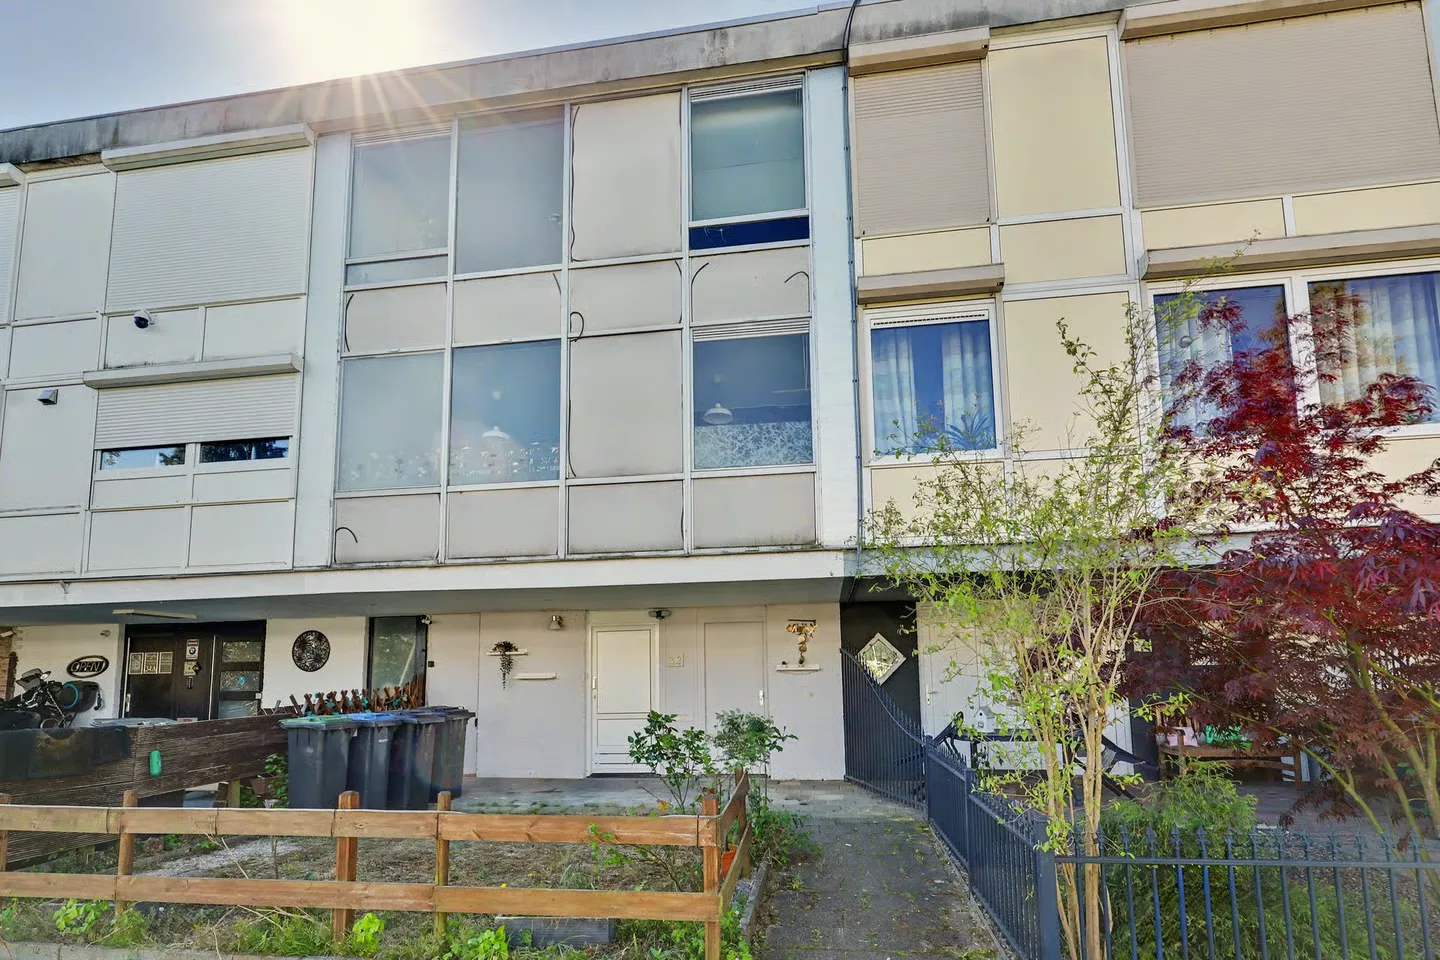
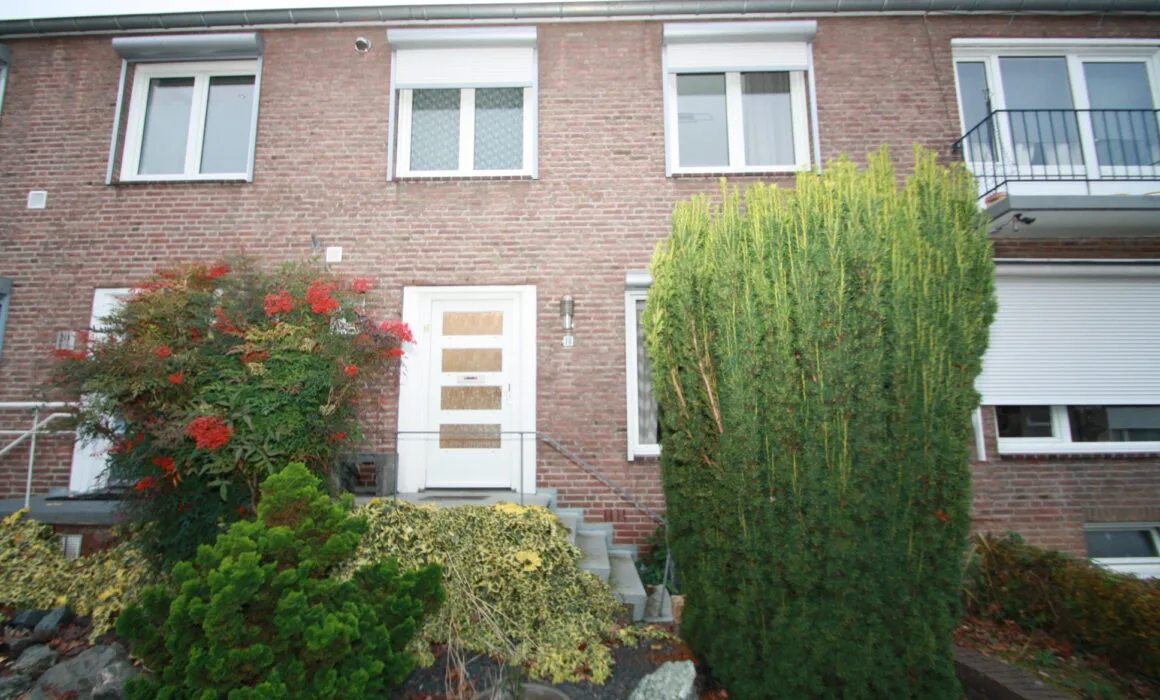
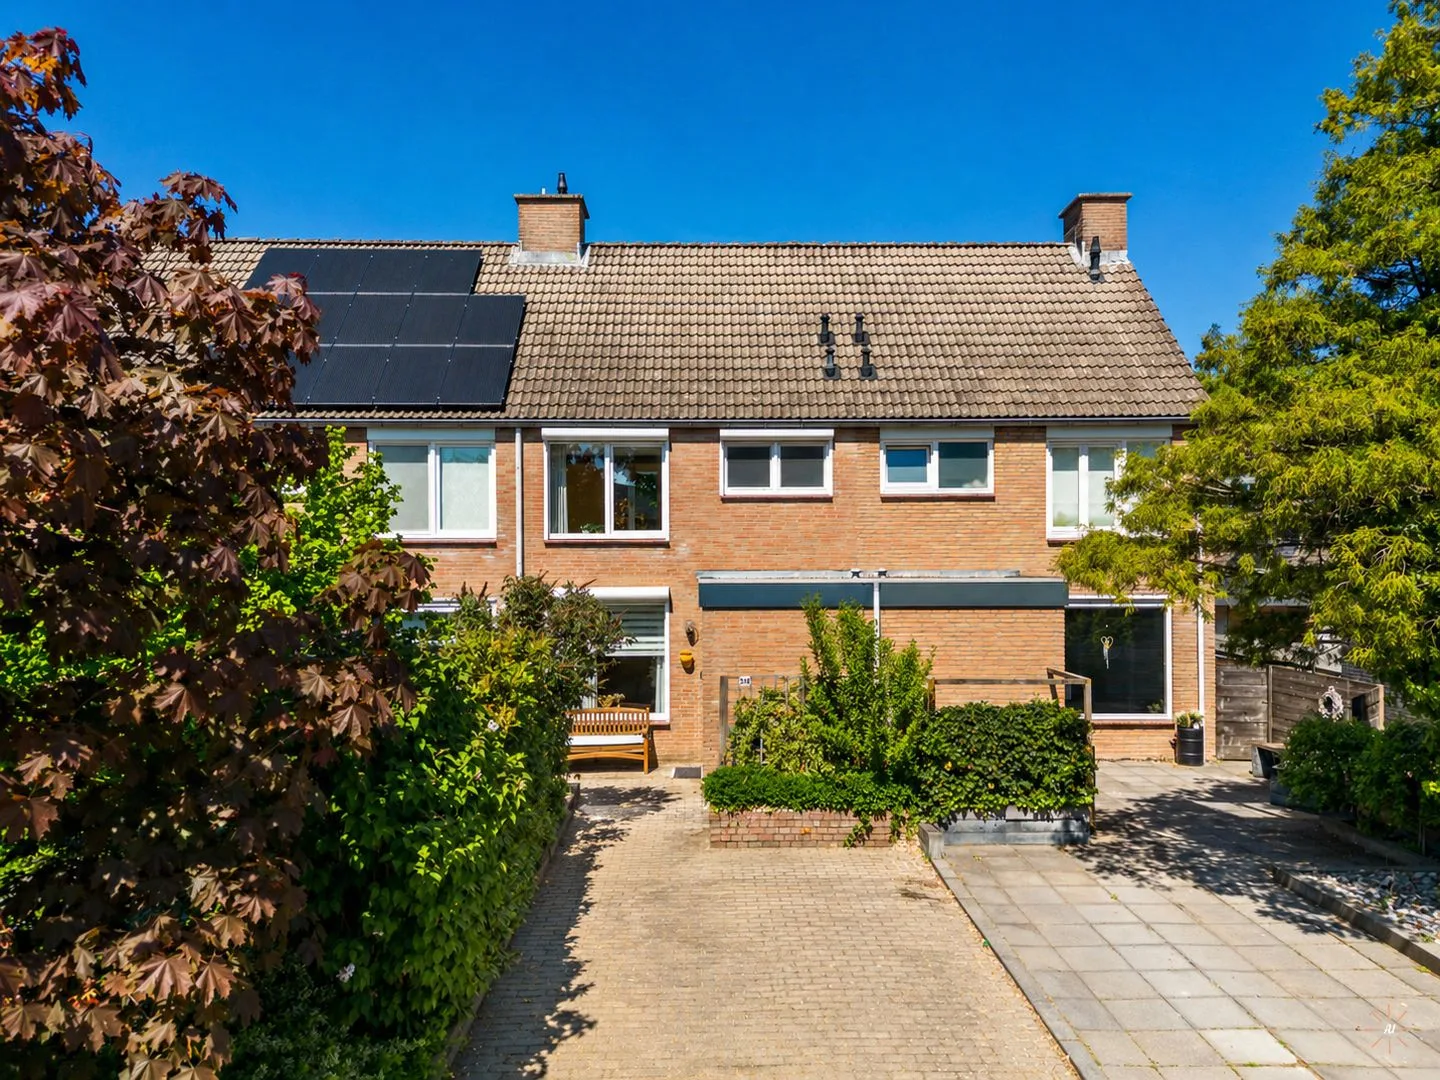
Palestinastraat 380
6418HX Heerlen
€ 315.000 k.k.
€ 2.838/m²
DSave as favorite- Living area
- 111 m²
- Land area
- 212 m²
- Bedrooms
- 4
Reviews (88)
Review platforms
BronscoresTotal score
88 total reviews

Funda
32 reviews on Funda

56 reviews on Google
-
Rob Reijnen
10Translated by AIExcellent guidance received with the sale of our parental home! Thanks, Marcel Werry, for the professional and quick approach!
-
Marcel Kok
10Translated by AIRecommended! Short lines that have led to a quick result.
-
Den Haagstraat 48
10Translated by AIWe are extremely satisfied with the support during the sale of my mother's house. From the first contact until completion, everything went professionally, clearly and with a lot of involvement. We were kept fully informed throughout the entire process. In short, we can absolutely recommend him.
-
Gonda Couvee
10Translated by AIVery fine support had Marcel werrij you are a phenomenal real estate agent. Someone who has heart for his job. Quick responses to email and app contact. Ready and comes up with good advice.
-
Desirée
10 -
Mirjam Meijer
10Translated by AIFine, honest real estate agent. Marcel keeps his appointments and responds appropriately to emails, phone calls or apps. Thank you for the quick sale.
-
Marko
10Translated by AIExcellent support. We are very satisfied with the cooperation with this real estate agent. From the first contact, the communication was clear, fast and professional. We were well guided throughout the entire process and could always turn to them with our questions. The real estate agent has a lot of knowledge about the local market and actively thought along with us. Everything went smoothly and we felt really relieved. In short: a reliable and involved real estate agent that we would definitely recommend.
-
Bekkerweg 123
10Translated by AIMarcel expertly, professionally and kindly accompanied me from start to finish with the (super fast) sale of my house. I received good advice and everything went smoothly and pleasantly. The photos and videos made did the house real justice. Apart from the sale of my house, Marcel has given me advice and help several times with searching and buying my new home, which was very welcome and which I value highly. In short, if you are looking for a good real estate agent in the region, look...
-
Salesianenstraat 24
9Translated by AIAfter the pleasant experience of purchasing our home, the decision was quickly made to also let this real estate agent handle the sale. We were again excellently assisted: good guidance, clear communication and a smooth sale. Absolutely recommended!
-
Agnes Lenzen
10Translated by AIThe purchase of the apartment and the sale of our house has gone very well thanks to Marcel Werrij. We have experienced the contact with him as a very pleasant experience.
-
Haghenstraat 17 A
10Translated by AIMarcel is an amazing real estate agent who really has an eye for what you as a seller need! Extremely pleasant to work with and very easy to reach.
-
Marloes van Well
10Translated by AIVery fine, professional and personal guidance in the sale of my house. Knowledge of the subject, honest, helpful and very accessible! Very satisfied! Thank you Marcel.
-
Frans Lambi
10Translated by AIExpert service, reassuring and excellent communication. I can wholeheartedly recommend this real estate agent.
-
Aarweg 3
10Translated by AIVery pleasant cooperation. Good advice and guidance! Emotionally it took a while, but that is inherent to the current housing market.
-
Wolterstraat 16
10Translated by AIExpert real estate agent who knows the local market better than anyone else. The communication was smooth and all expectations were met.
-
Grachtstraat 17
10Translated by AIVery fine, professional and personal guidance in the sale of my house. Knowledge of the subject, honest, helpful and very accessible! Very satisfied! Thank you Marcel.
-
Putstraat 20
10Very competent and communicative real estate agency. The apartment was sold quickly. I highly recommend them.
-
Frank Schnitzeler
10Translated by AITop service provided by Marcel during the sale. Very proactive and responsive, even outside of working hours. Listens to customer wishes, a real recommendation!
-
Pastoor Scheepersstraat 12 C
9Translated by AIIn a time when many brokers practice their profession with haste and distance, it is a breath of fresh air to work with someone like Marcel Werrij. Involved, expert, and with a human touch. From the first contact, it was clear: here speaks a professional with love for his work. He knows the market inside and out, advises honestly and thinks in terms of possibilities without making empty promises. No smooth sales pitch, but clear explanations and strategic advice. The result? Ee…
-
Middelburgstraat 38
10Translated by AIMarcel Werrij gave us the confidence from the first moment that our house would be sold quickly. Always kept us well informed about the progress and was also very accessible. Gives good advice and is also really nice. Thanks Marcel!!!