In Oirsbeek, Ralf Trafas Makelaardij en Vastgoed offers reliable and personal real estate services. With a strong focus on the region, the office provides professional support in buying or selling homes and real estate. The promise is clear: transparency, expertise, and a personal approach to satisfy every customer. The office offers services such as sales, purchases, and appraisals. With a thorough working method and dedicated team, Ra...
Current housing stock
-

- Available
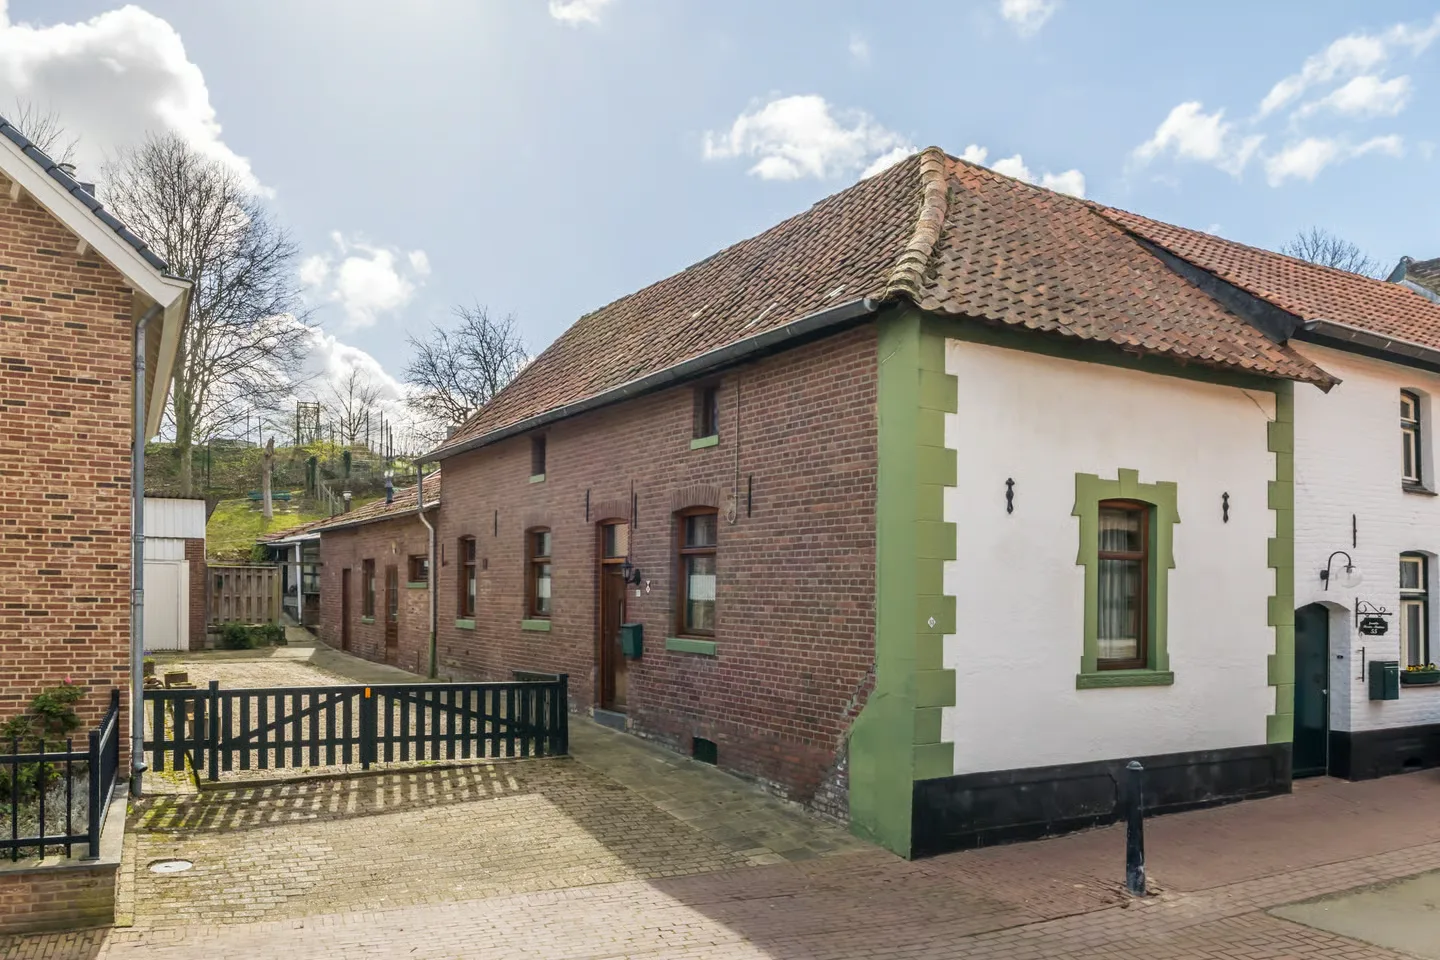
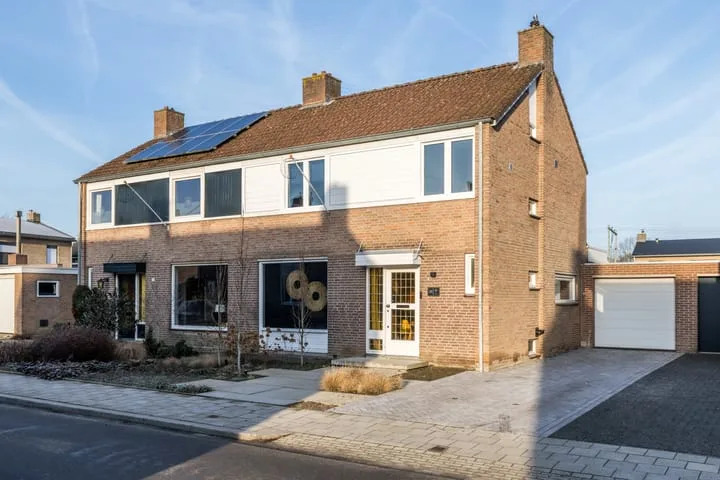
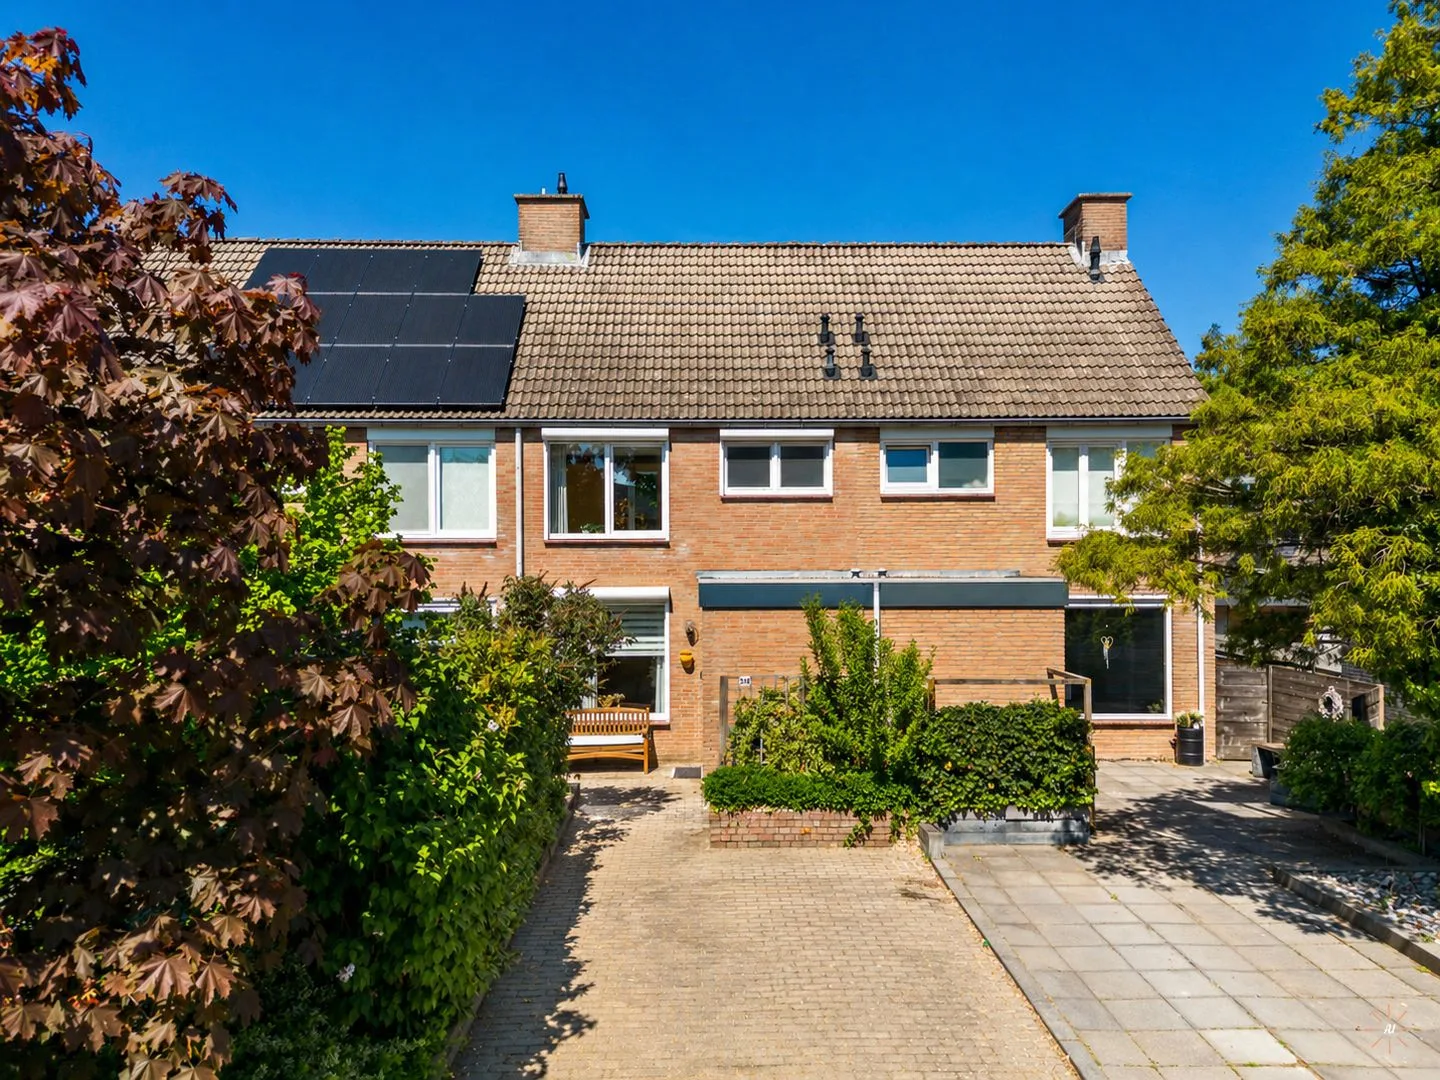
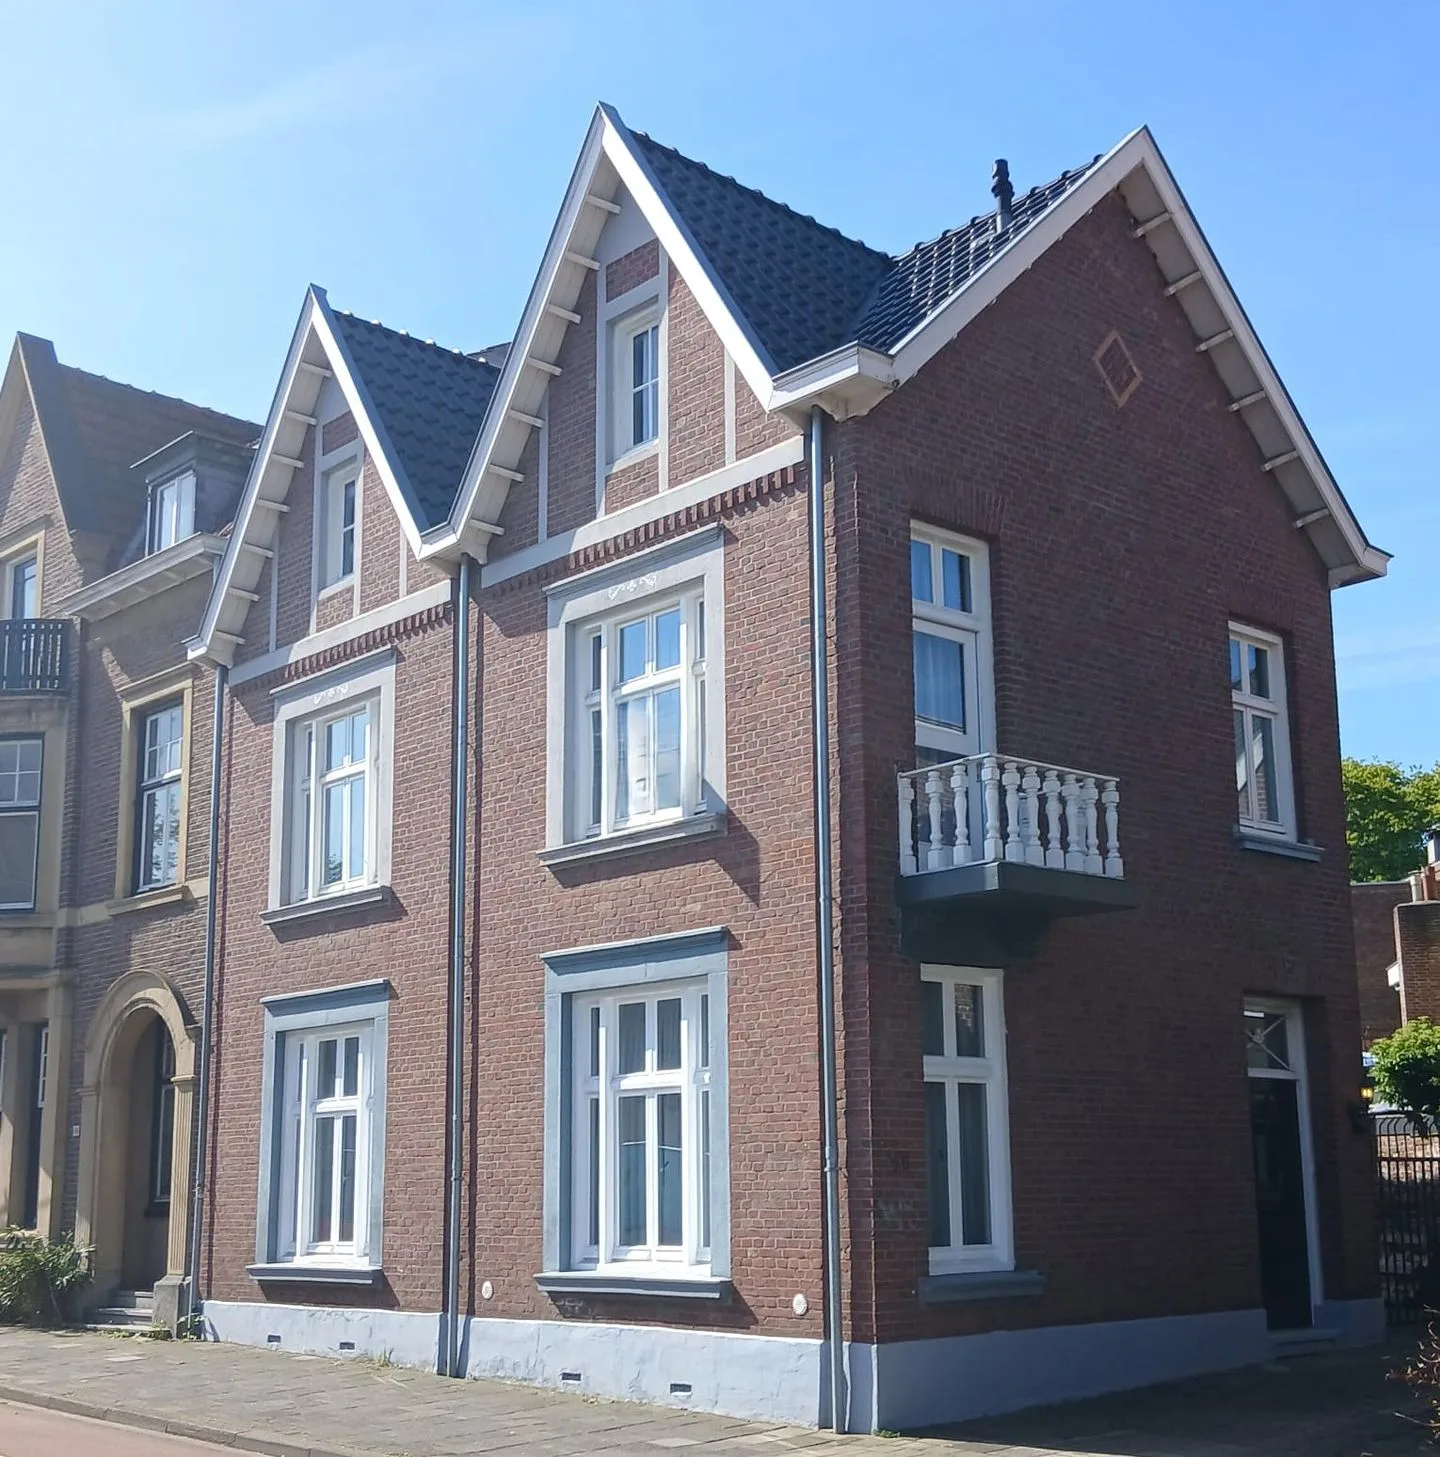
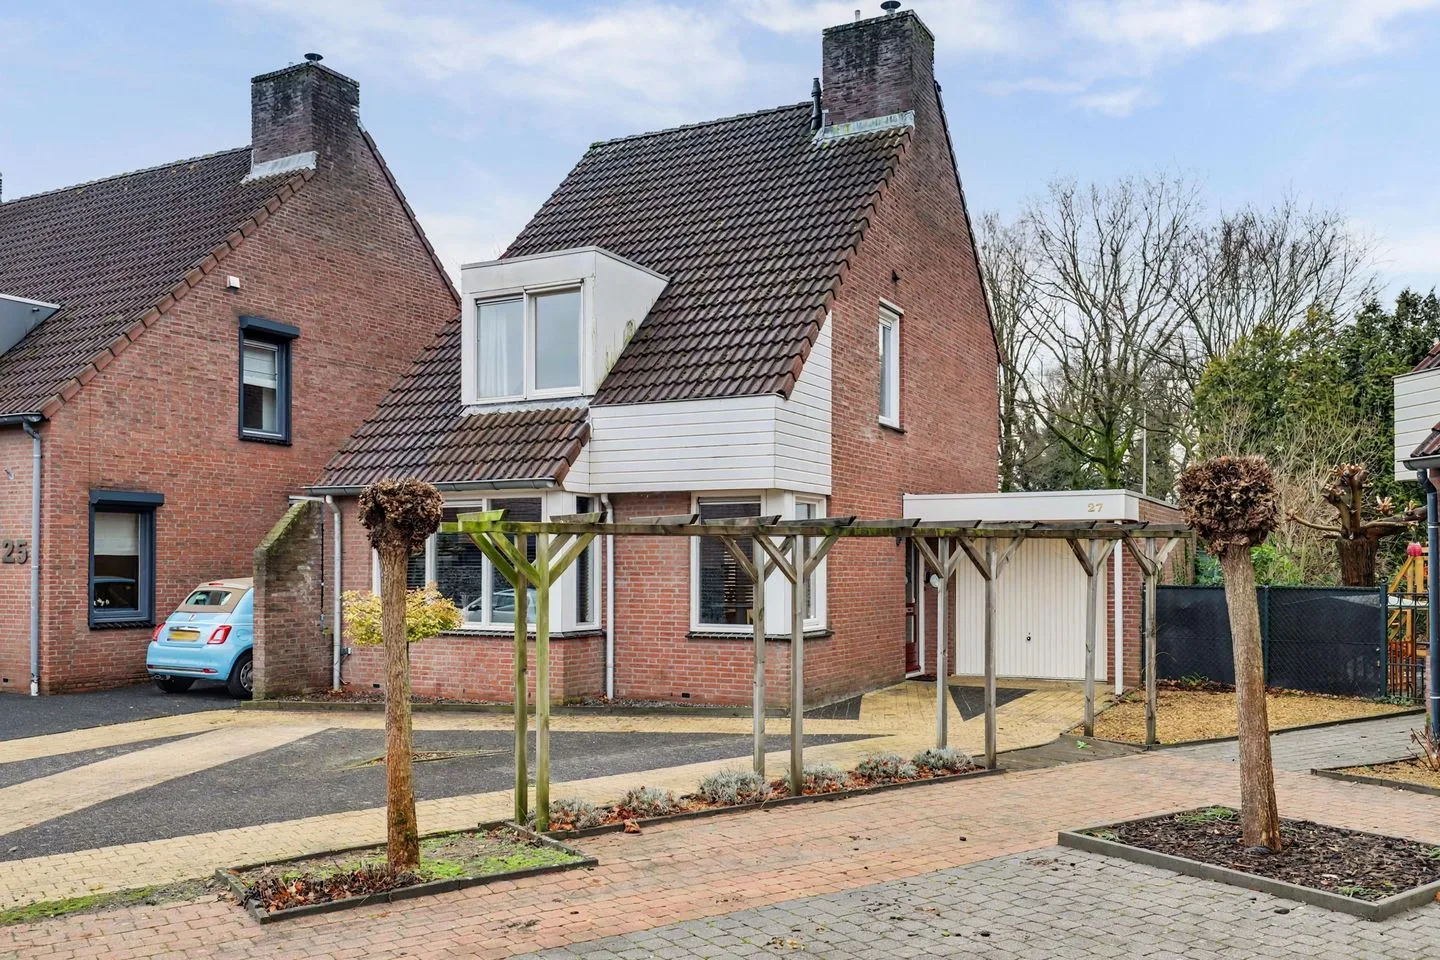
Dr. Poelsstraat 30
6436BG Amstenrade
€ 225.000 k.k.
€ 2.473/m²
ESave as favorite- Living area
- 91 m²
- Land area
- 265 m²
- Bedrooms
- 2
-

- Available
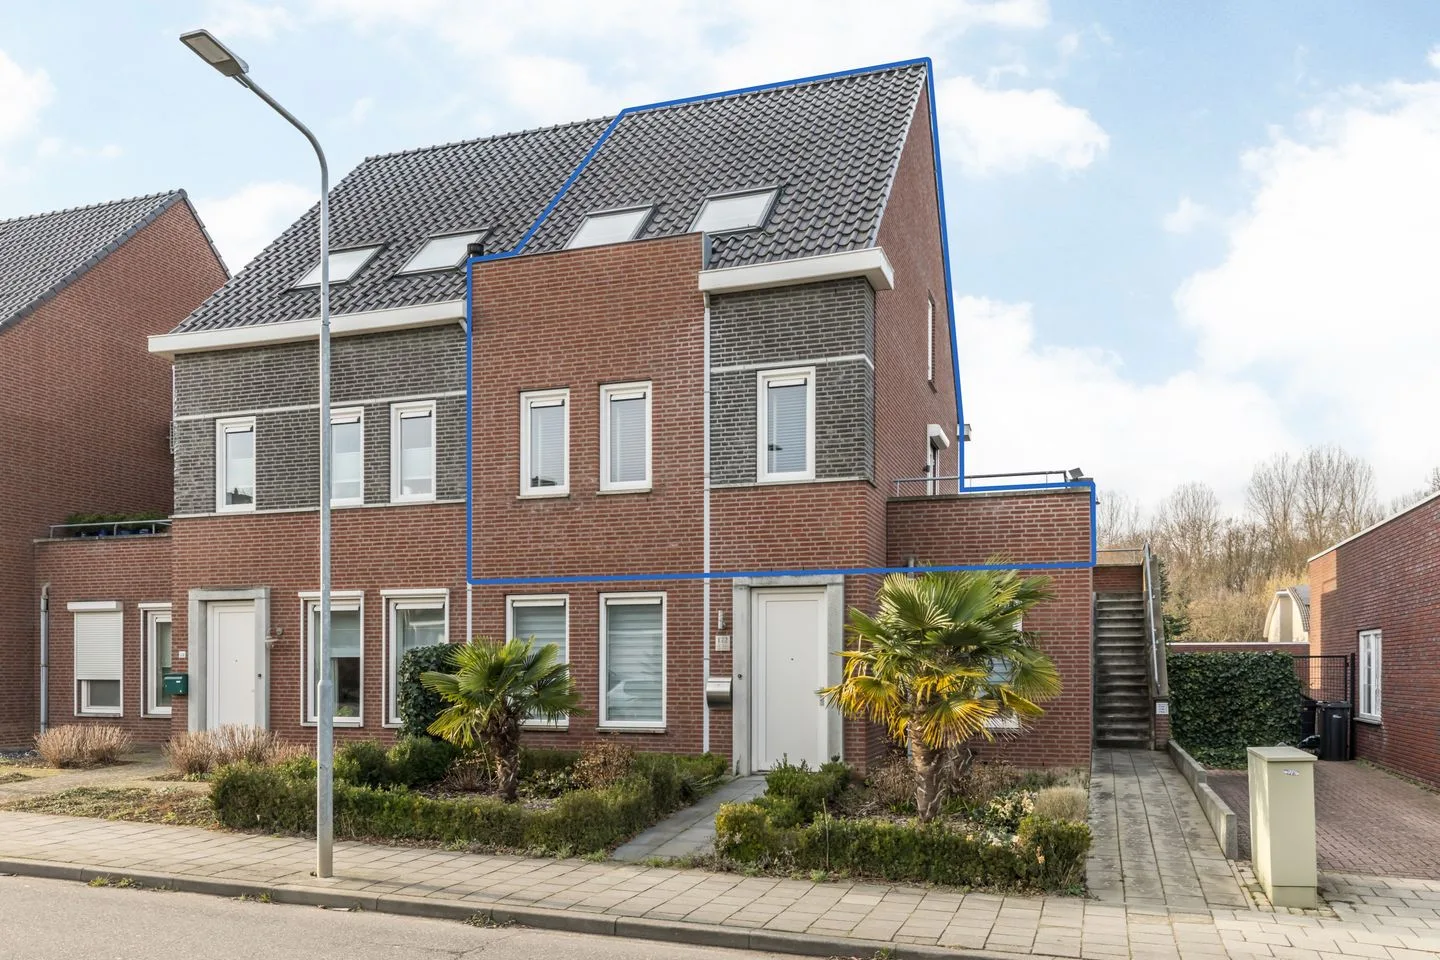
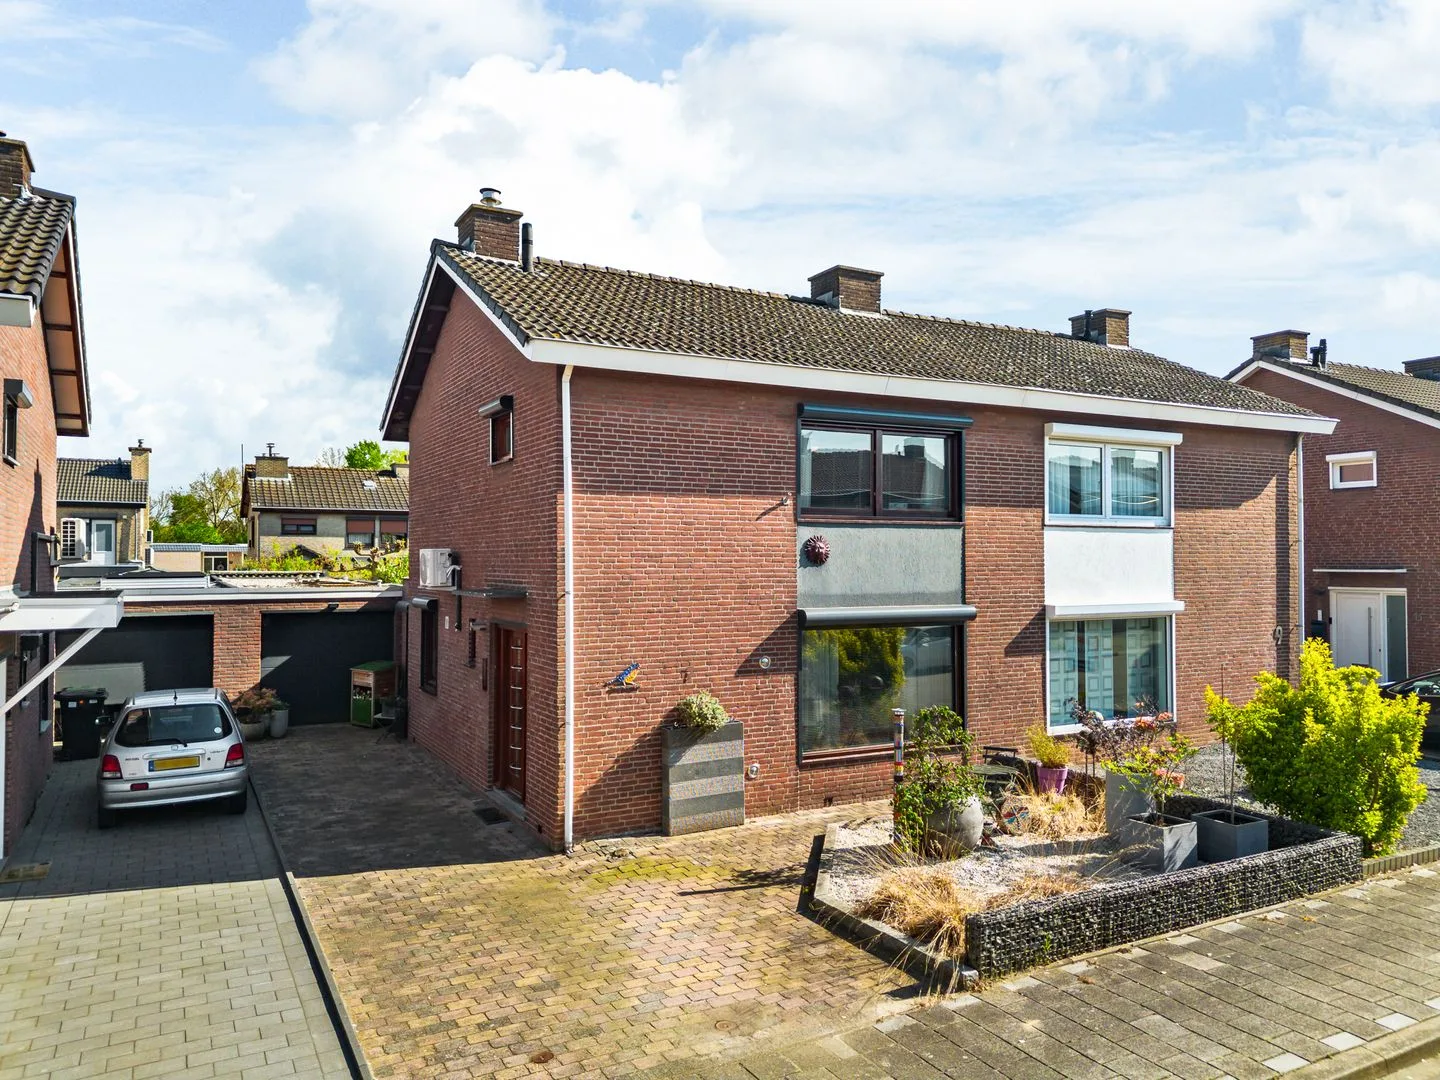
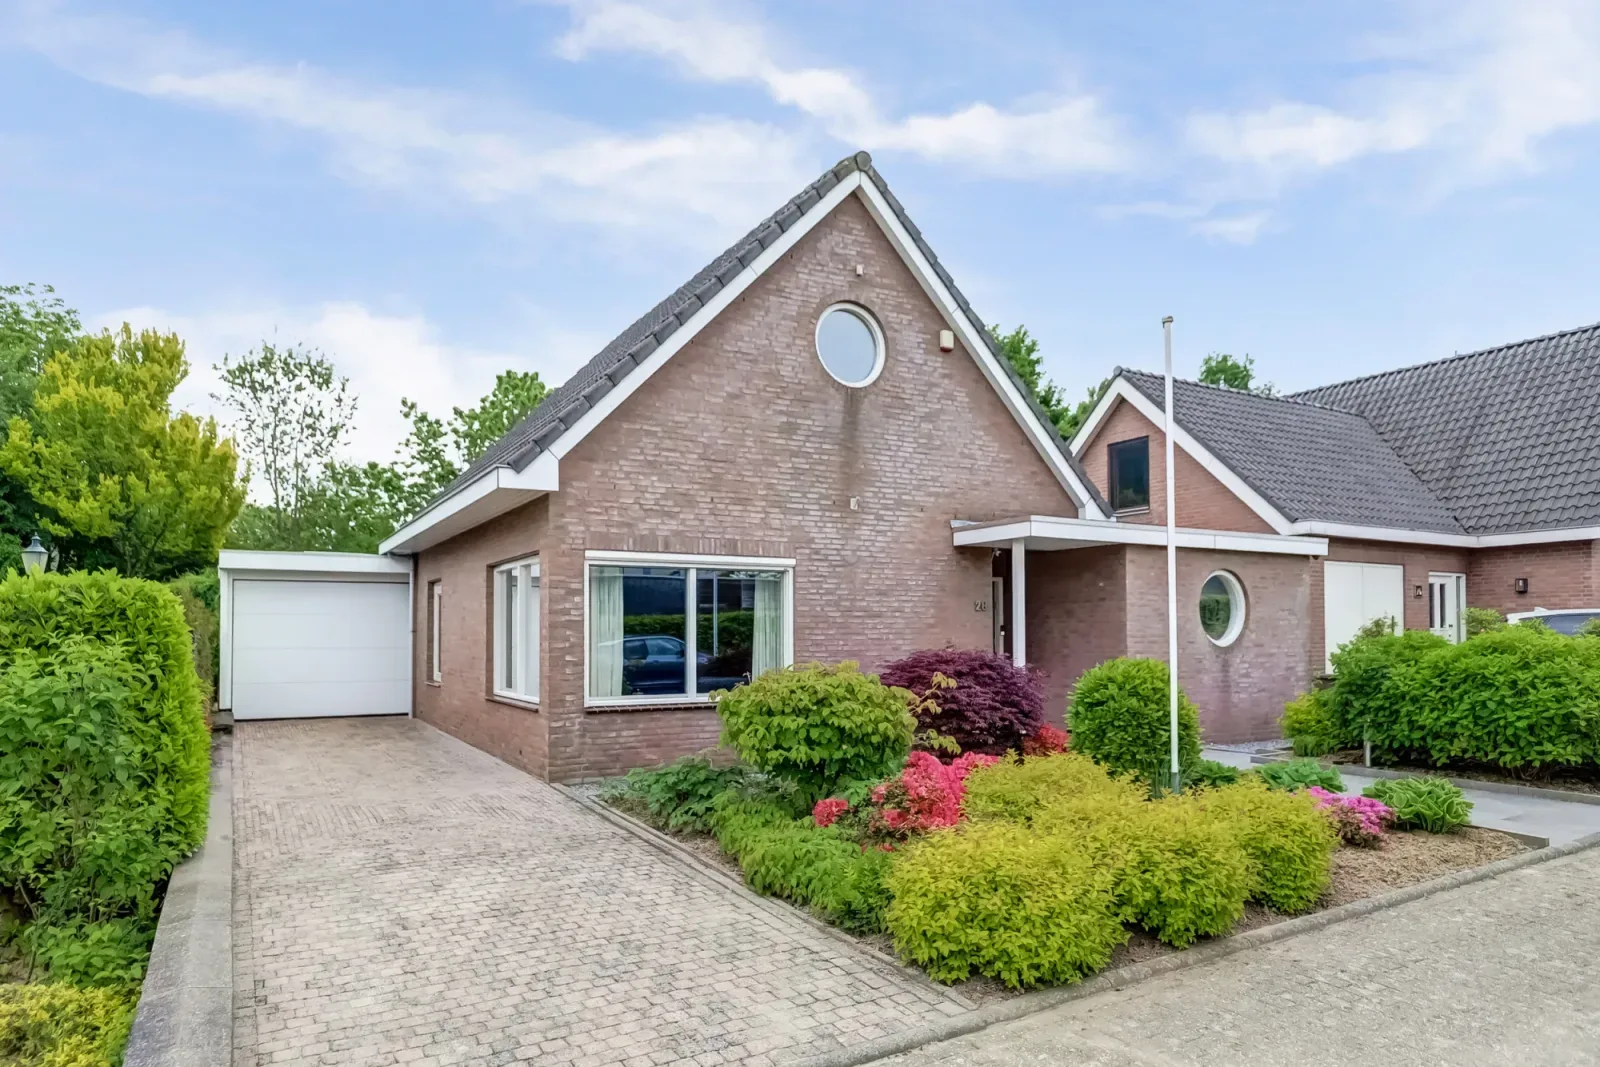
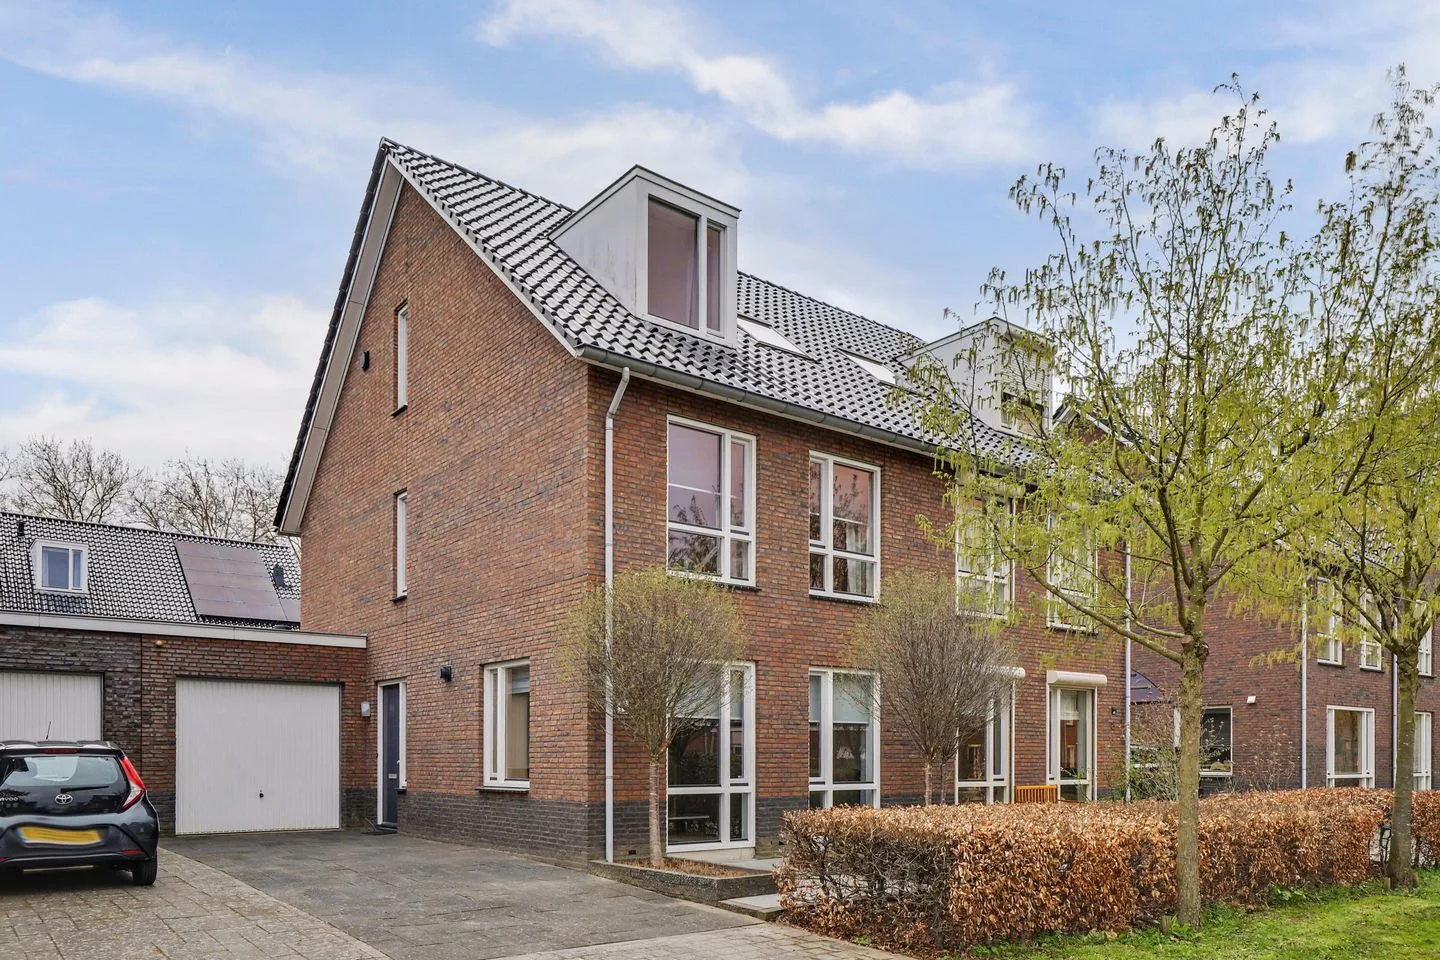
Rimburgerweg 2
6443VD Brunssum
€ 289.000 k.k.
€ 2.890/m²
ESave as favorite- Living area
- 100 m²
- Land area
- 1318 m²
- Bedrooms
- 3
-

- Available
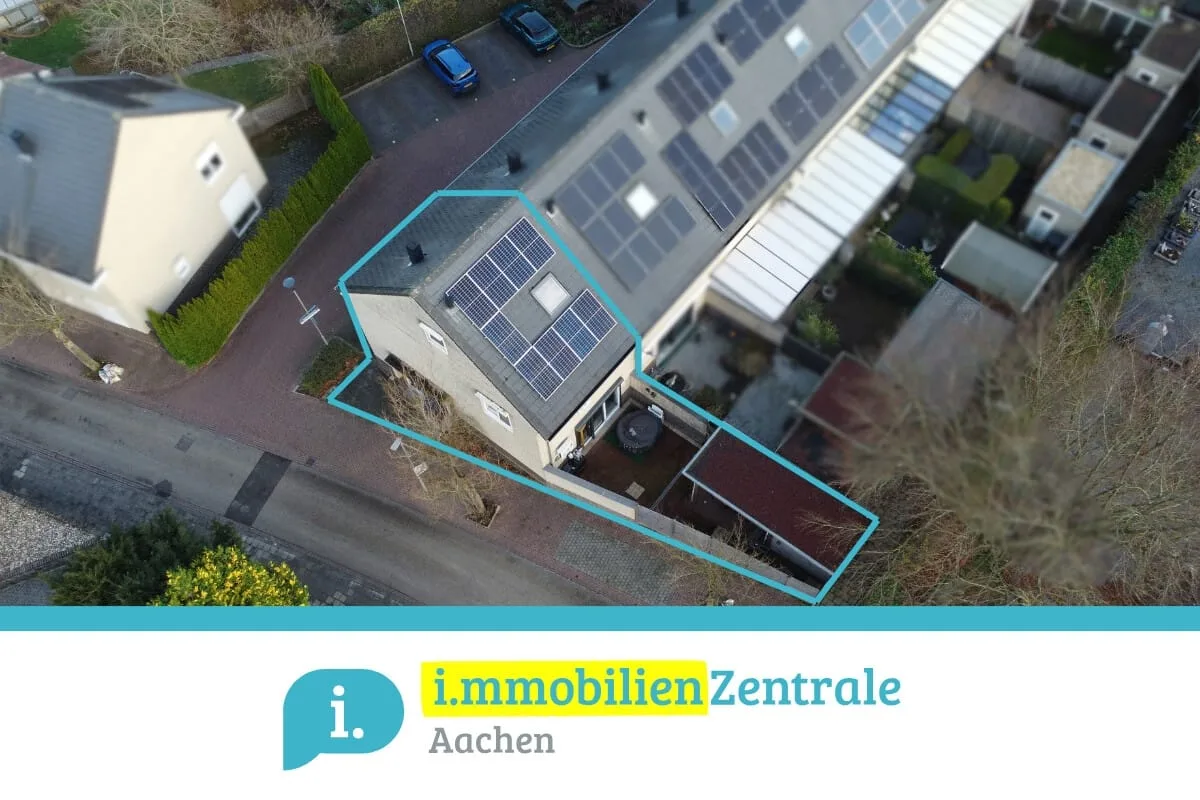
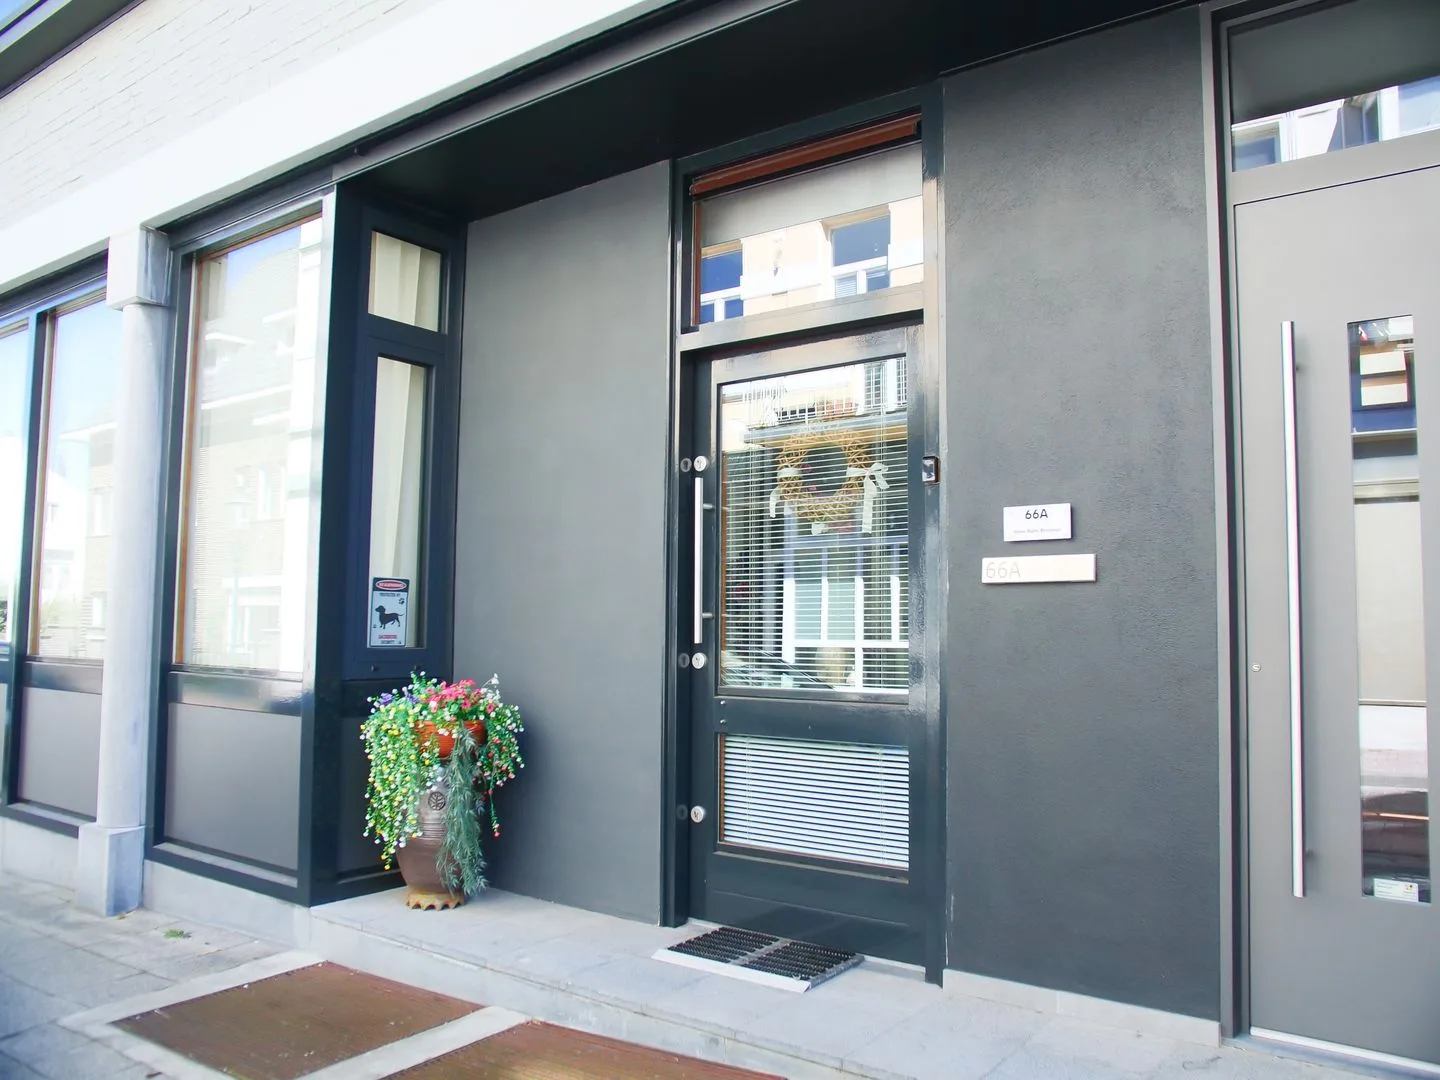
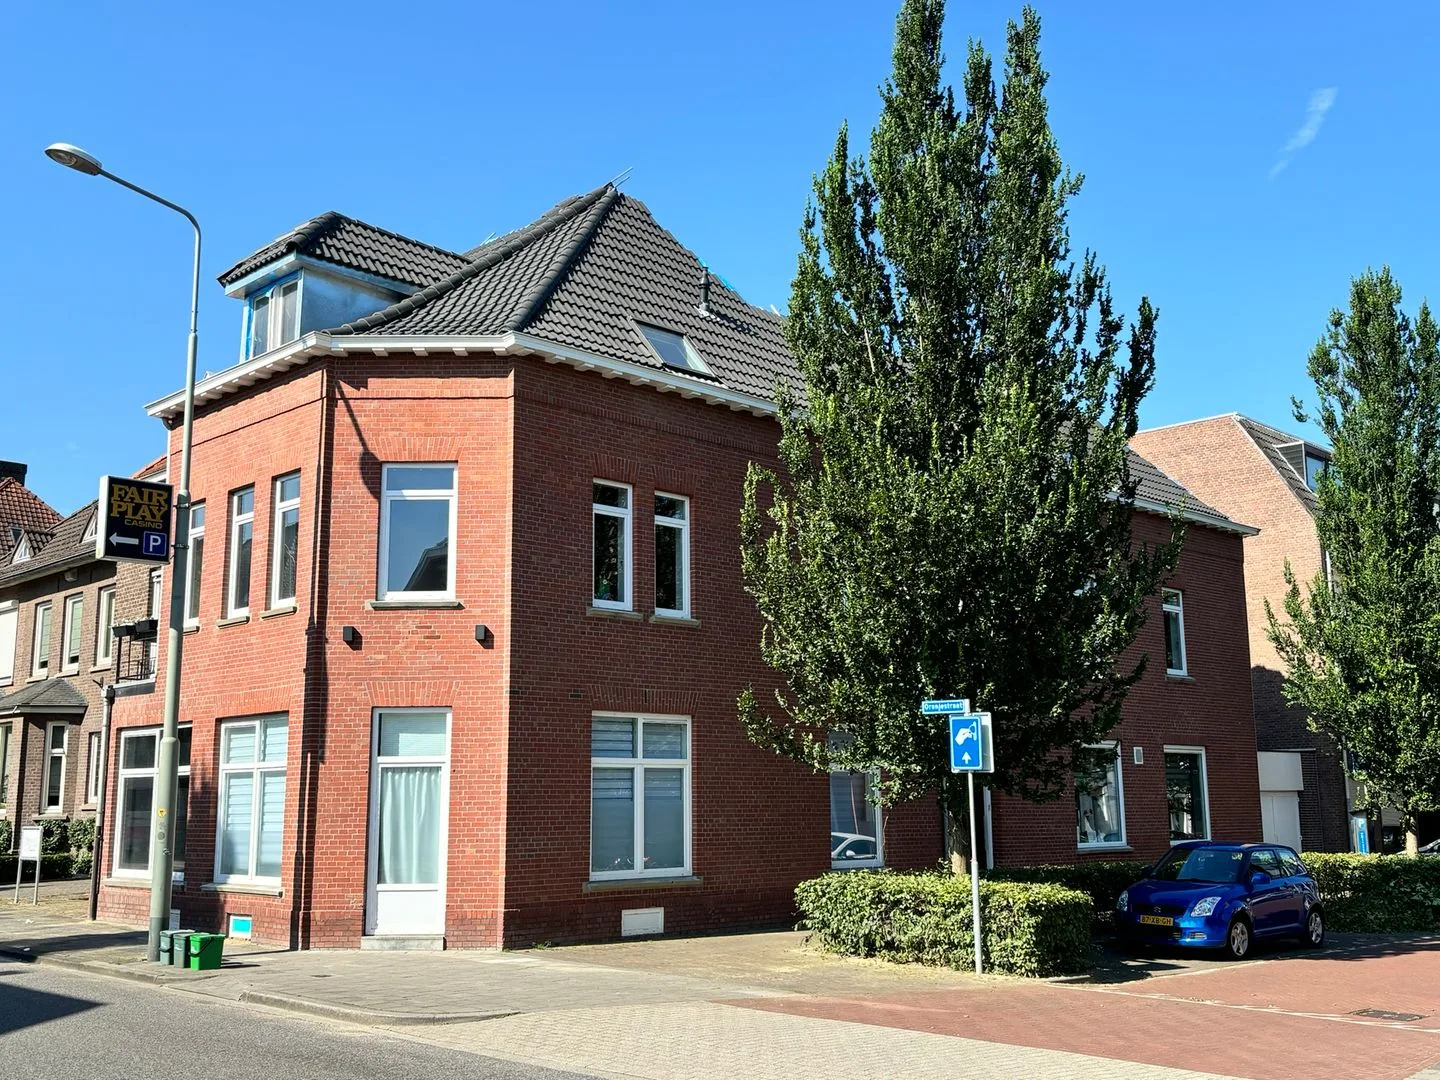
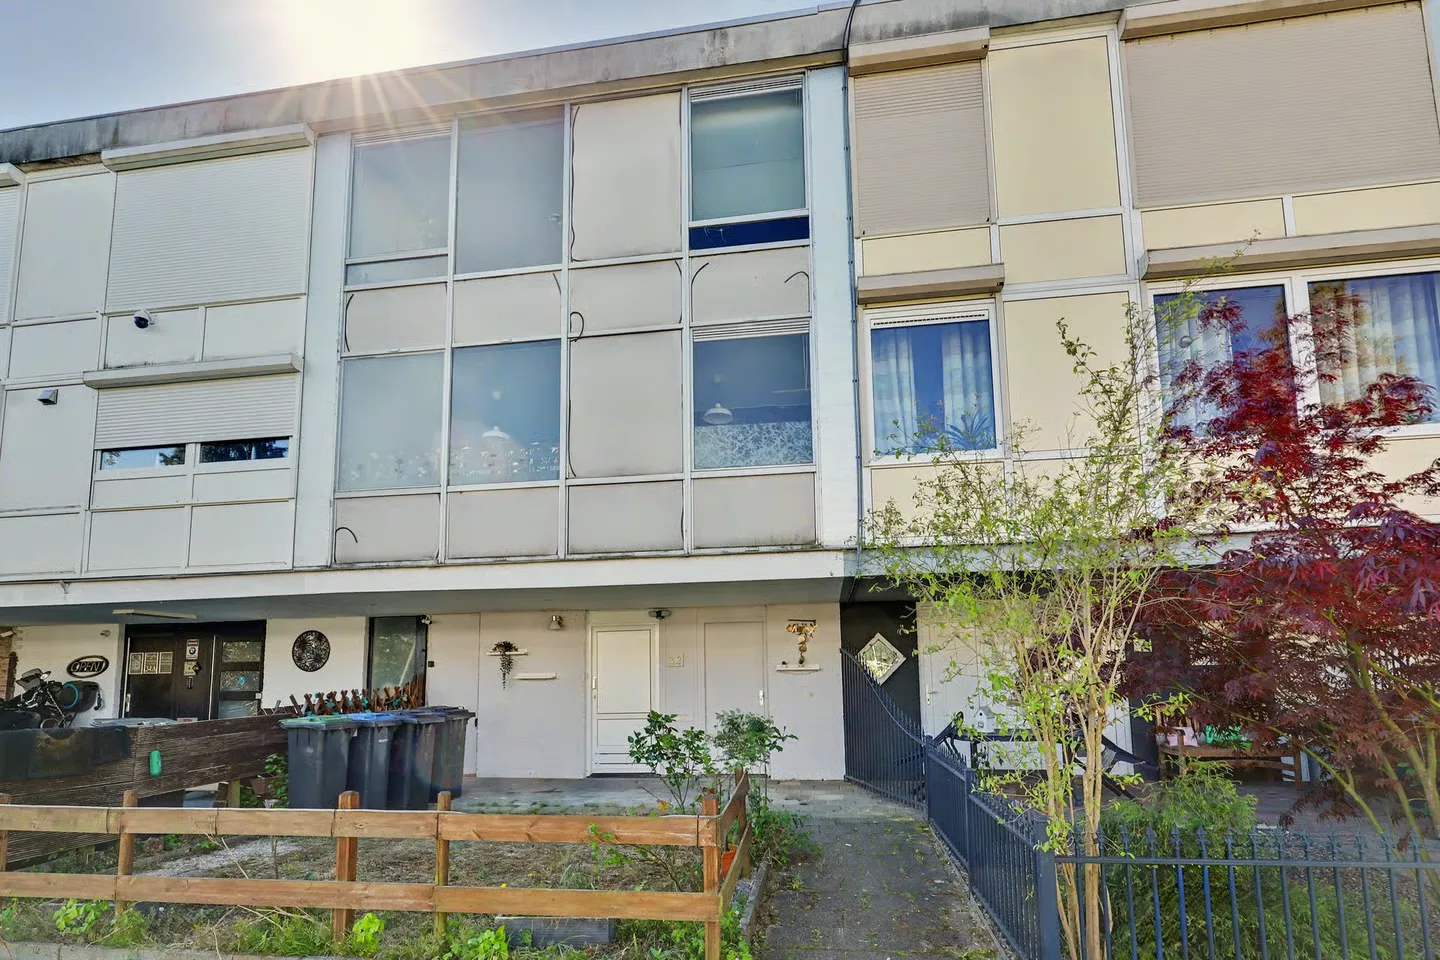
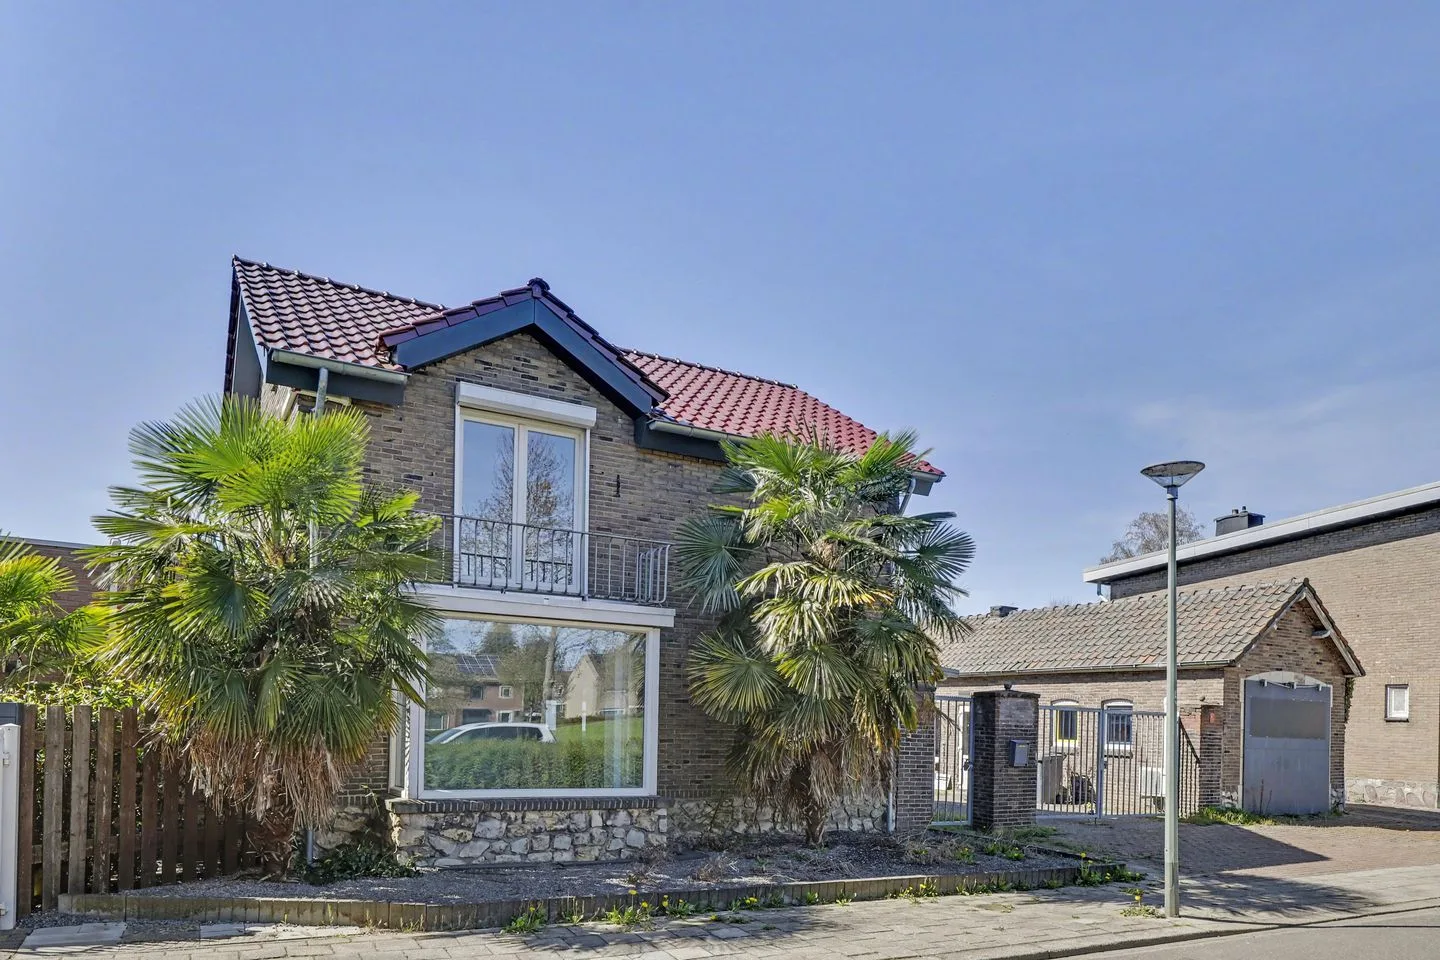
Namiddagse Driessen 21
6374MS Landgraaf
€ 260.000 k.k.
CSave as favorite- Living area
- 86 m²
- Land area
- 153 m²
- Bedrooms
- 4
-

- Available
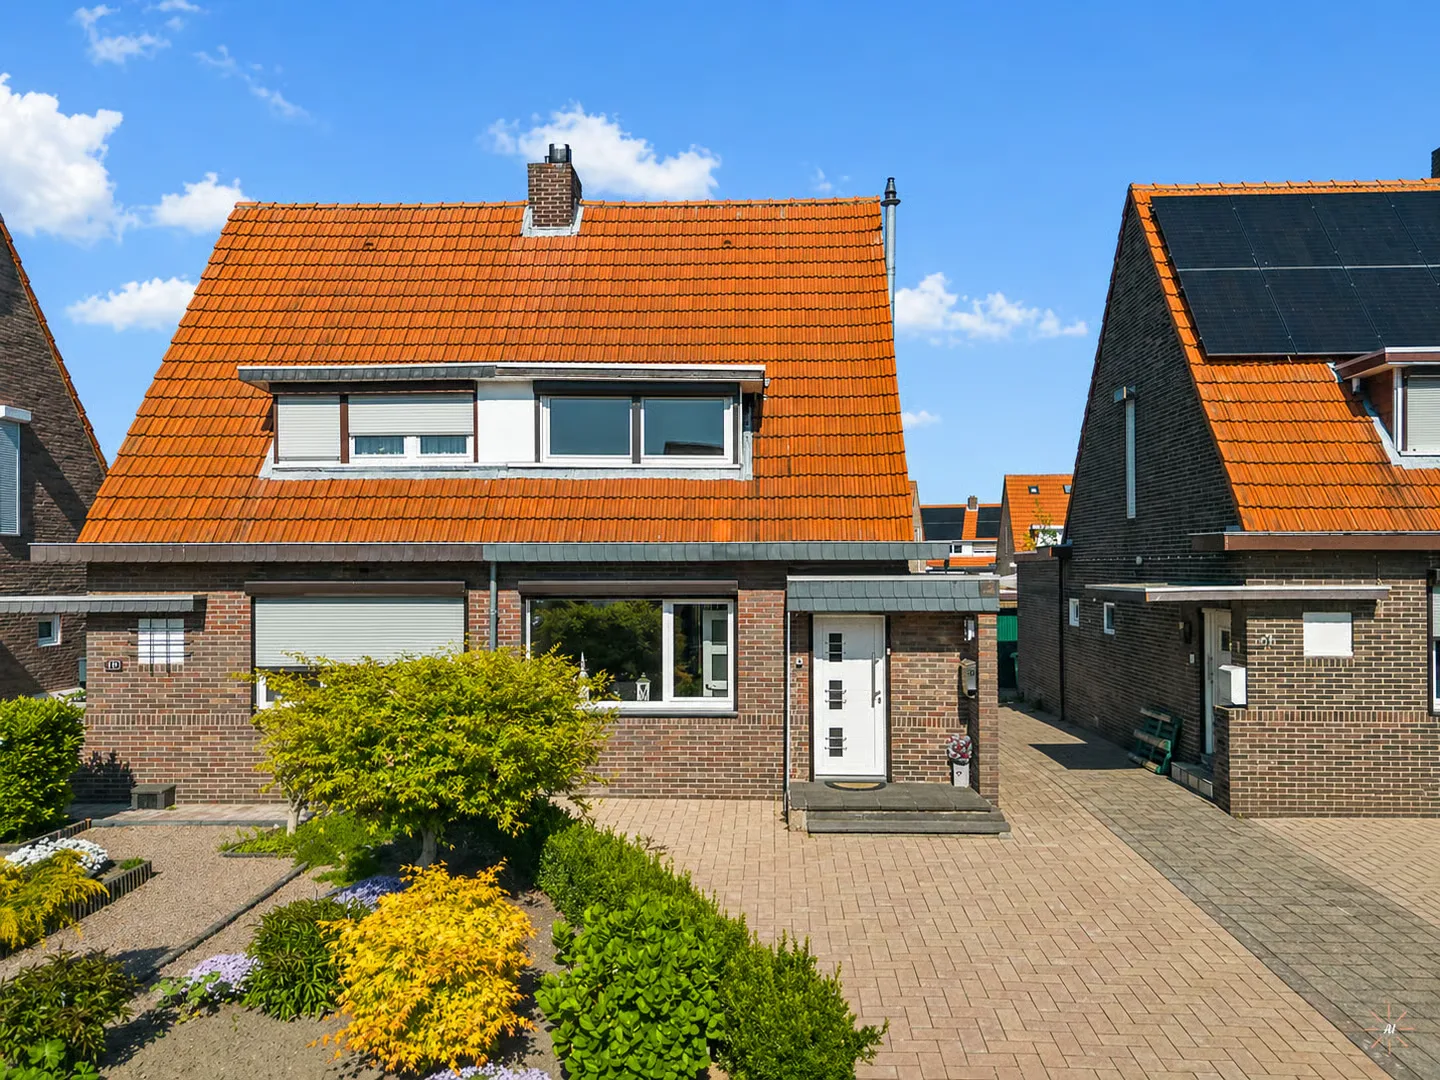
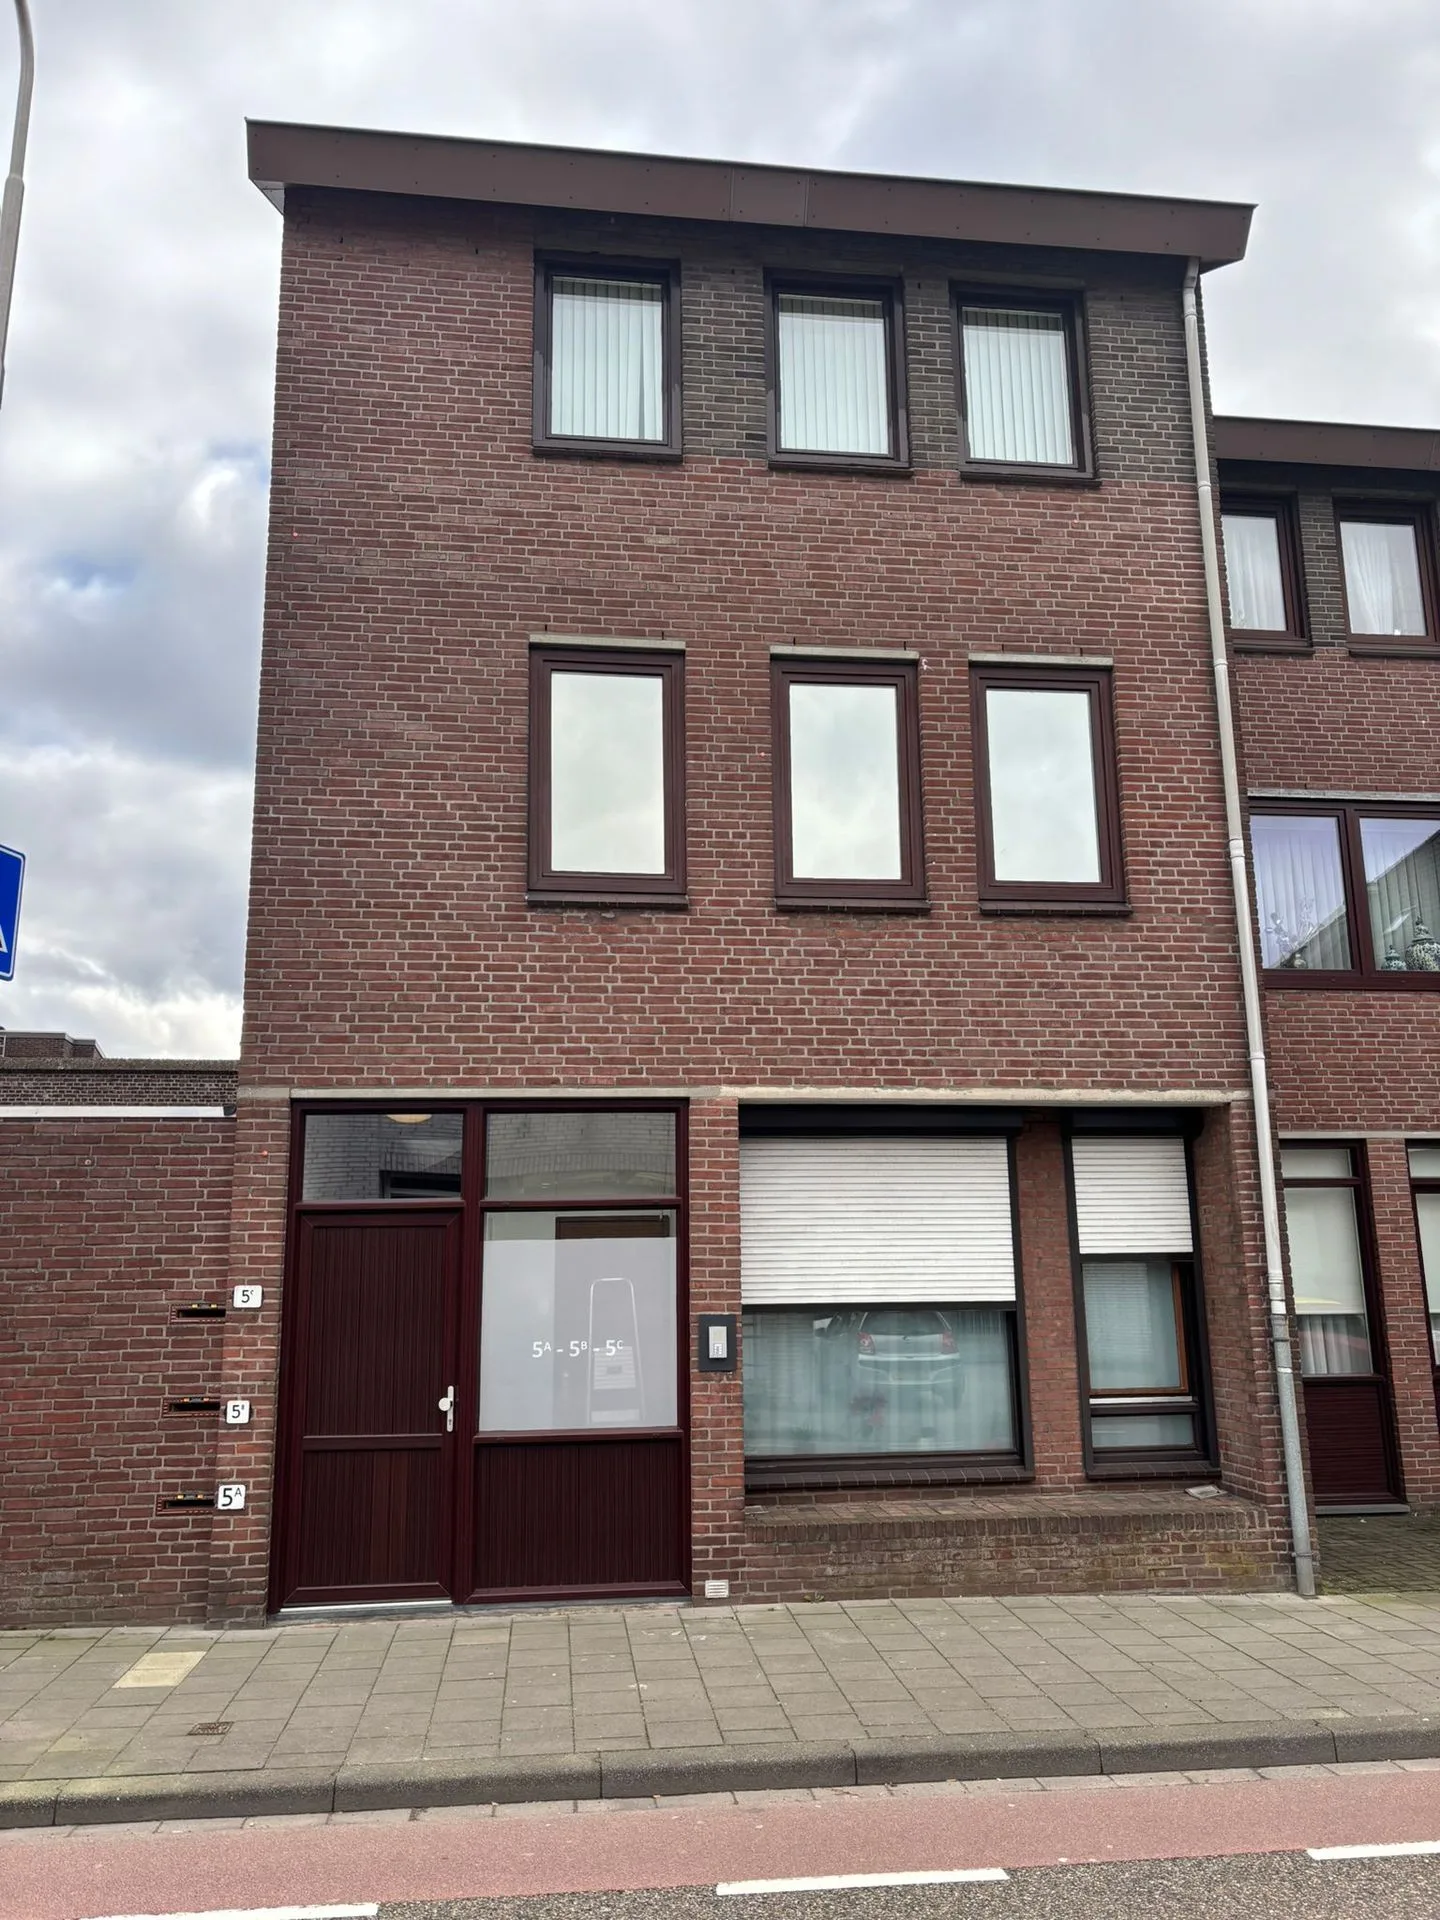
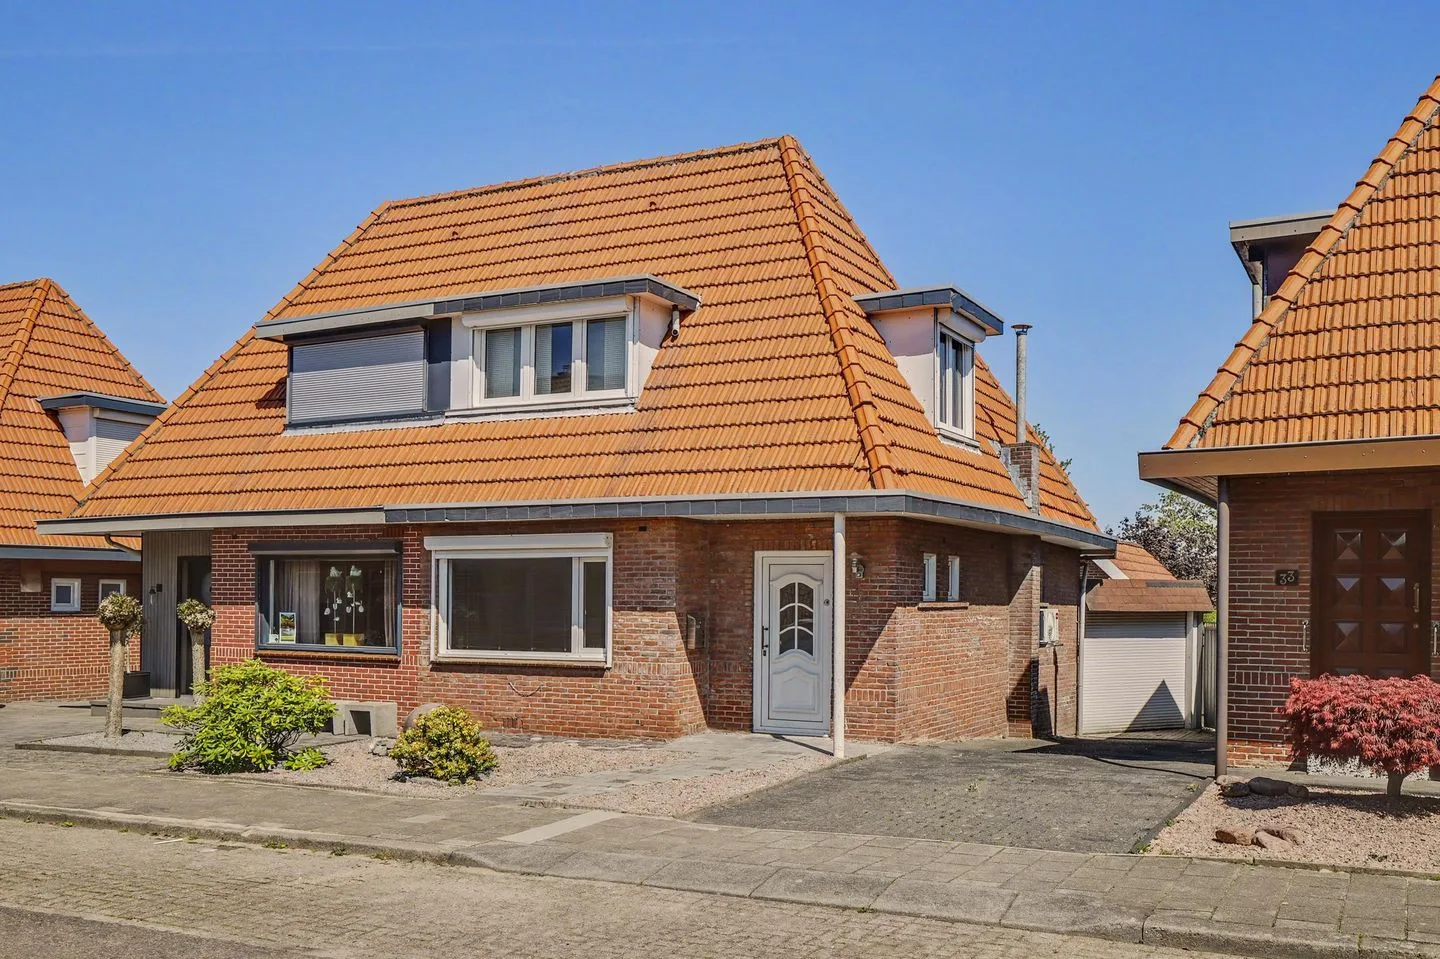
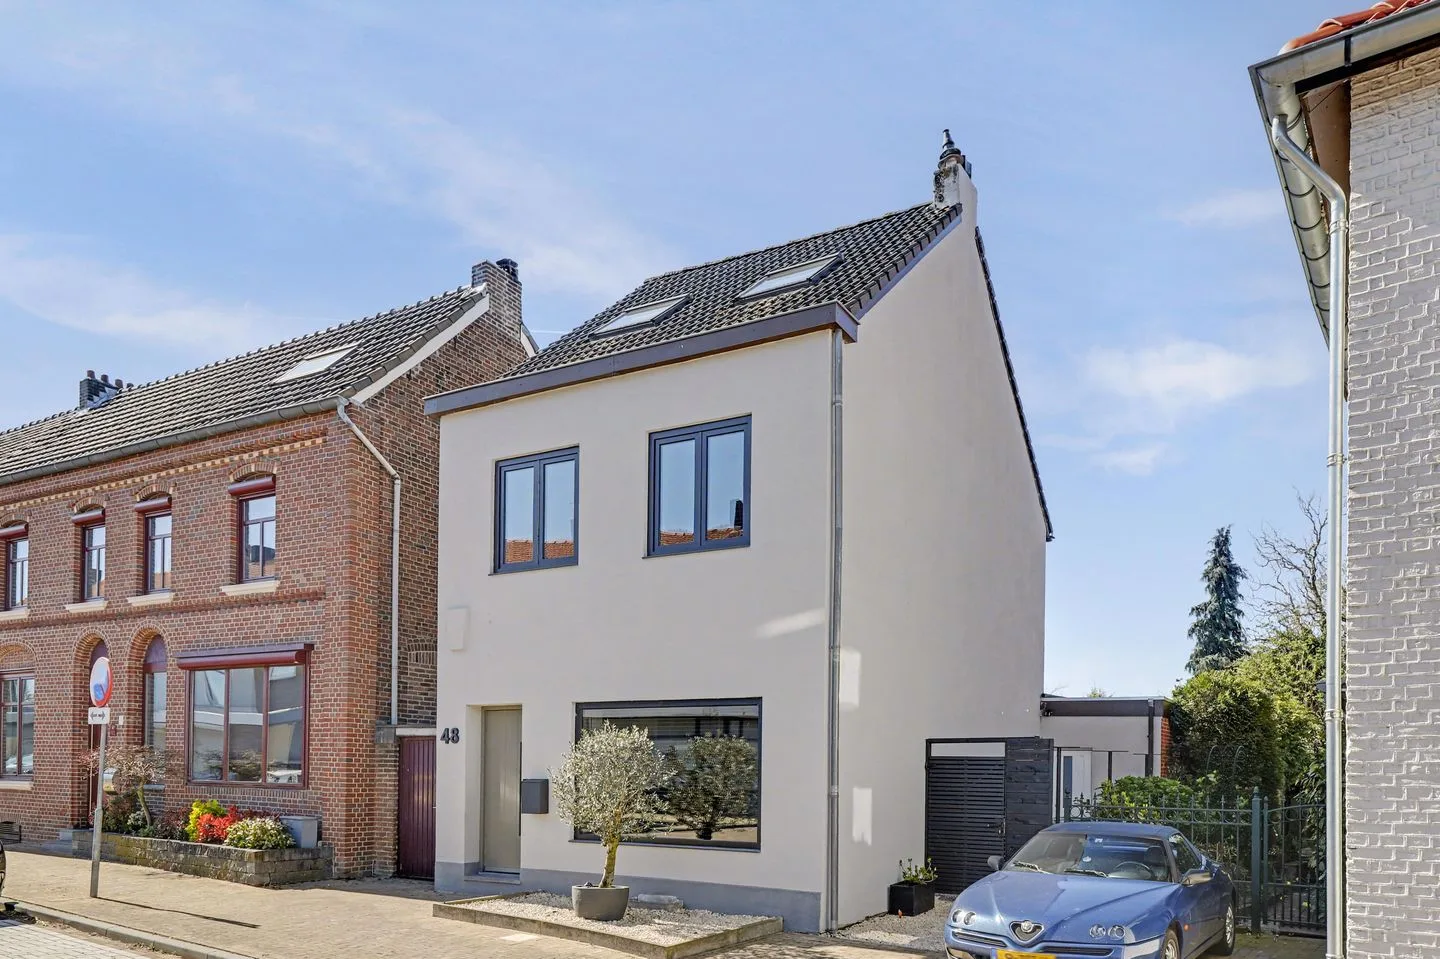
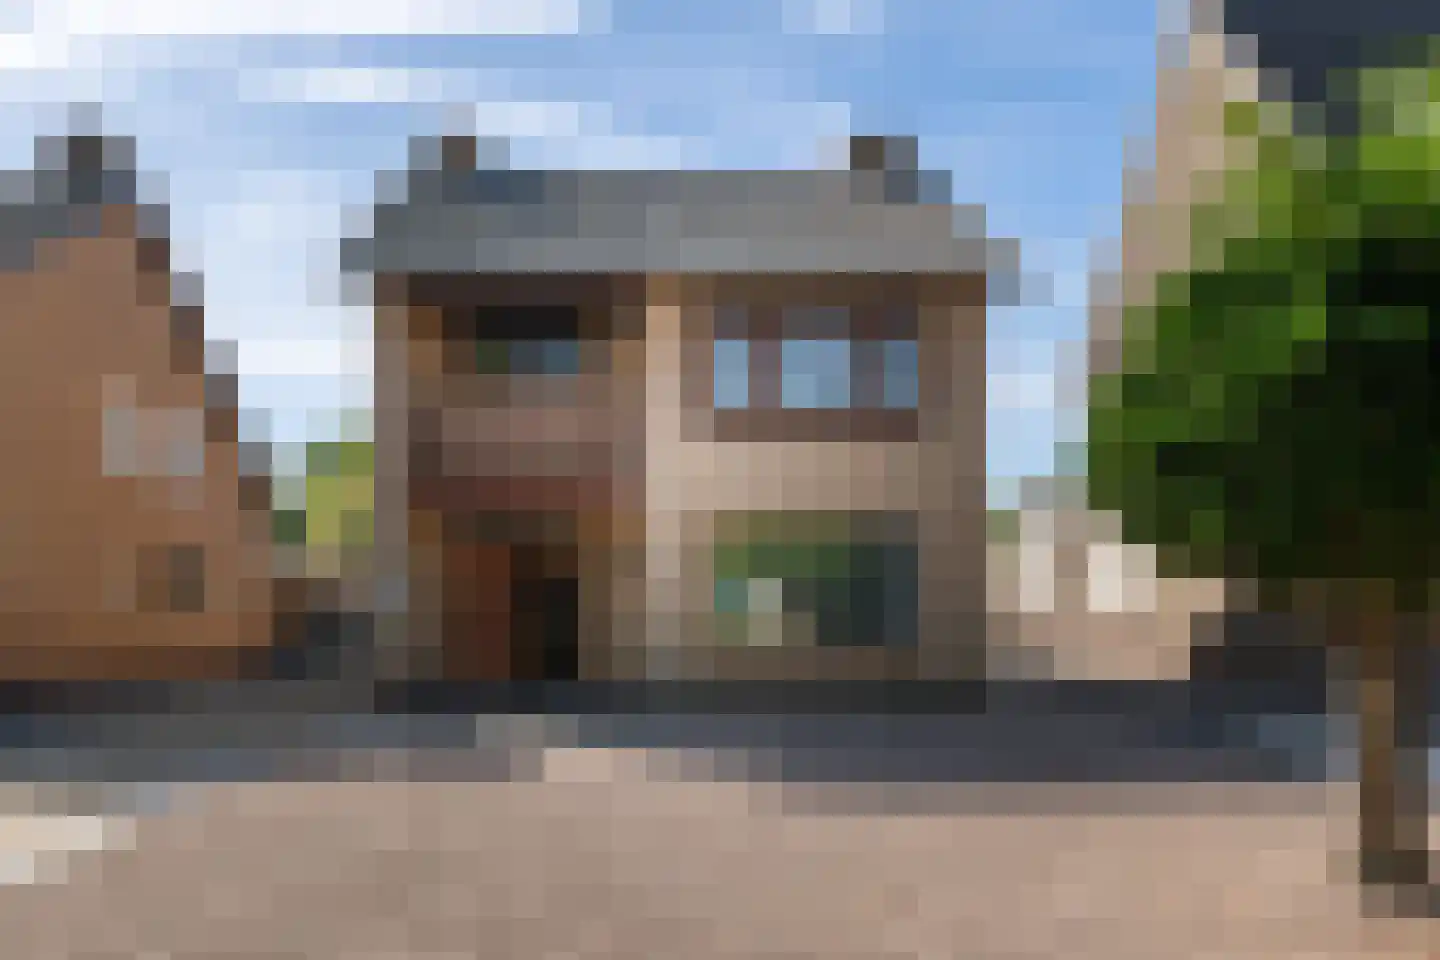
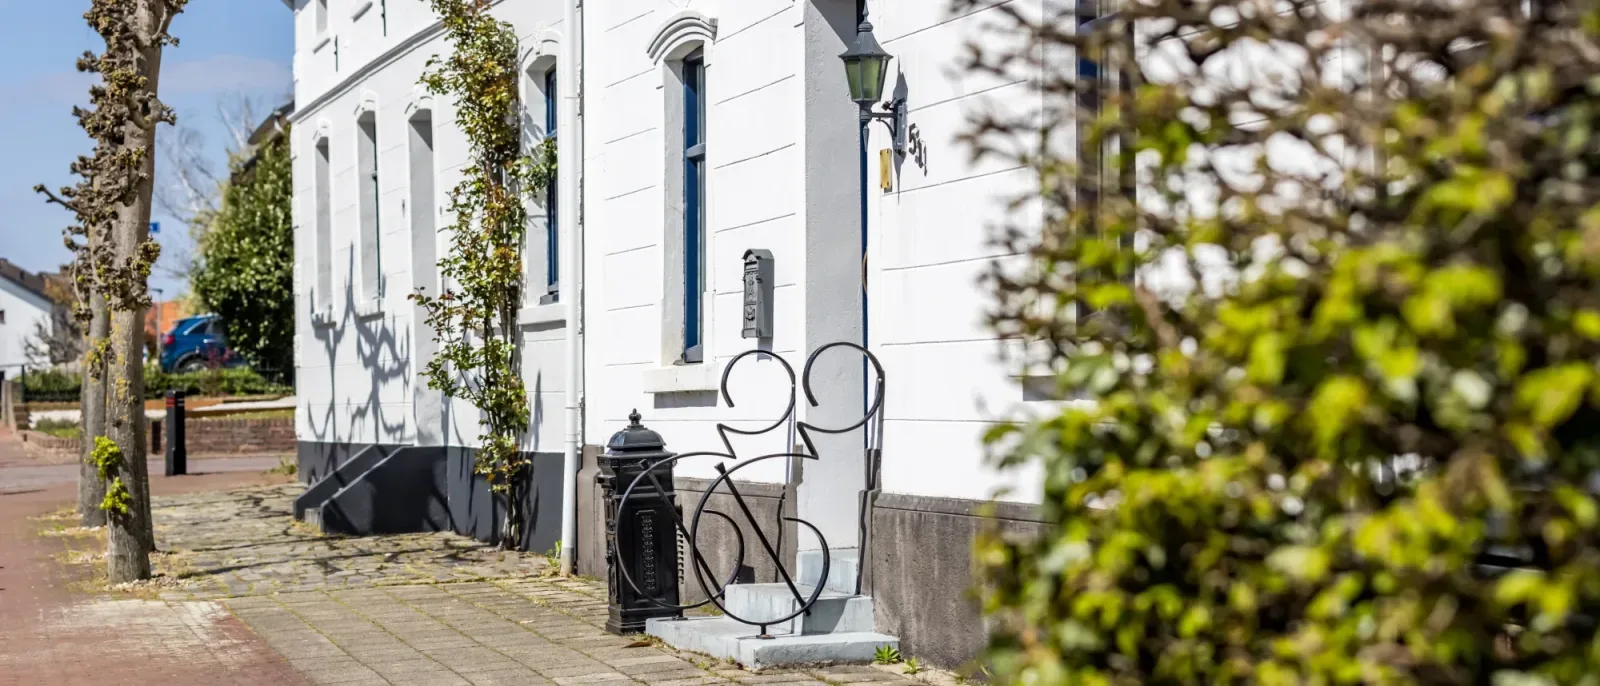
Nagelbeek 53
6365EJ Schinnen
€ 269.000 k.k.
GSave as favorite- Living area
- 103 m²
- Land area
- 450 m²
- Bedrooms
- 2
-

- Available
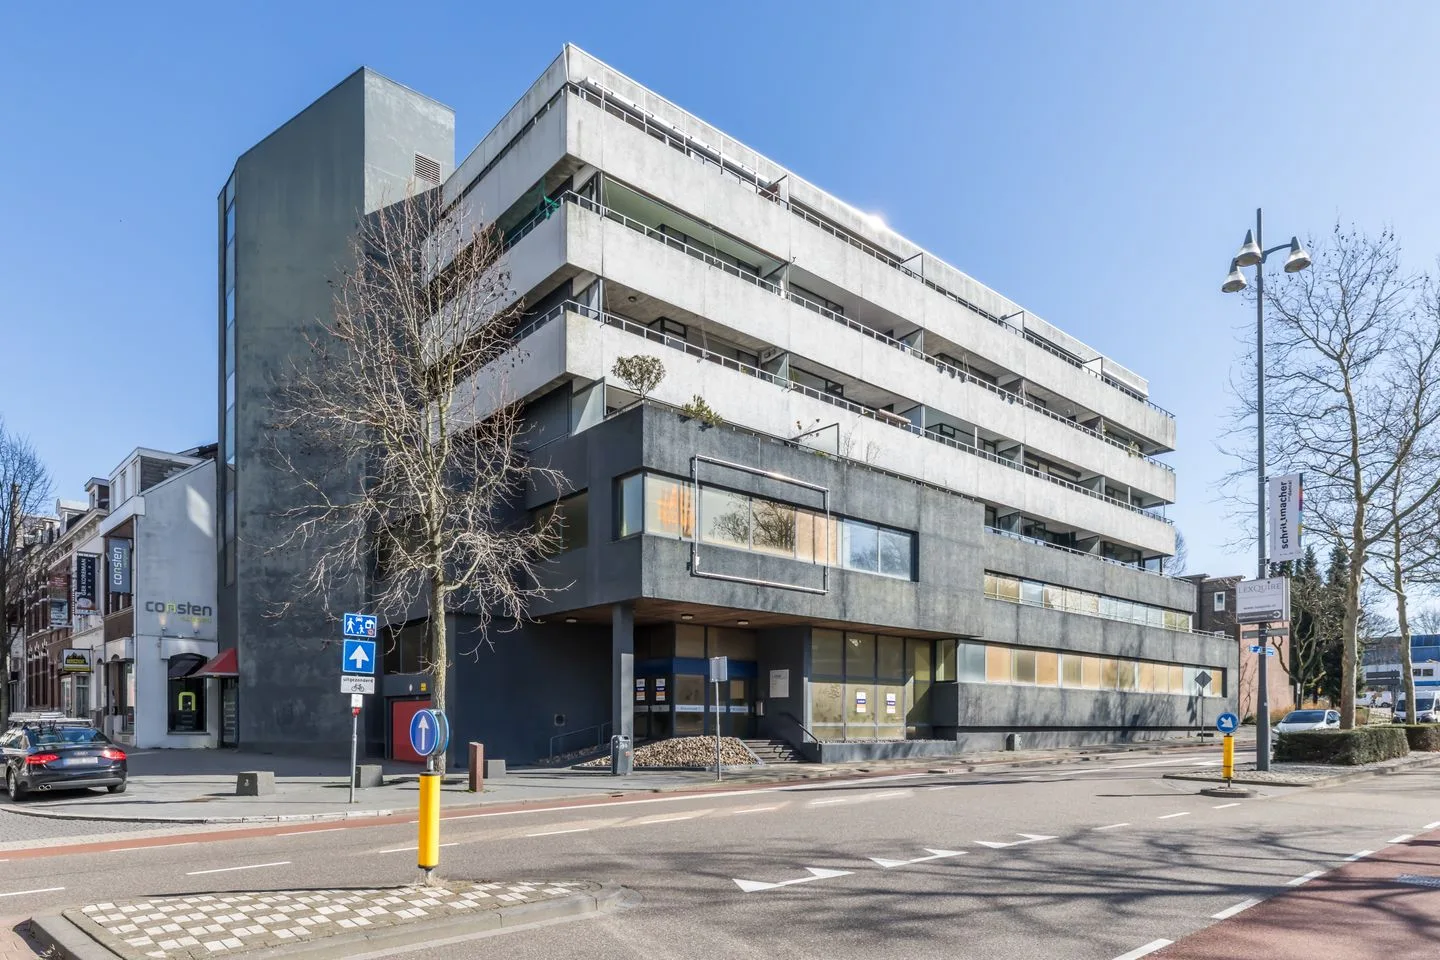
Bovenste Puth 4
6155NH Puth
€ 289.000 k.k.
DSave as favorite- Living area
- 87 m²
- Land area
- 306 m²
- Bedrooms
- 3
-

- Available
van Ruysdaelstraat 33
6445XK Brunssum
€ 349.000 k.k.
€ 2.815/m²
CSave as favorite- Living area
- 124 m²
- Land area
- 362 m²
- Bedrooms
- 4
Reviews (85)
Review platforms
BronscoresTotal score
85 total reviews

85 reviews on Google
-
Shannon Beelen
10 -
Melissa Redding
10Translated by AIWe are extremely satisfied with the cooperation with Trafas Real Estate when selling our house. From the first contact with Rik Janssen, everything went professionally, clear communication and always reachable. Due to dissatisfaction with an earlier engaged real estate agent, the switch was made to Trafas Real Estate, a clear difference was noticeable from the beginning. Thanks to the smooth and expert guidance, our house was quickly and successfully sold within 2 weeks. Trafas Real Estate is definitely a recommendation! Thank you all!
-
Michel Hayen
10Translated by AII am very satisfied with the way Ralf accompanied the process of selling my late mother's house. From the intake to the formalities with the notary, the sale of the house went smoothly without any issues. The contact was personal, informal and always pleasant. No standard real estate agent talk, but clear communication and short lines. Questions were quickly and accurately addressed, both by Ralf himself and by the office staff. Everything was carefully followed up on and that gave a lot of confidence throughout the entire process. The fact that there was already a personal connection made the cooperation extra nice: professionally where necessary, with attention and involvement where it could. A real estate agent that I can wholeheartedly recommend.
-
Amber Hansen
10Translated by AIWe sold our house through Trafas and are extremely satisfied with how everything went. From the first contact, the communication was clear, transparent and pleasant. Everything was arranged within no time, from the valuation to the sale itself. We were always well informed and knew exactly where we stood. Thanks to the quick and professional approach, our home was sold incredibly fast. A nice, reliable party who knows what they're doing!
-
Erik Theunissen
10Translated by AIWe are very satisfied with how Trafas has guided us in the sale of our house. Within a very short time, our house was on the market and everything went smoothly. Thanks to the professional photos and excellent presentation, our home really came into its own. What we especially appreciated was the transparency: all steps were clearly explained, so there were no surprises. The viewings were thoroughly conducted and when buyers had questions, they followed up with us. Thanks to the dedication and expertise of Trafas, my home was sold in no time. Absolutely a recommendation!
-
Rogier Vaessen
10Translated by AIAgain great service and honest advice from Trafas. They really think along with the customer's interests.
-
Baktash Delawar
2Translated by AIVERY disappointing and unfair experience – not trustworthy! We had contact with this real estate agency, having a viewing on Tuesday, February 4th, and making an offer of €705,000,- on Friday. The reaction was positive: we were told that the owners favored us and that we would end up somewhere between €705,000,- and €710,000,-. No problem for us! We immediately made a 2nd appointment for Saturday, February 15th to view the house again and discuss which furniture we could take over and agree on a final purchase price. With enthusiasm, we told our four children the wonderful news. Finally, a room of their own for everyone! The move to the South seemed to become a reality. In recent weeks, we have been busy with the bank, mortgage advisor, and our own real estate agent – all to ensure that this purchase would go smoothly. But then, out of nowhere, we received a phone call today, Tuesday, February 11th: someone else has made a new offer and they are preferred. Pardon?! So despite all promises and agreements, the highest bid is simply chosen? With a strange feeling, we asked if we could make the same offer again, but suddenly that was no longer sufficient. Our children were completely devastated, and all our hard work, the many appointments, and the trips of recent weeks had been for nothing. We have been doing business in the north of the country for 25 years and adhere to a clear rule: “A man a man, a word a word.” A verbal agreement is also an agreement, based on trust and mutual respect. Unfortunately, that does not apply to this real estate agency. Here, money seems to be above all else: above reputation, honesty, and customer satisfaction. This is not the way to treat people. We will not recommend anyone in our network to ever do business with this unreliable real estate agency! What a shame!
-
M Knops
10Translated by AIVery satisfied with the appraisal! Trafas Real Estate recently handled the appraisal of my home and I am extremely pleased with their service. Everything went smoothly and professionally. The appraiser took the time, was well prepared, and gave a clear explanation of the valuation. What I particularly appreciated was the thoroughness and transparency in the process. Within a short period of time, I had an extensive and well-supported report in hand, which allowed me to move forward directly. In short, a reliable company that knows what they are doing. Absolutely recommended!
-
Martin Knops
10Translated by AIAgain, Ralf Trafas Makelaardij has excellently helped us with an appraisal report. The communication was smooth, and the report was prepared quickly and professionally. Clear explanation, very pleasant collaboration and especially a fair valuation. Definitely recommended for everyone who needs a reliable appraisal! Very driven and professional real estate agency with enthusiastic and customer-friendly staff. The personal approach gives a good feeling from the beginning. Trafas makelaardij has helped us several times in buying and selling our home, highly recommendable.
-
antoine thielens
10Translated by AIGreat team, reliable, 3rd good experience
-
Koen Janssen
10Translated by AITeam Trafas has helped us excellently with the sale and purchase of our new home. Accessibility is top-notch and you are kept very informed during the sales process. Everything from A to Z is taken care of. In short, absolutely recommended!
-
Harold Manders
10Translated by AILast year we sold our house through Ralf Trafas real estate agency. The guidance and communication from both Ralf and Rik deserve a big compliment. The ladies in the back office were always very helpful too. Never unwilling to help. This year, Rik handled the purchase assistance for our new home. Once again, all praise for the team at Ralf Trafas real estate agency. Should we ever consider selling again, it will be Ralf Trafas real estate agency that gets to handle the sale. Again ladies and gentlemen. Thank you for your help and patience. We can only say CHAPEAU!
-
Glenn Kitzen
10Translated by AITrafas Real Estate has certainly made our word a reality! Rik helped us very well and quickly with the sale, but also provided good support during the purchase of a new home. Pleasant communication, takes his time and is reliable and honest. Much appreciation for this, thanks again Trafas Real Estate! Gr, Glenn & Carlyn
-
Roy Senden
10Translated by AIBoth buying and selling under one roof through the same contact person (Rik Janssen). Everything arranged to the last detail and the contact experienced as very pleasant.
-
Ed
10Translated by AIApartment sold through Real Estate Agency Trafas. This was done in a very pleasant manner. The initial consultation immediately inspired confidence. The approach yielded the best possible result. Communication is excellent. Real estate agency is highly recommended.
-
Stefan van den Hof
10Translated by AIExcellent service and guidance for both sales and purchases! We had a great experience with Ralf Trafas Makelaardij, both in the sale of our house and in the purchase of our new home. On both fronts, the team assisted us exceptionally well and demonstrated their expertise and professionalism to a large extent. From the first contact to completion, we felt fully supported. The team is expert, involved and always available for questions. They think along with you, give honest advice and ensure that everything runs smoothly. We would particularly like to thank Rik and Ralf, who both guided us excellently through these exciting and important processes. Thanks to their commitment and dedication, we sold our house with a good feeling and found our dream home. We can therefore wholeheartedly recommend Ralf Trafas Makelaardij to anyone looking for a reliable and skilled real estate agent! Kind regards, Stefan and Karlijn
-
Noa Djena
10Translated by AIRalf and his team helped us sell our house in a very personal and highly professional manner. The sale went smoothly, we experienced the communication as very pleasant, and all appointments were kept as expected. You can also contact Ralf for an appraisal of your property. He has good knowledge of the current market and a realistic assessment ability in terms of selling houses, buyers, and appraisals. Extremely satisfied with the collaboration with Ralf and his team. Thank you!
-
Caroline Geraets
10Translated by AIGood reliable realtor.
-
enina vasic
10Translated by AIRik is a top realtor. Very reliable for sales and purchases
-
gaby delang
10Translated by AIWe are very pleased with Ralf trafas real estate agency. The professional guidance was very pleasant, Ralf thinks along with you, is helpful and gives good explanations. The ladies in the office are very friendly and helpful. definitely recommended!