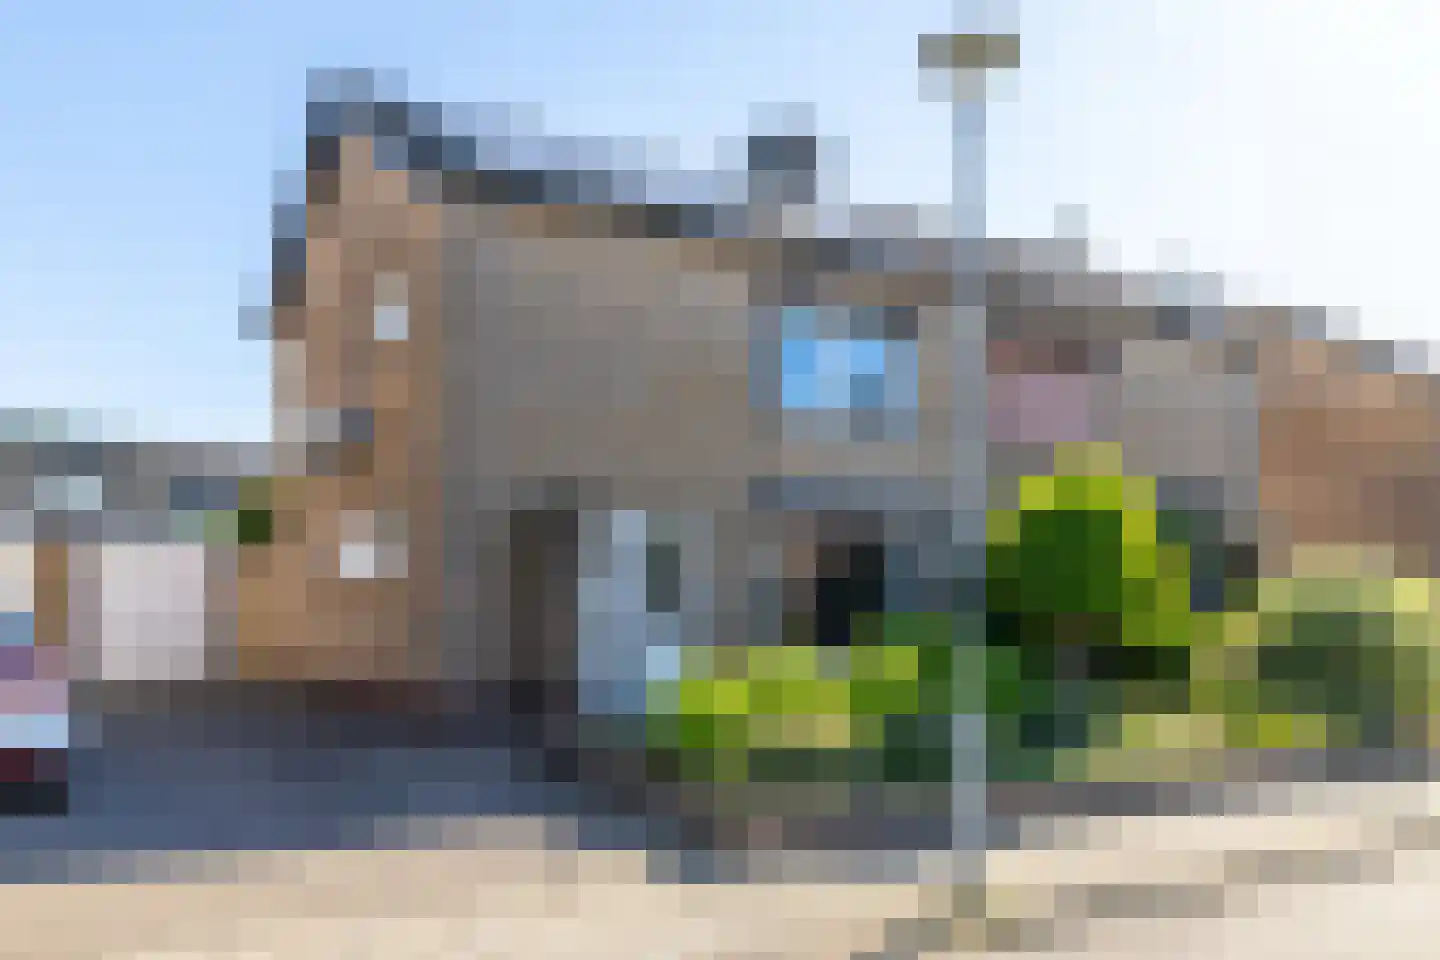
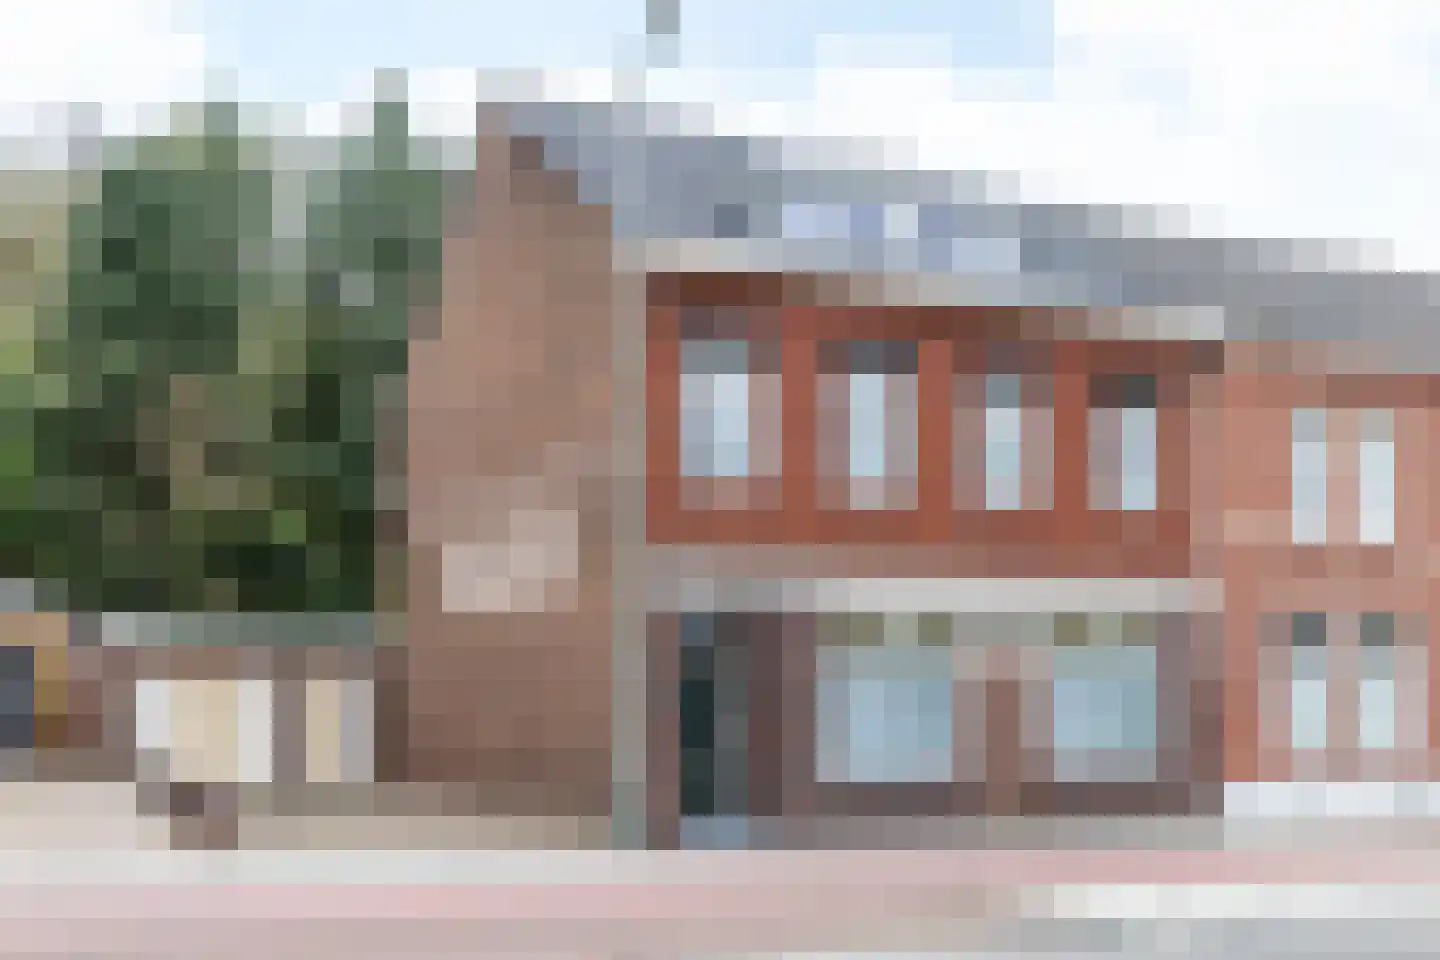
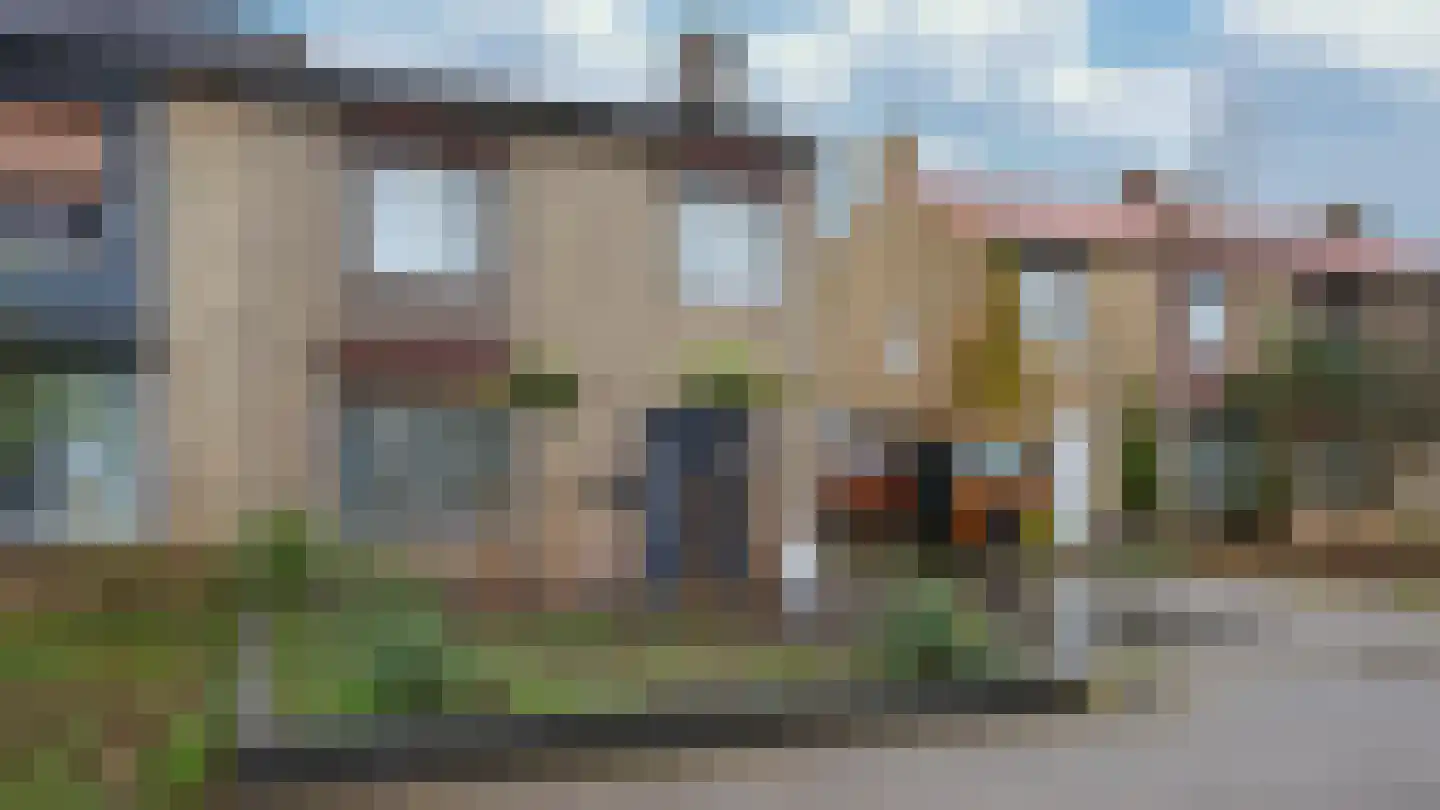
- Available
Dorpstraat 1
6438JS Oirsbeek
€ 395.000 k.k.
€ 2.705/m²
- Living area
- 146 m²
- Land area
- 550 m²
- Bedrooms
- 4
Searching in 39 houses in Oirsbeek
Type to search. Use arrow down and arrow up to navigate through results and press Enter to open.
Hidden search suggestions.
View current properties in Oirsbeek or search targeted on street, postal code and property characteristics.
View the current housing stock in Oirsbeek and quickly filter by price, living area, rooms and more. There are currently 39 houses in this place within our selection. View also 26 sold houses in Oirsbeek for extra insight into the local housing market.
6438JS Oirsbeek
€ 395.000 k.k.
€ 2.705/m²
6438JK Oirsbeek
€ 325.000 k.k.
€ 3.155/m²
6438GS Oirsbeek
€ 260.000 k.k.
€ 2.796/m²
6438KX Oirsbeek
€ 439.000 k.k.
€ 4.262/m²
6438BA Oirsbeek
€ 325.000 k.k.
€ 2.928/m²
6438BJ Oirsbeek
€ 365.000 k.k.
€ 2.310/m²
6438HC Oirsbeek
€ 239.000 k.k.
€ 2.255/m²
6438JK Oirsbeek
€ 289.000 k.k.
€ 2.752/m²
6438AG Oirsbeek
€ 349.000 k.k.
€ 3.202/m²
6438BH Oirsbeek
€ 545.000 k.k.
€ 3.385/m²
6438GC Oirsbeek
€ 619.000 k.k.
€ 5.383/m²
6438GK Oirsbeek
€ 319.000 k.k.
€ 3.625/m²
6438KP Oirsbeek
€ 389.000 k.k.
€ 2.683/m²
6438KX Oirsbeek
€ 425.000 k.k.
€ 3.036/m²
6438HM Oirsbeek
€ 349.000 k.k.
€ 2.814/m²
6438KM Oirsbeek
€ 325.000 k.k.
€ 3.693/m²
6438HP Oirsbeek
€ 550.000 k.k.
€ 3.459/m²
6438JG Oirsbeek
€ 369.000 k.k.
€ 2.527/m²
6438JD Oirsbeek
€ 319.000 k.k.
€ 3.067/m²
6438LC Oirsbeek
€ 369.000 k.k.
€ 3.100/m²
6438HS Oirsbeek
€ 349.000 k.k.
€ 2.604/m²
6438JK Oirsbeek
€ 325.000 k.k.
€ 2.876/m²
6438KN Oirsbeek
€ 539.000 k.k.
€ 3.152/m²
6438AG Oirsbeek
€ 549.000 k.k.
€ 2.495/m²
6438JH Oirsbeek
€ 425.000 k.k.
€ 3.148/m²
6438AB Oirsbeek
€ 549.000 k.k.
€ 4.392/m²
6438KA Oirsbeek
Price upon request
6438KP Oirsbeek
€ 319.000 k.k.
€ 2.572/m²
Get free quotes from real estate agents with local market knowledge. Compare more than 96 real estate agents in Oirsbeek.
Selling a home in Oirsbeek? Compare all real estate agents in Oirsbeek or view the top 10 real estate agents in Oirsbeek for extra context for your choice.
Real estate agents make sharper offers when they know you're comparing — ask for quotes for sale or purchase.
Practical answers about housing supply, sales and comparing real estate agents in Oirsbeek.
The costs of a real estate agent in Oirsbeek depend on commission, setup costs, property presentation and the chosen service. Compare the 96 real estate agents in Oirsbeek via the real estate agent page and request multiple quotes to compare rates and approach well.
Within our selection, we are currently showing 39 houses in Oirsbeek. View also the sold houses in Oirsbeek to compare the current offering with recent transactions.
Take into account not only price and living area but also maintenance, energy label, location, outdoor space and sales status. This way you compare houses in Oirsbeek on more than just the asking price.
A local real estate agent knows the neighborhoods, recent transactions and demand in Oirsbeek. By comparing 96 real estate agents in the region you get a better insight into prices, sales strategy and expected yield; the top 10 in Oirsbeek provides a useful starting point.
Yes, when making a sales plan, a valuation in Oirsbeek is wise. You gain insight into a realistic asking price and can then compare offers from real estate agents specifically.
View current location data on residents, WOZ development, housing stock, energy consumption, business activity and safety in Oirsbeek. In 2026 were there 3.569 residents. The average WOZ value in 2025 is EUR 335.000.
These figures help to better assess and compare the housing stock in Oirsbeek with recent sold homes. Orient yourself then on suitable top real estate agents in Oirsbeek for sales advice in this region.
Residents
3.569
Last year: 2026
Average WOZ
EUR 335.000
Last year: 2025
Average income per person.
EUR 35.900
Source: AllNumbers
Crimes (current year)
101
Total registered
| Year | Residents |
|---|---|
| 2021 | 3.580 |
| 2022 | 3.595 |
| 2023 | 3.565 |
| 2024 | 3.590 |
| 2025 | 3.530 |
| 2026 | 3.569 |
| Year | Average WOZ |
|---|---|
| 2021 | EUR 245.000 |
| 2022 | EUR 264.000 |
| 2023 | EUR 305.000 |
| 2024 | EUR 308.000 |
| 2025 | EUR 335.000 |
Hoger
1.070
Praktisch
470
Middelbaar
980
Europa
345
Nederland
2.980
Buiten Europa
200
Label C
464
Label D
352
Label B
267
Label A
210
Label F
199
Label G
123
Label E
91
Label A+
13
Label A+++
4
Label A++
3
Label A++++
0
Label A+++++
0
| Year | Gas (m3) | Electricity (kWh) |
|---|---|---|
| 2020 | 1.450 | 3.120 |
| 2021 | 1.650 | 3.190 |
| 2022 | 1.290 | 3.010 |
| 2023 | 1.060 | 2.910 |
| 2024 | 1.030 | 2.960 |
Hoekwoning
Gas: 1.000 • Electricity: 2.790
Huurwoning
Gas: 810 • Electricity: 2.130
Koopwoning
Gas: 1.130 • Electricity: 3.110
Appartement
Gas: 780 • Electricity: 2.100
Tussenwoning
Gas: 960 • Electricity: 2.680
Vrijstaande woning
Gas: 1.340 • Electricity: 3.650
Twee-onder-één-kap woning
Gas: 1.090 • Electricity: 2.950
Total number of company establishments: 355
| Period | Crimes |
|---|---|
| jan 2026 | 10 |
| jul 2025 | 7 |
| jun 2025 | 4 |
| mei 2025 | 5 |
| mrt 2025 | 8 |
| mrt 2026 | 7 |
| nov 2024 | 5 |
| nov 2025 | 4 |
| okt 2024 | 10 |
| okt 2025 | 15 |
| sep 2024 | 6 |
| sep 2025 | 8 |
These figures give an indicative picture of safety trends in the living environment of Oirsbeek.
Short answers based on current local statistics, handy for a quick comparison of the living environment.
Oirsbeek telt in 2026 ongeveer 3.569 inwoners.
De gemiddelde WOZ-waarde in Oirsbeek is in 2025 circa € 335.000.
Het gemiddelde inkomen per inwoner in Oirsbeek ligt rond € 35.900 per jaar.
Voor het huidige jaar gaat het om ongeveer 101 geregistreerde misdrijven. Gebruik deze cijfers als indicatie en vergelijk trends per periode.
In Oirsbeek komt vooral "Tussenwoningen" veel voor, met ongeveer 465 woningen.