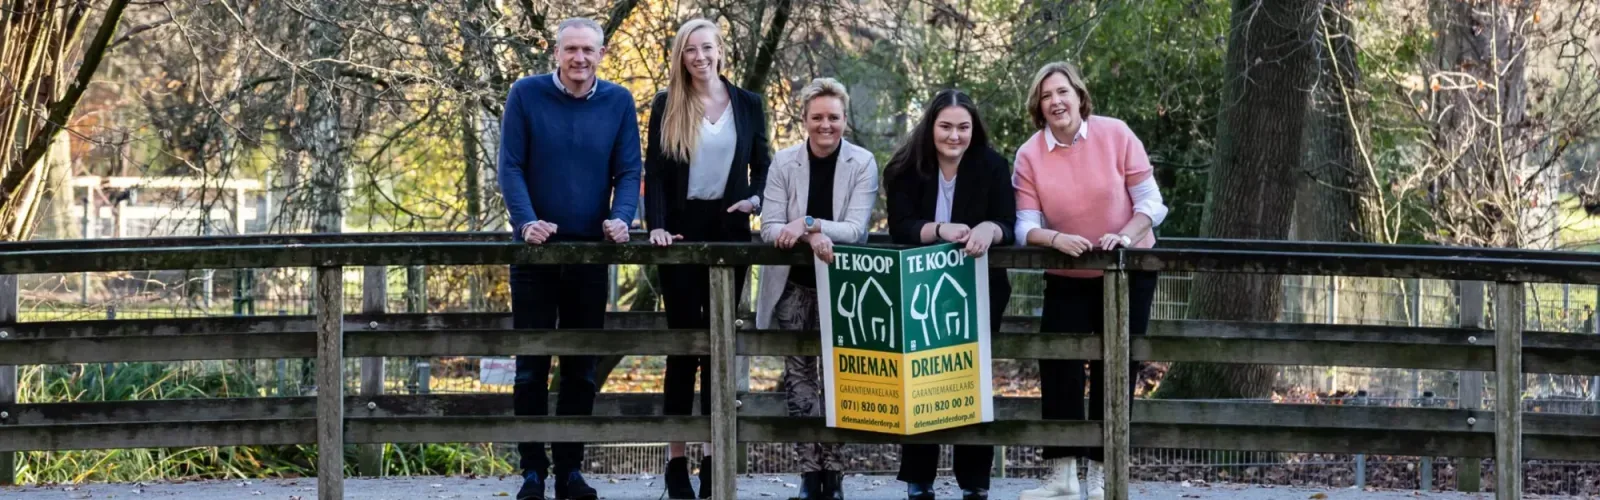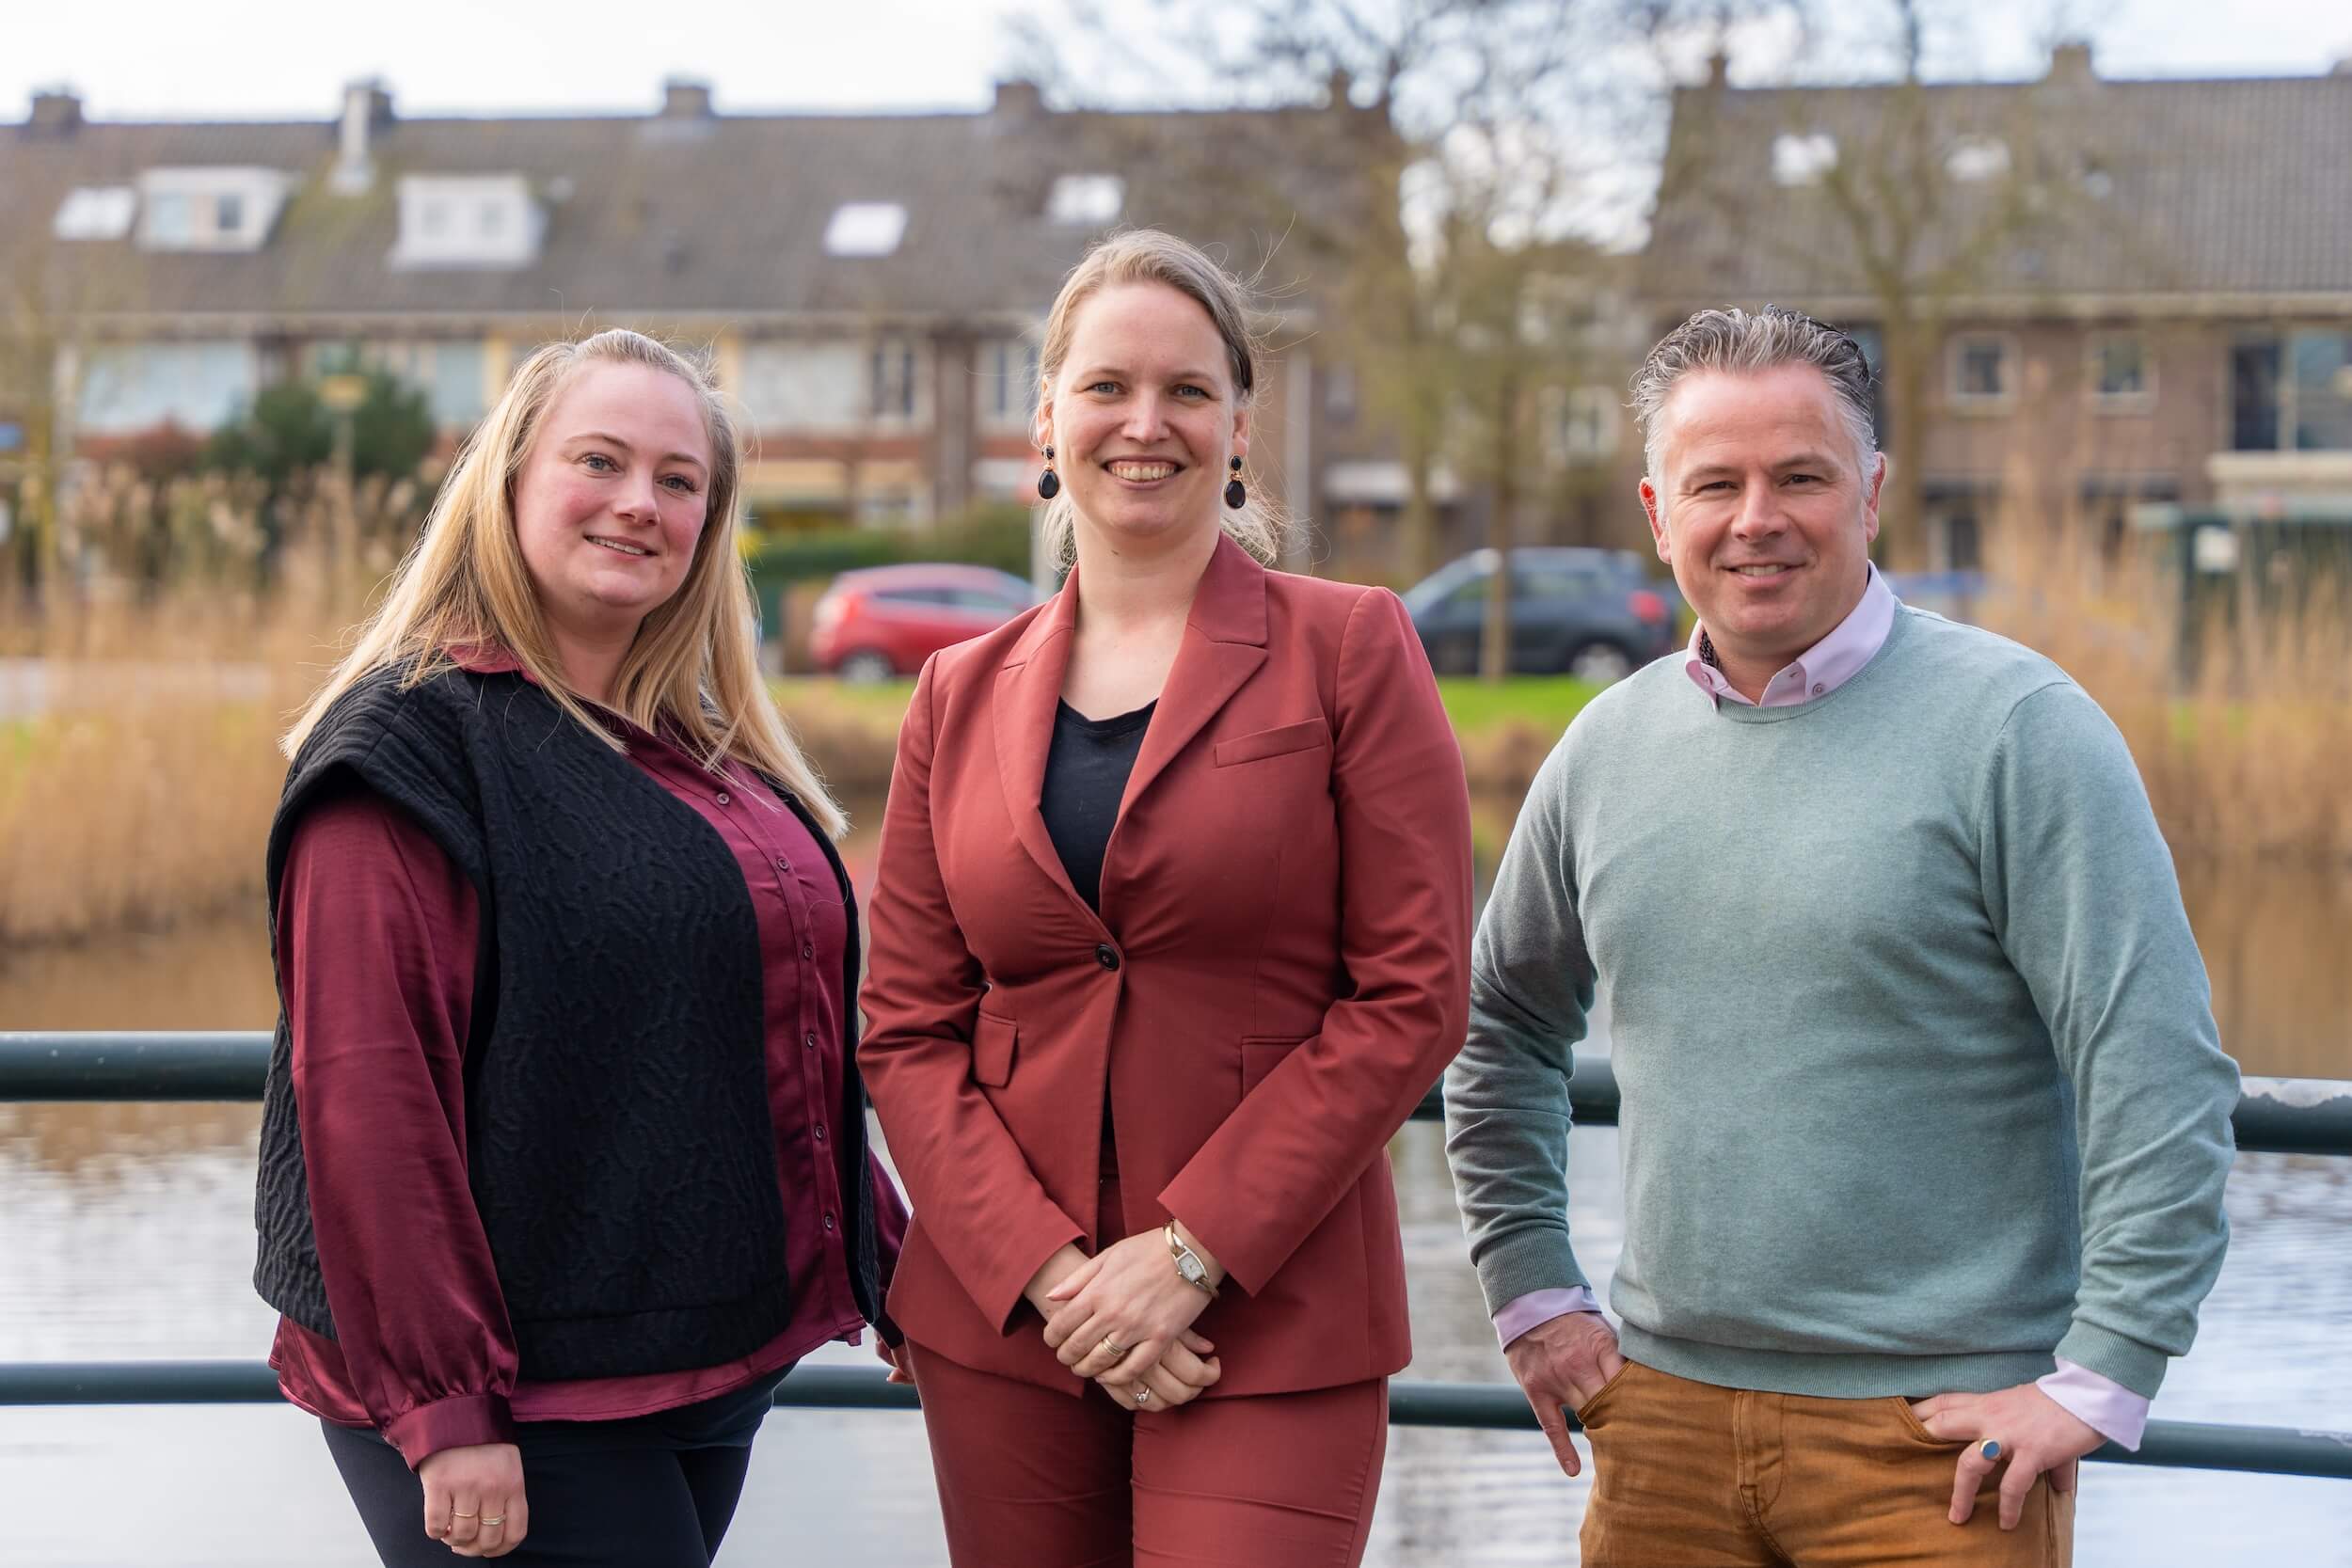
Obèr Makelaardij
Obèr Makelaardij staat voor betrouwbare en persoonlijke makelaarsdienst in Leiderdorp. Met een sterke focus op klantgerichtheid en kennis van de regio, helpen we u bij het vinden of verkopen van uw woning met zorgvuldigheid en transparantie. Wij bieden dienstverlening in verkoop, aankoop en taxaties. Onze expertise ligt in woningfotografie, woningstyling en monumenten. Wij zijn gecertificeerd door NWWI en NRVT, en communiceren in het Ne...
Current housing stock
-
- Available
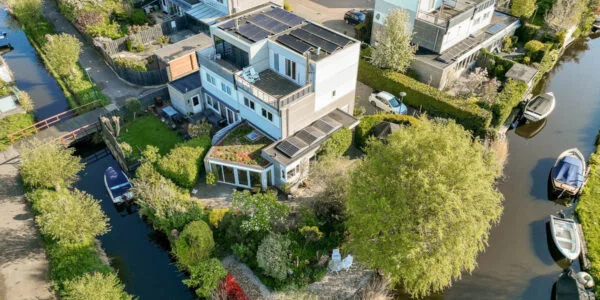
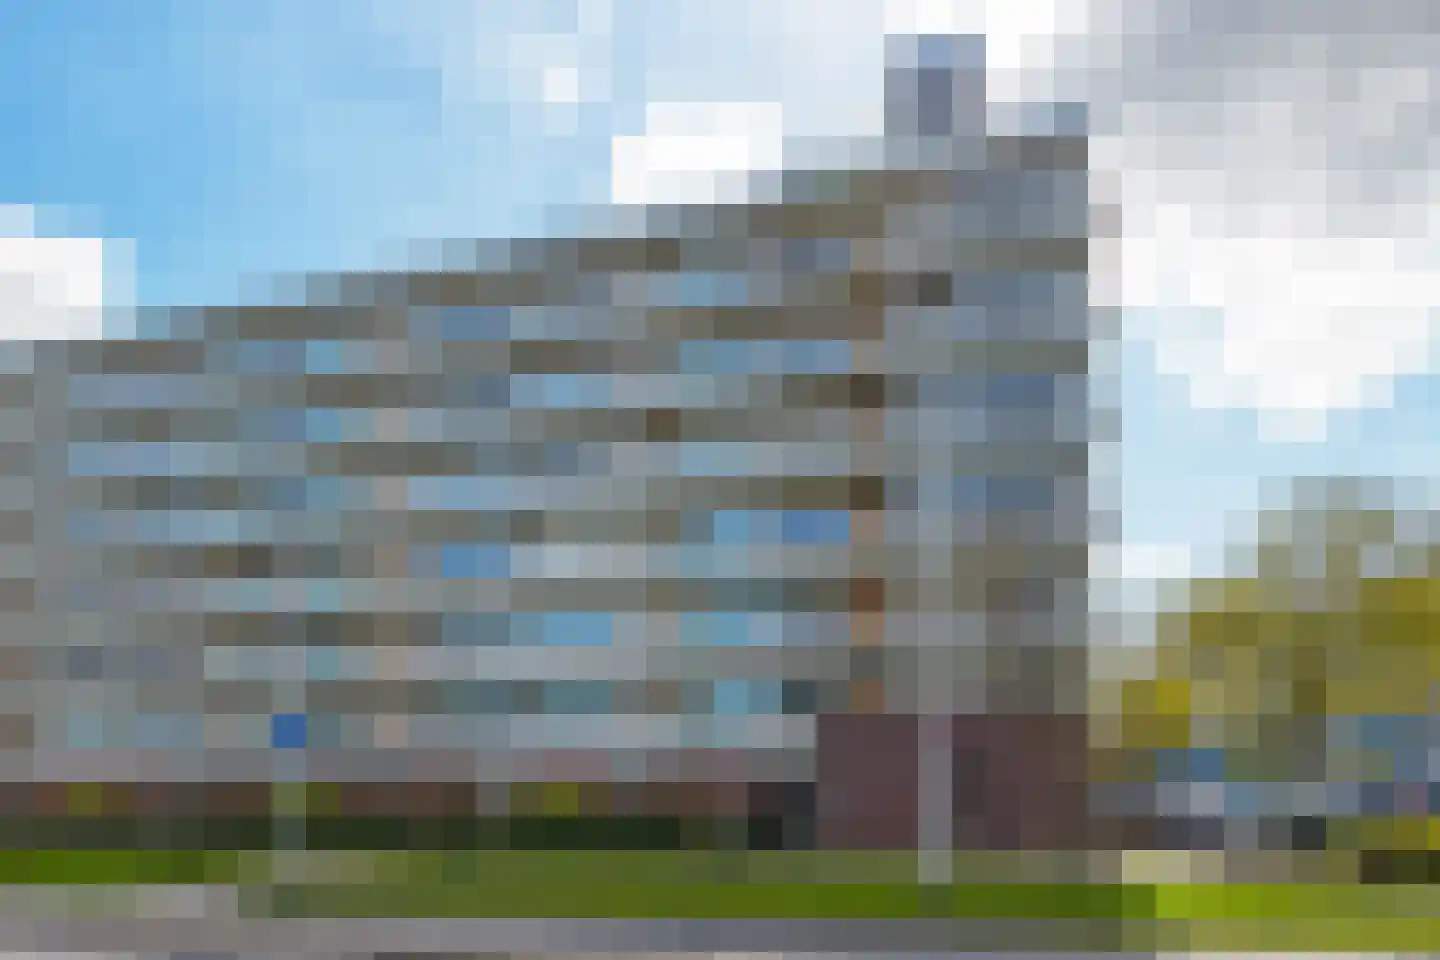
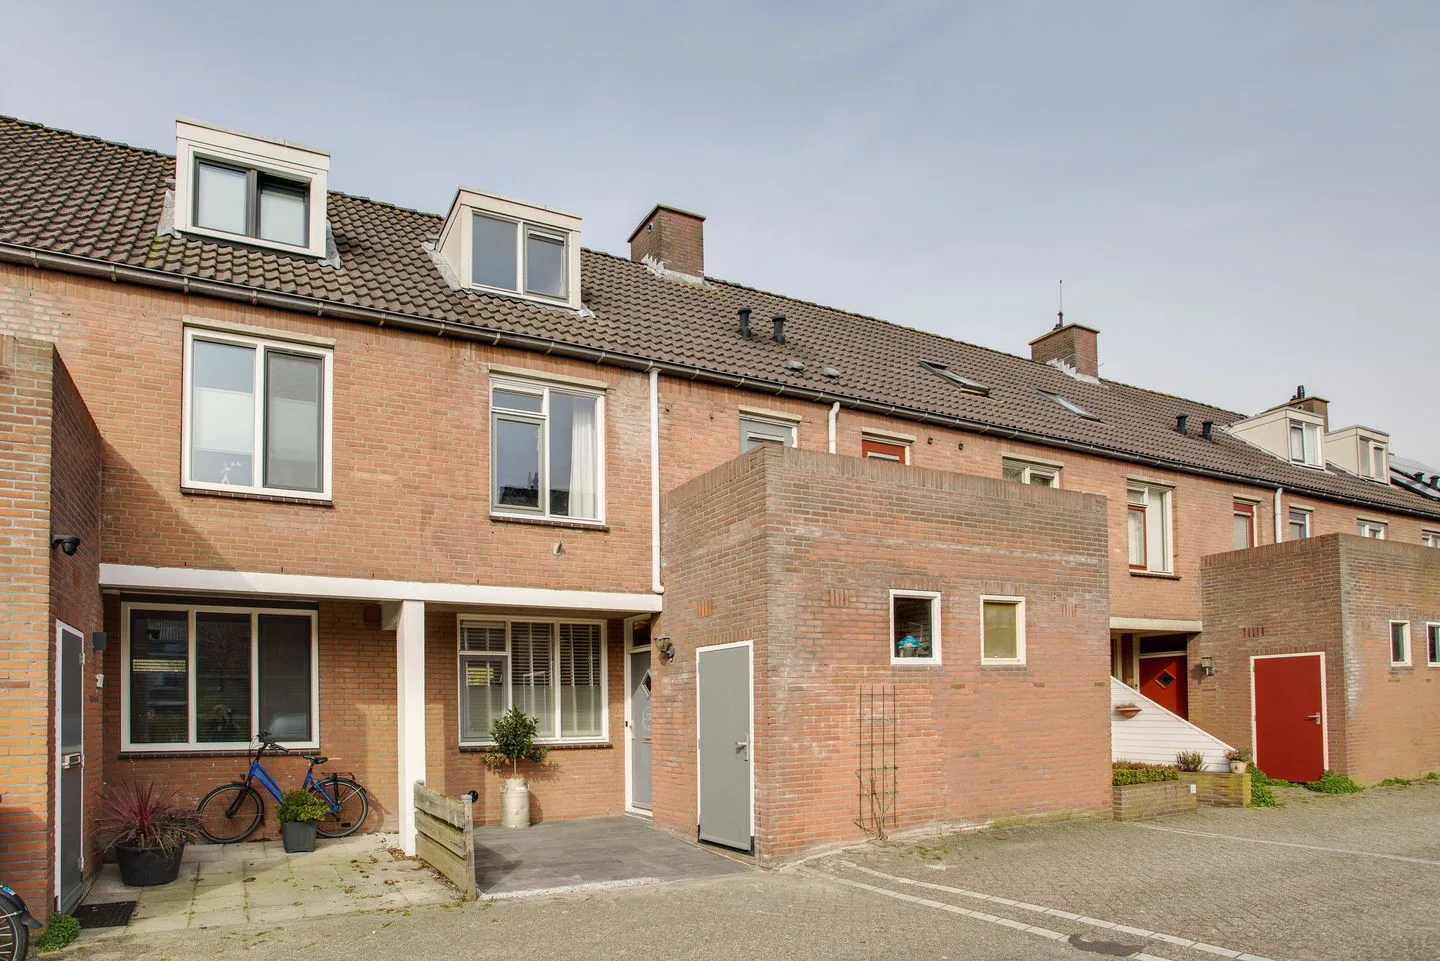
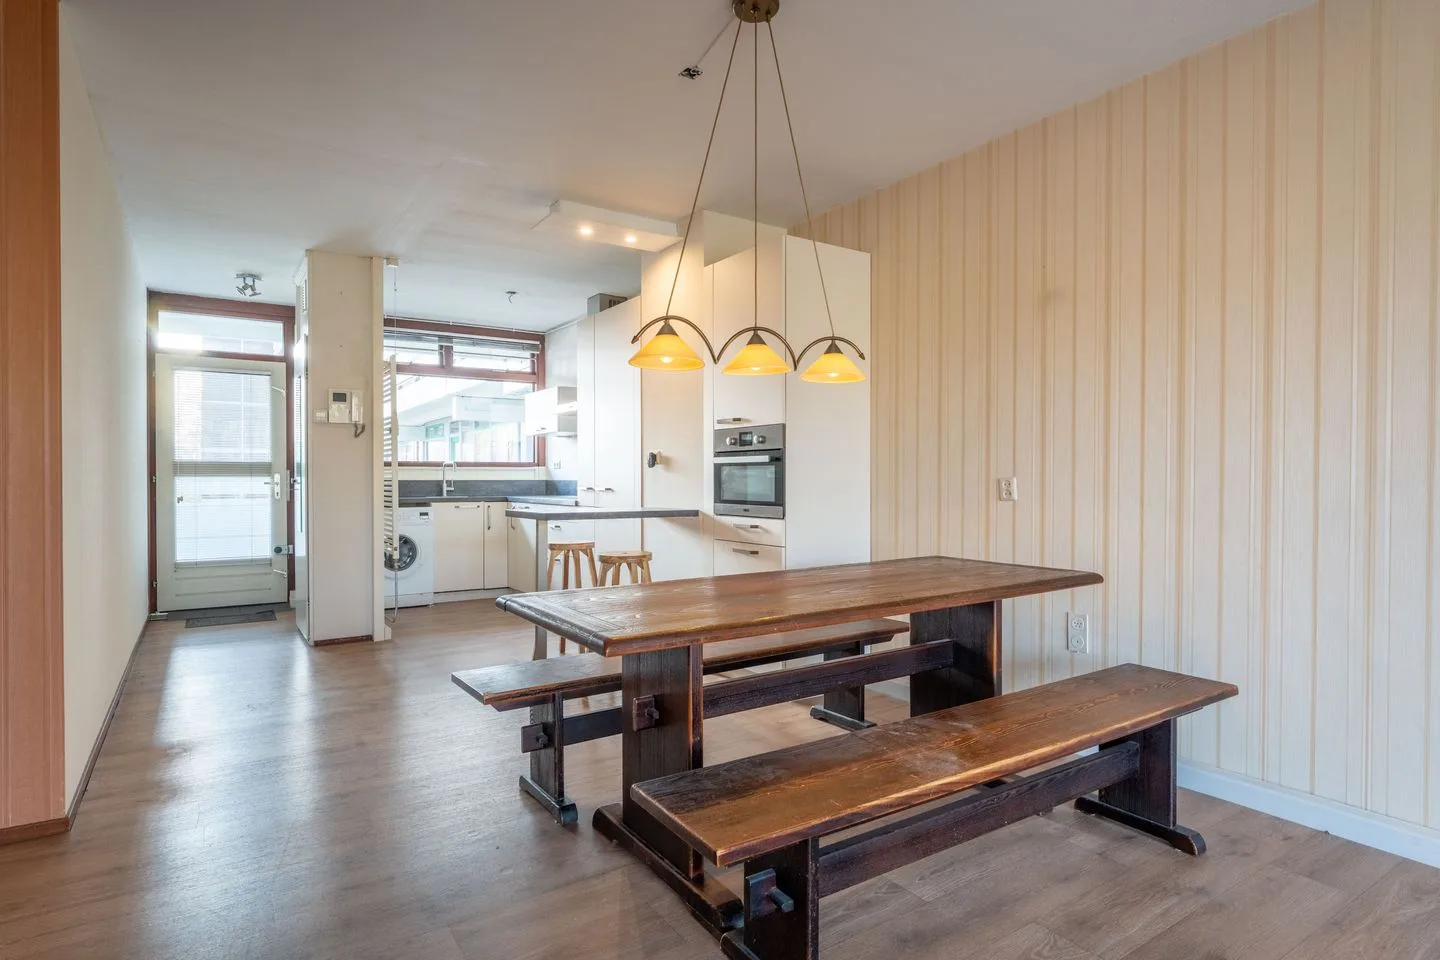
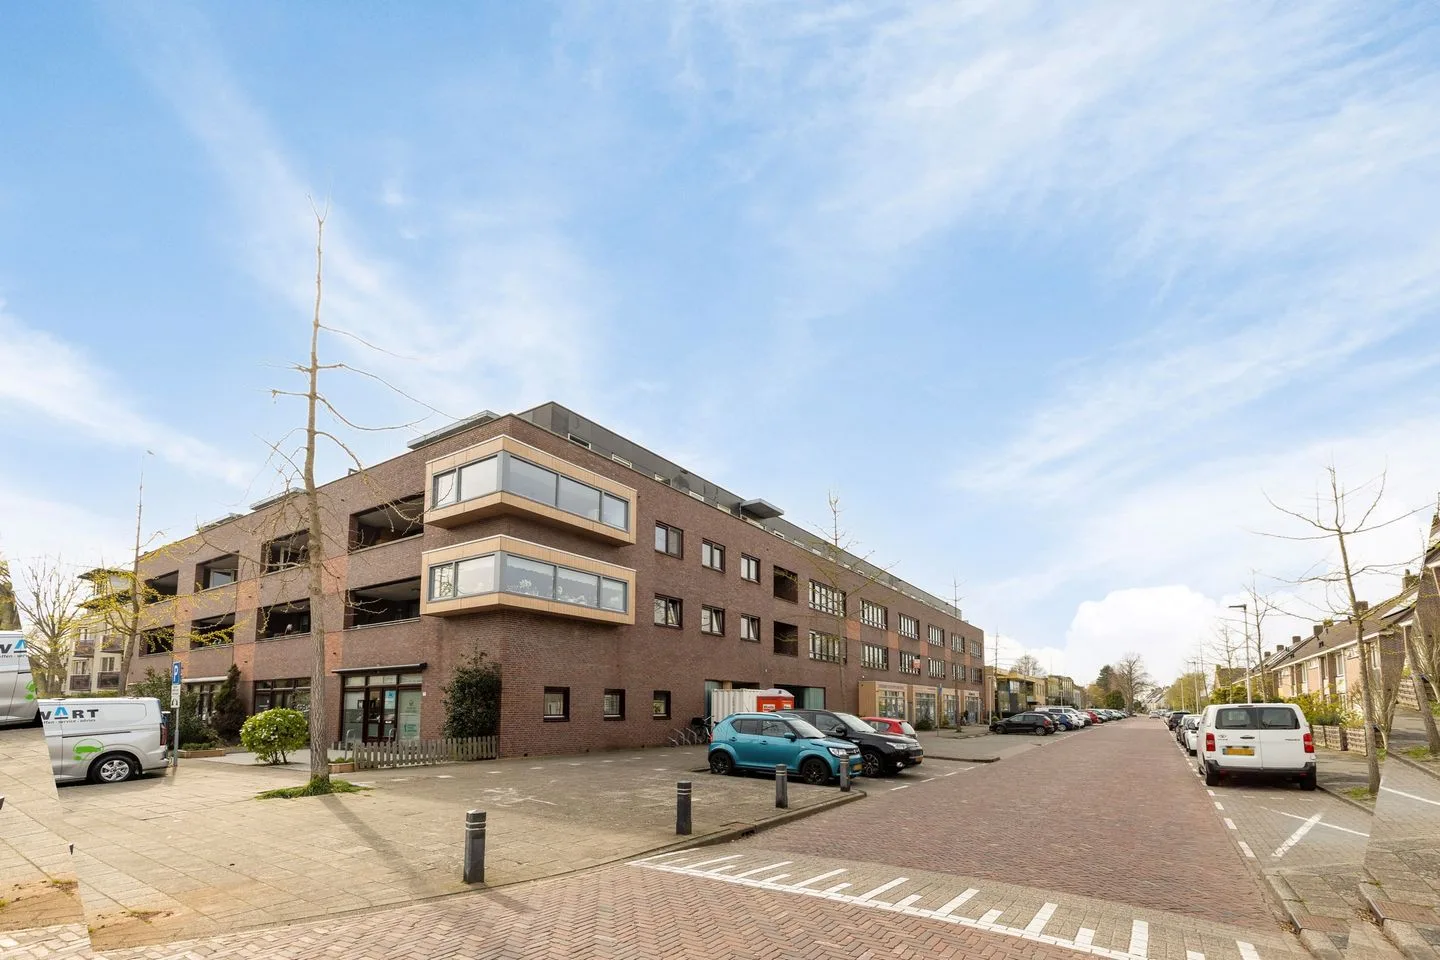
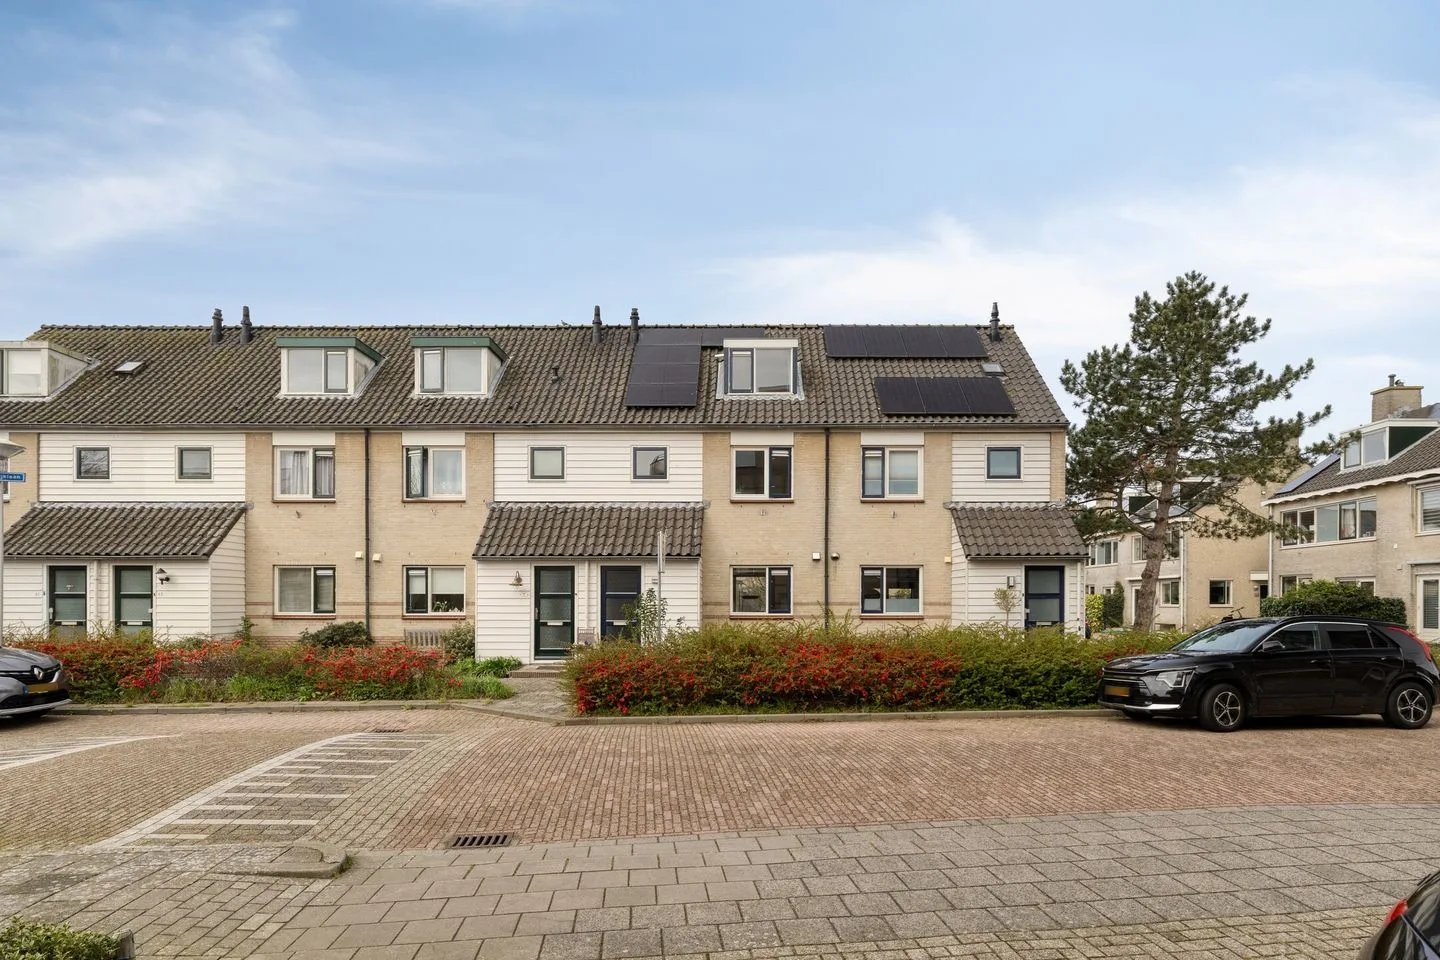
Splinterlaan 174
2352TP Leiderdorp
€ 400.000 k.k.
€ 5.063/m²
ASave as favorite- Living area
- 79 m²
- Land area
- —
- Bedrooms
- 2
-
- Available
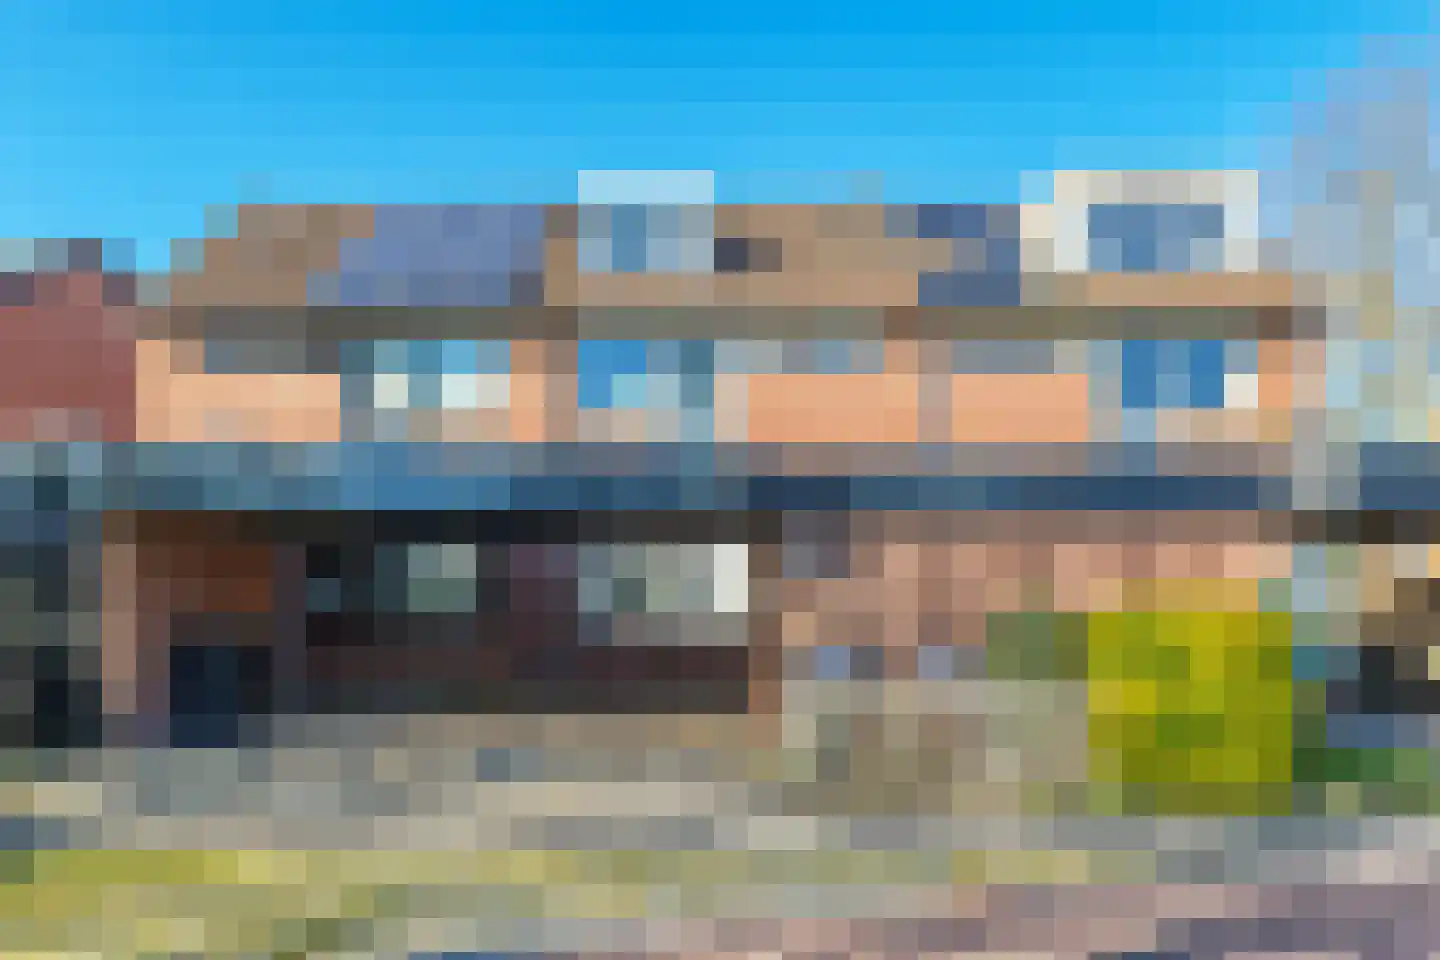
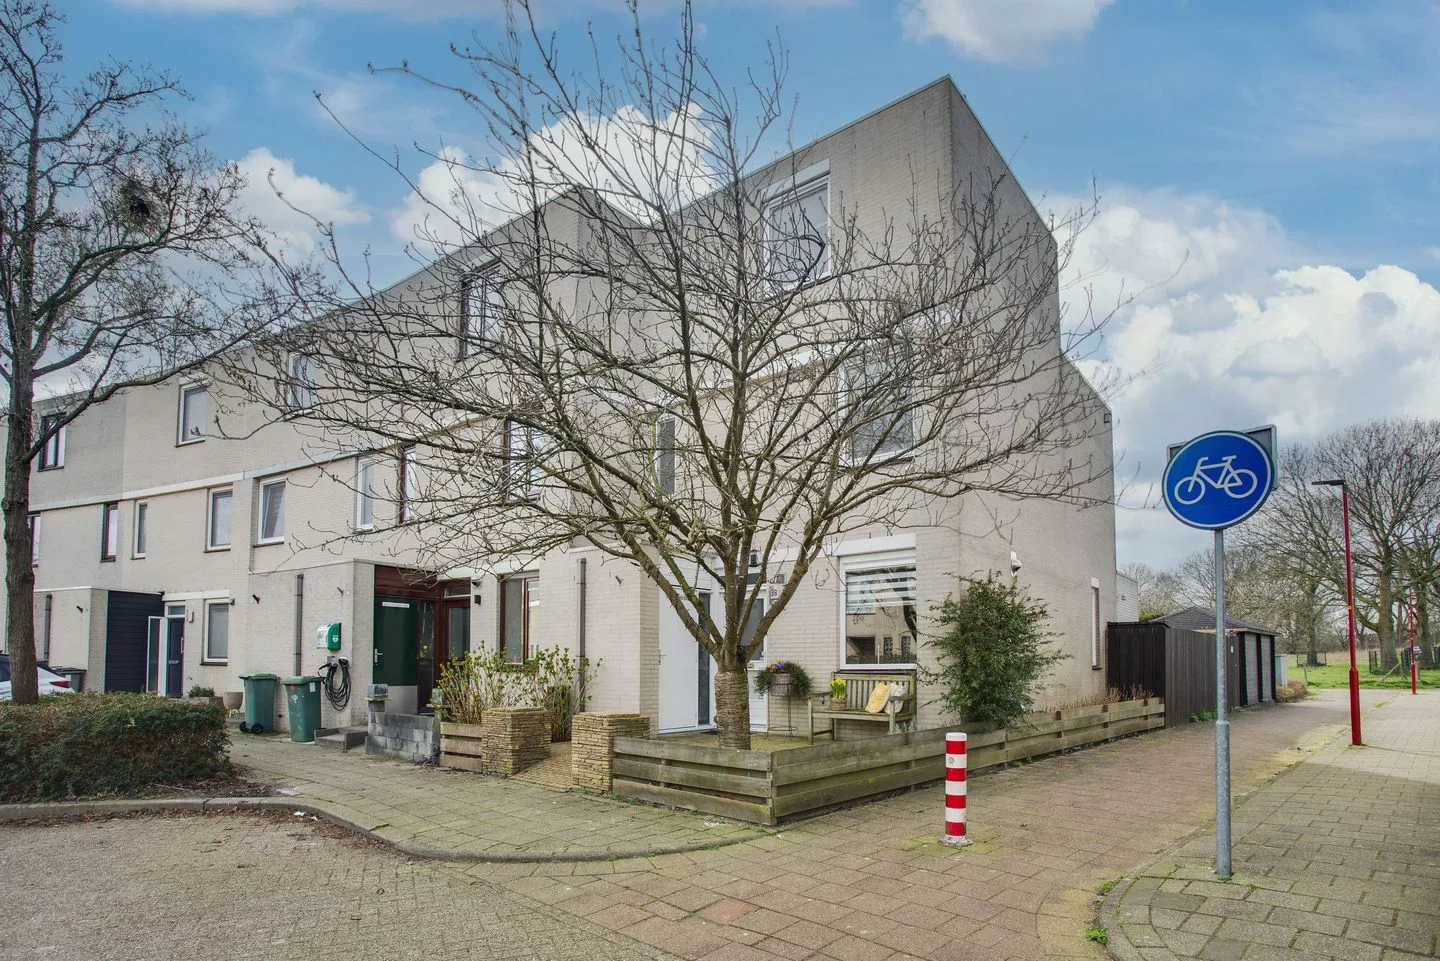
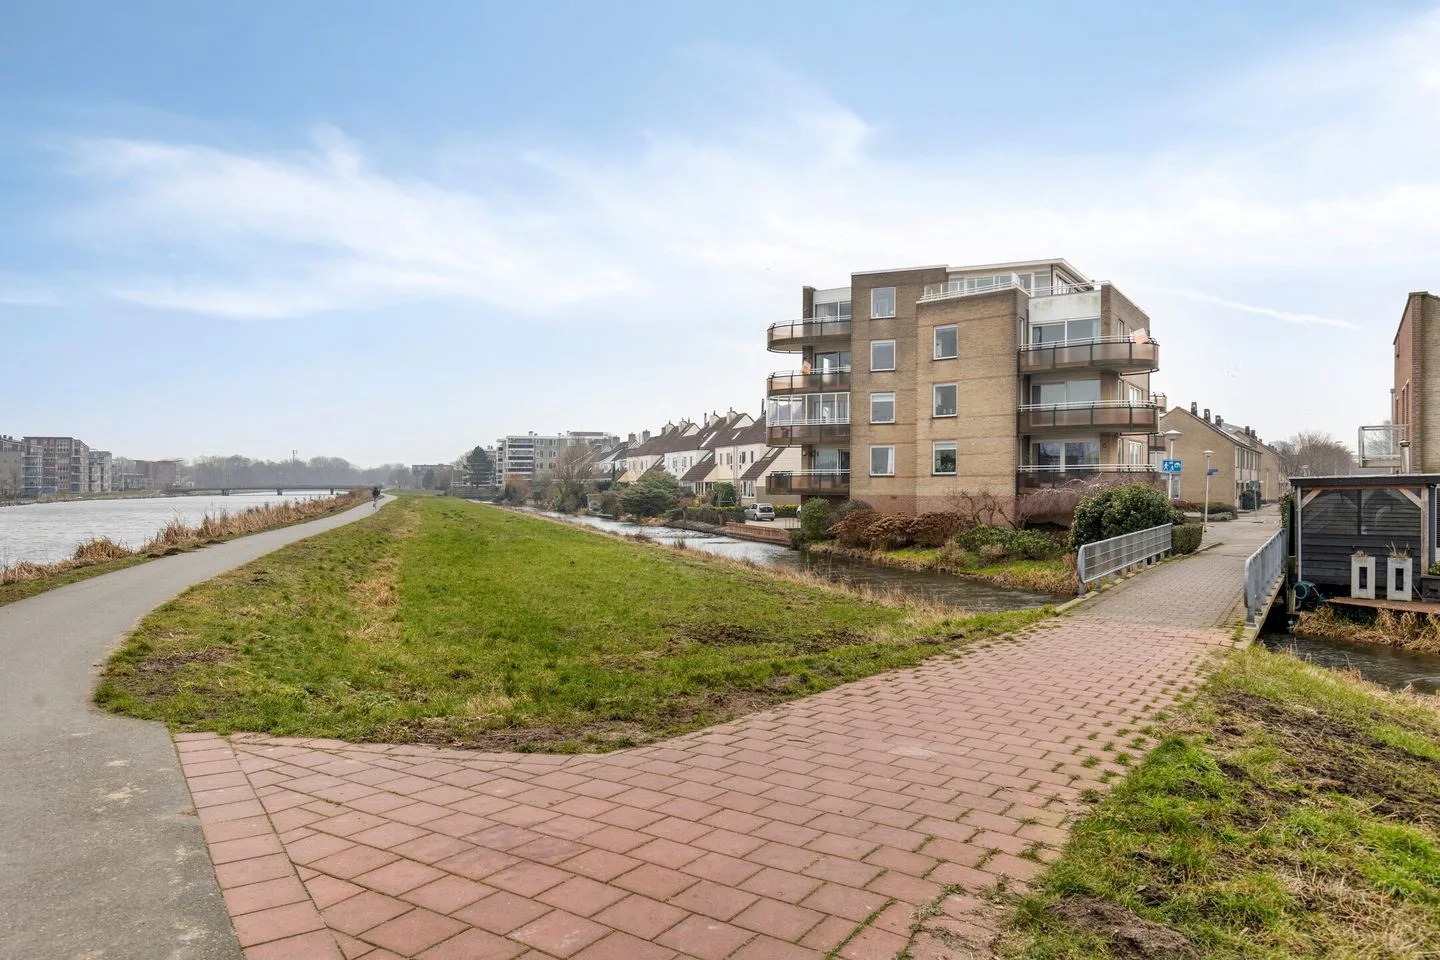
Buitendijklaan 120
2353VR Leiderdorp
€ 795.000 k.k.
€ 4.595/m²
ASave as favorite- Living area
- 173 m²
- Land area
- —
- Bedrooms
- 2
-
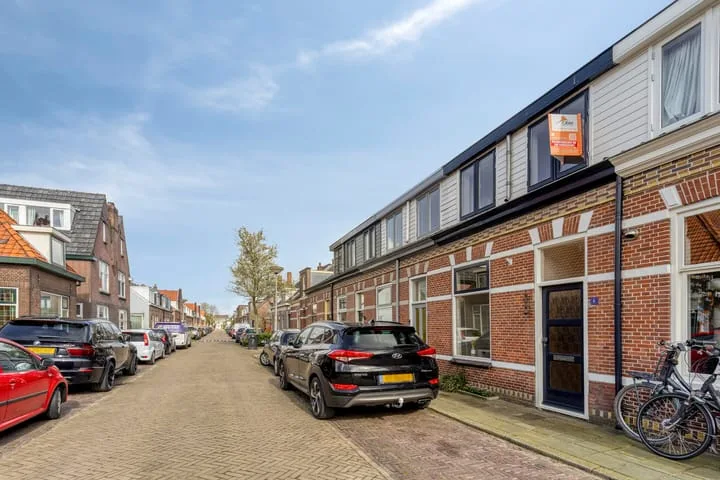
- Under consideration
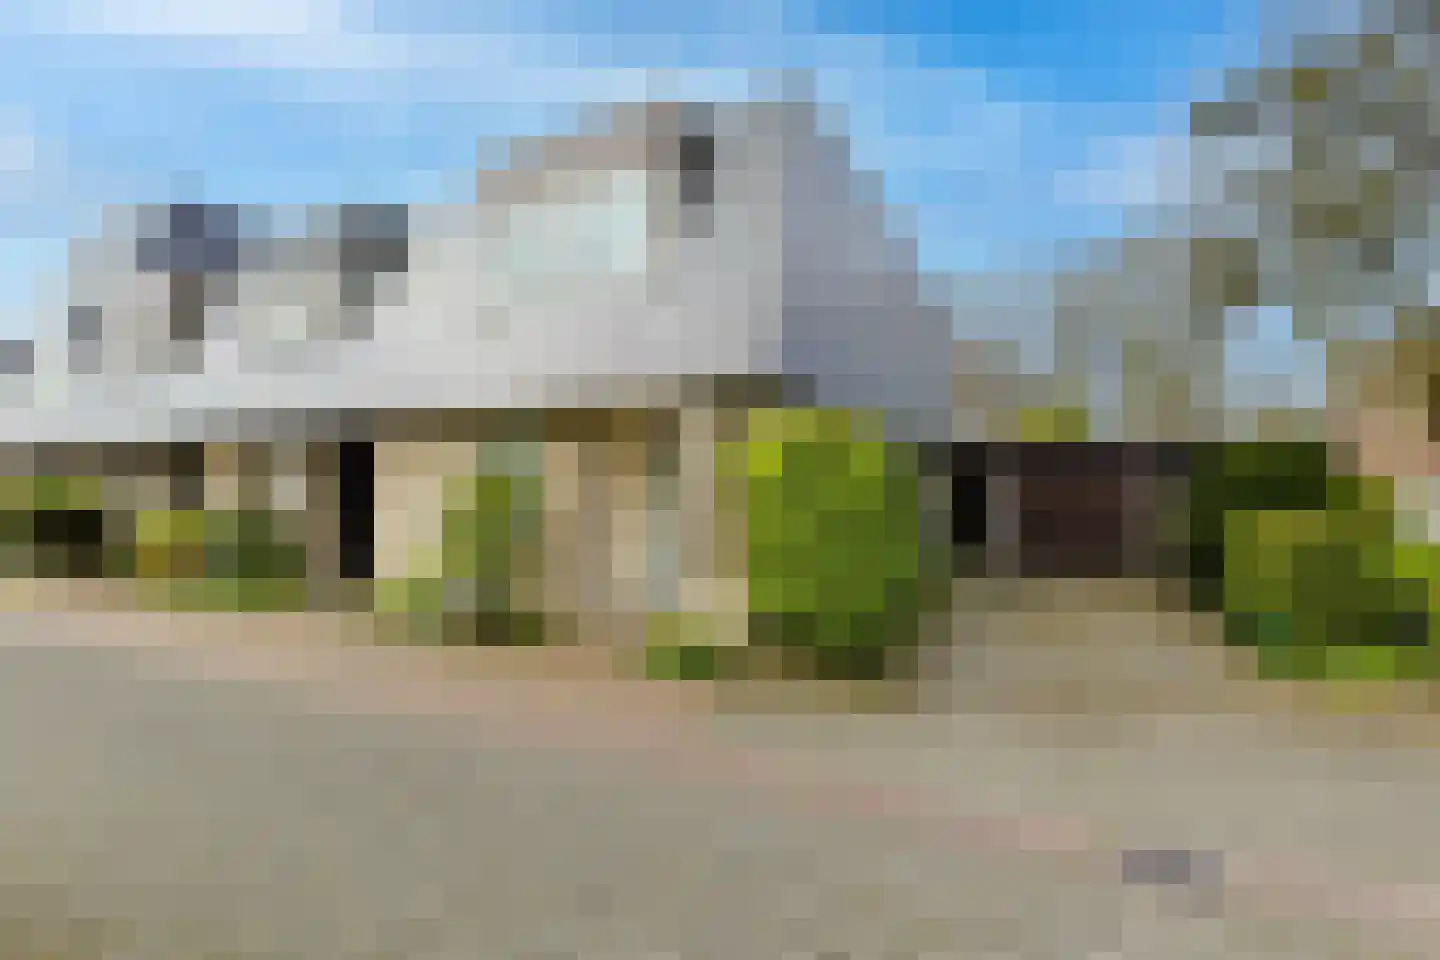
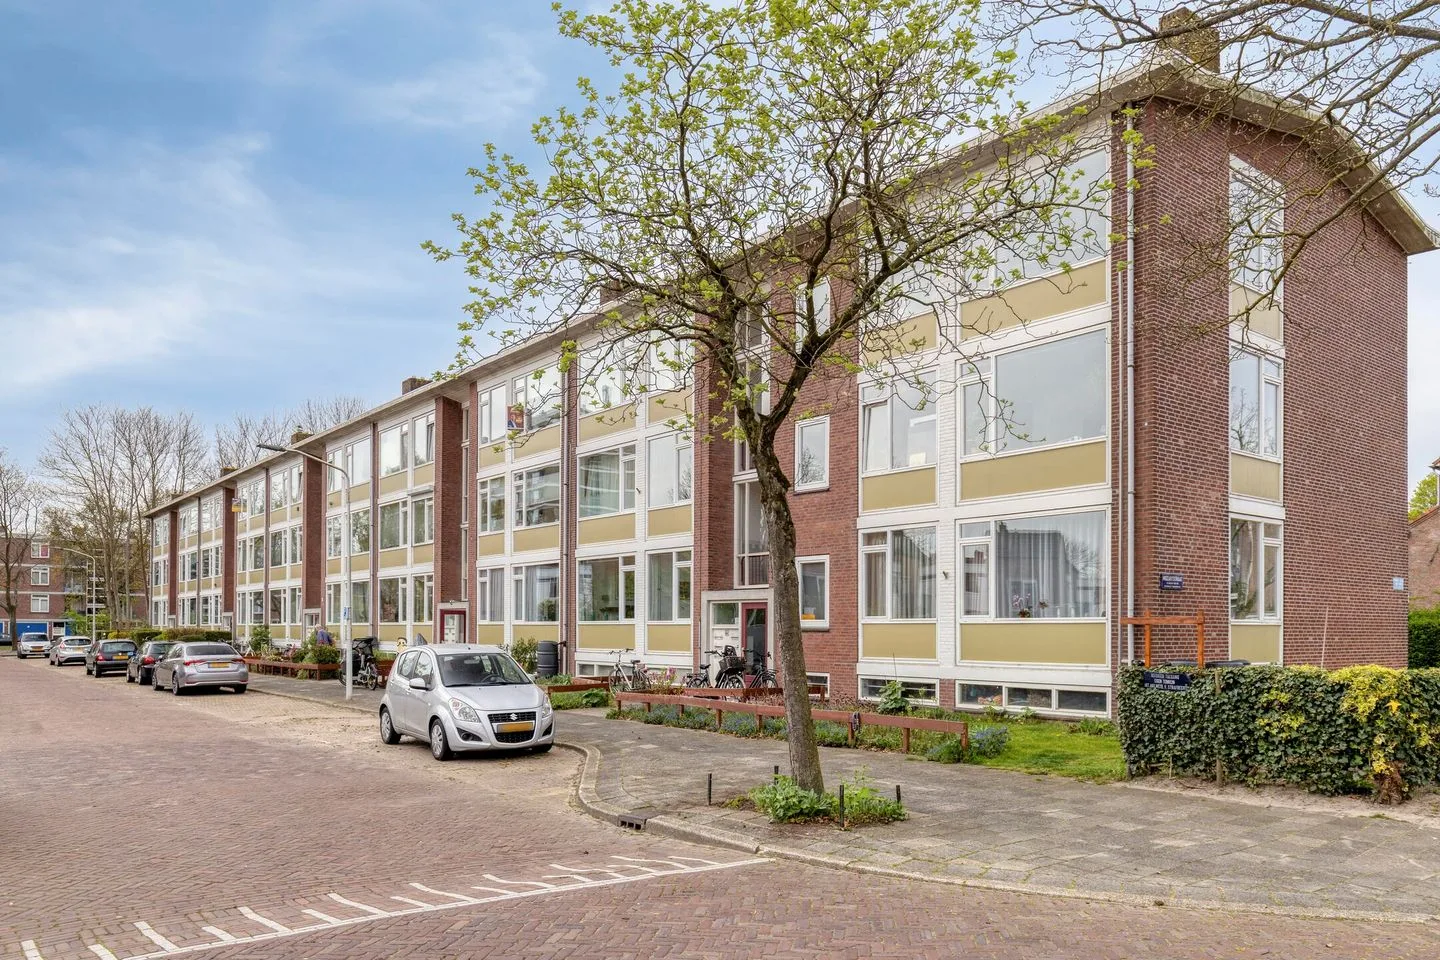
Eduard van Beinumstraat 39
2324KM Leiden
€ 295.000 k.k.
€ 5.364/m²
CSave as favorite- Living area
- 55 m²
- Land area
- —
- Bedrooms
- 2
-
- Sold
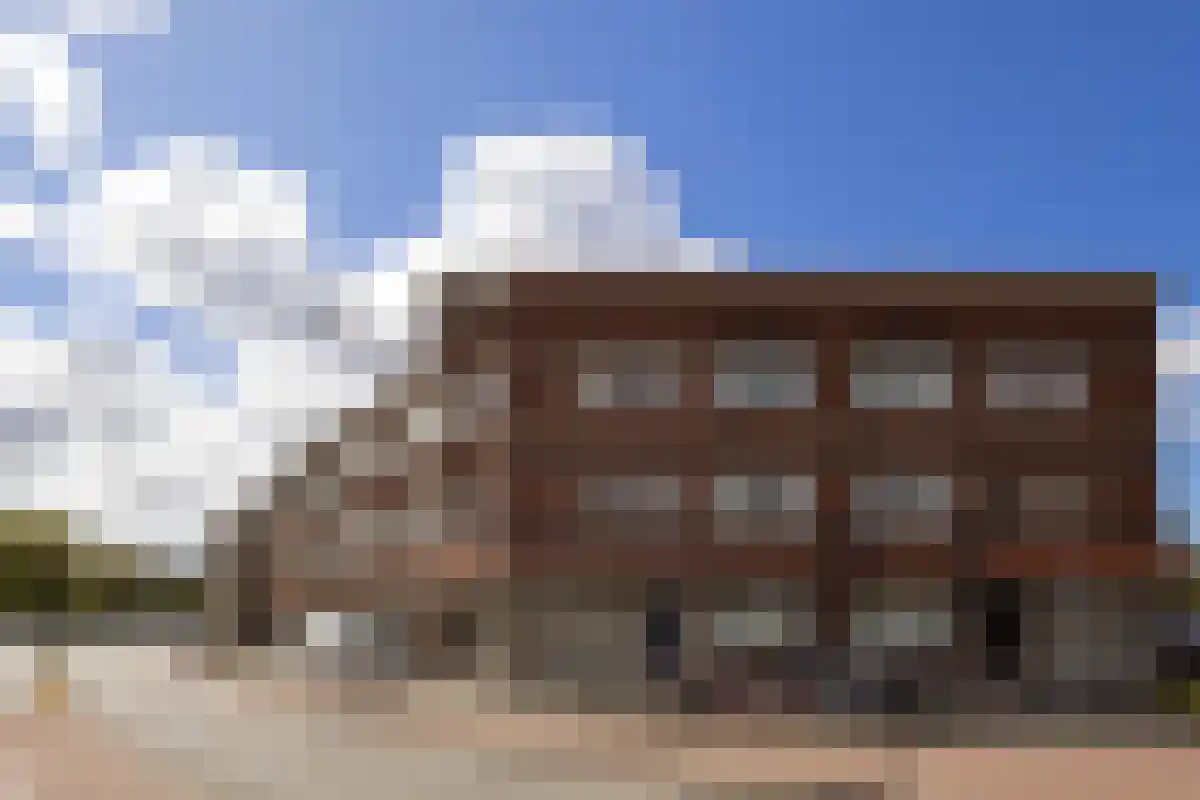
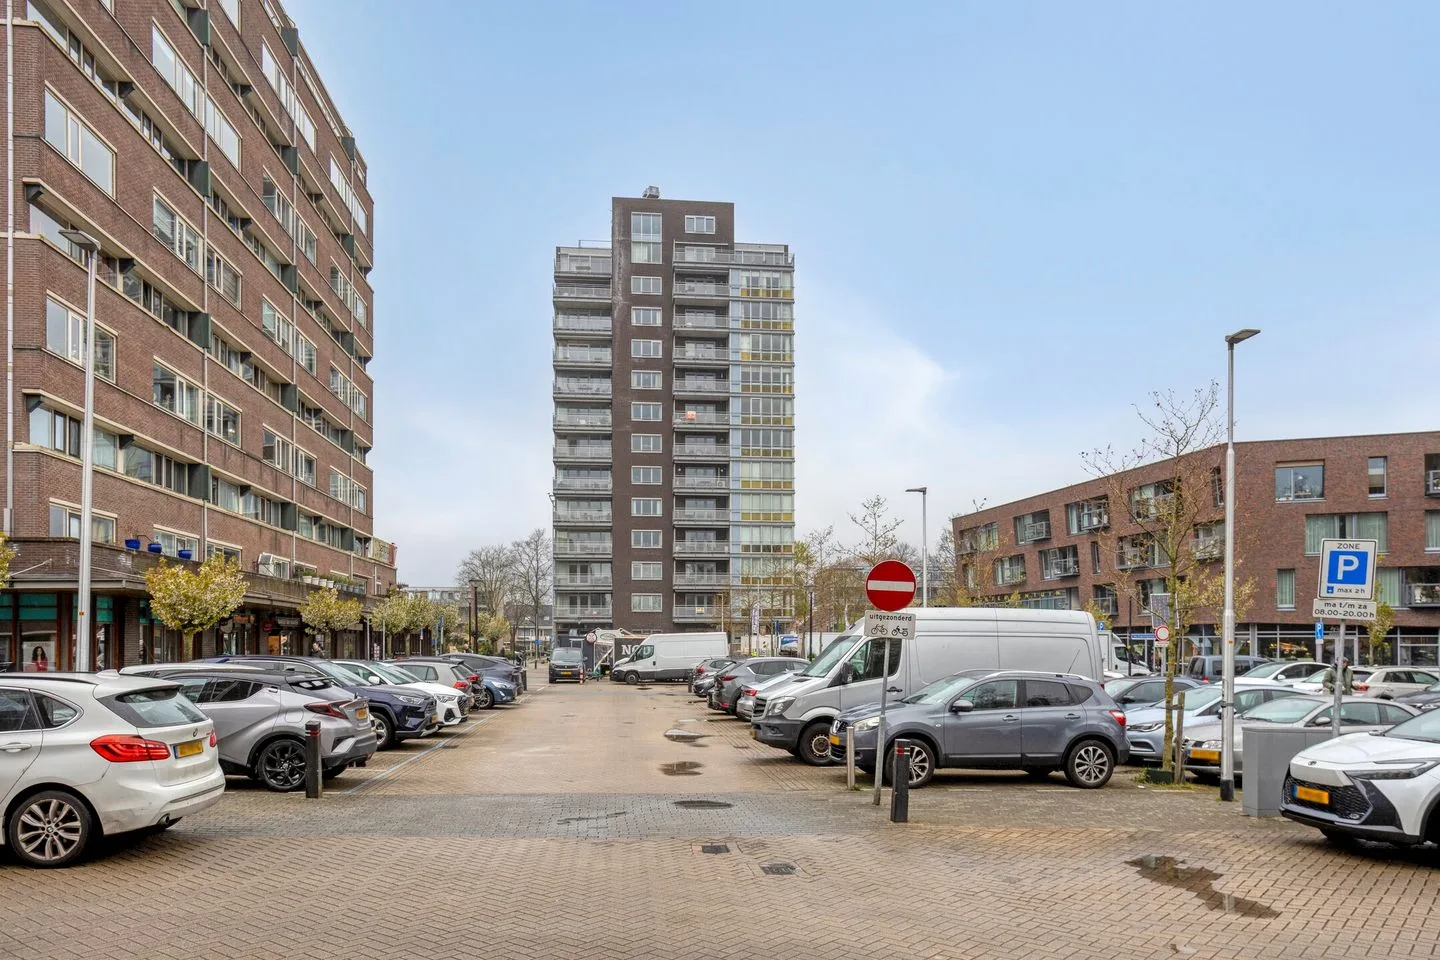
Laan van Berendrecht 292
2352VP Leiderdorp
€ 695.000 k.k.
€ 4.728/m²
A+Save as favorite- Living area
- 147 m²
- Land area
- —
- Bedrooms
- 3
-
- Sold subject to confirmation
Buitendijklaan 67
2353SC Leiderdorp
€ 575.000 k.k.
€ 4.713/m²
ASave as favorite- Living area
- 122 m²
- Land area
- 140 m²
- Bedrooms
- 5
-
- Sold
Doeslaan 6
2351SR Leiderdorp
€ 350.000 k.k.
€ 4.929/m²
DSave as favorite- Living area
- 71 m²
- Land area
- 60 m²
- Bedrooms
- 2
Reviews (125)
Review platforms
BronscoresTotal score
125 total reviews

Funda
71 reviews on Funda

54 reviews on Google
-
Merel Baaima
10Zeer fijne ervaring met Obèr Makelaardij bij zowel de koop als verkoop van ons huis. Professioneel, betrouwbaar en oprecht betrokken. Absoluut een aanrader!
-
Eric
10De beste makelaar en aankoopmakelaar van Leiderdorp
-
Joris Jonker
10Translated by AIOn recommendation, we have made use of the expertise of the team at Obèr Real Estate for buying and selling. Communication and advice were very good and fast. Clear overview of costs with their package formula. We also recommend Obèr!
-
Spieghelstraat 4
9Translated by AIVery pleasant contact, expert advice, flexible, easy to reach, presentation and visibility professional, careful and thinks along.
-
Aad
10Translated by AIHow often do you need a real estate agent? At most a few times in a person's lifetime. It's nice that you come across an agent with whom you don't have to doubt for a moment and with whom, after the first contact, you no longer feel the need to get to know other agents. Ferenc and his team know the market, ensure clear and quick communication and a great deal. Thank you for that! In short: Obèr real estate is an absolute recommendation in Leiderdorp and the surrounding area.
-
Dr. van Rhijnstraat 12
10Translated by AIWe had a great experience with Obér, they really listen to what you want and are involved. After the lot of enthusiasm for our property everything was pulled out of the closet to get as many people as possible to come view it. The handling was also very good and everything was thought of.
-
Albatrosstraat 4
10Translated by AIWe had a very pleasant experience and positive outcome with Ober Makelaardij. Everything was professional and on time :)
-
Mike Kuppens
10Translated by AISuper 5 star real estate agent. Obèr Makelaardij has guided us very well in selling our house.
-
Pauline Everse
10Translated by AII have had a very positive experience with Obér Makelaardij in the sale of my house. The process was professionally and carefully guided, with a lot of patience and clear explanations throughout the entire process. The service is personal and reliable, with attention to detail and customer focus. In short, a real estate agent who understands his profession and on whom you can rely. A true recommendation.
-
Meidoornstraat 17
10Translated by AICustomer friendly, Expert, Empathetic. Excellent experience with real estate agent and staff, definitely a recommendation 👍
-
Westlanderwerf 7
10Translated by AIOur sales agent was also our purchase agent for our next home, which made communication easier because she already knew us. The contact went smoothly and professionally. The agent was clearly involved and a pleasant person to work with.
-
Hoogmadeseweg 28
10Translated by AIContact is good and efficient, real estate agent has clear experience in this neighborhood with a handy network as well.
-
Kerckwervelaan 16
10Translated by AIWe felt a very nice and big personal involvement. The help and guidance was really nice!
-
Mark Koster
10Translated by AIHelpful, personal and above all local knowledge!
-
Weegbreelaan 11
10Translated by AIWhere in this market as a real estate agent you actually don't have to do much, Ober did more than necessary. Nice photos, good video on socials, viewings and offers perfectly organized. House sold quickly... very satisfied.
-
Obool 16
10Translated by AIFerenc brilliantly accompanied the sale of my apartment in Leiderdorp. The communication was clear and proactive. When it came to practical matters, he thought along and made sure that everything ran smoothly towards the handover. A recommendation for everyone looking for an involved and professional real estate agent.
-
Reviusdreef 36
9Translated by AIThe contact with the real estate agent went perfectly. The video was recorded on October 3rd in the atmosphere, which was a nice added value. Furthermore, we were well guided through the entire process of selling the house.
-
Dijkgravenlaan 11
9Translated by AIWe are extremely satisfied with the guidance of our real estate agent during the purchase of the new house for my parents. From the first contact, they were professional, involved and always available for questions. We are extremely grateful for the effort, care and calm that the real estate agent gave them.
-
Hans van Buijten
10 -
Spieghelstraat 27
10Translated by AIWe felt seen and heard from the beginning. The team at Obèr Makelaardij guided us in a personal way, with knowledge and genuine interest. The result exceeded all our expectations!