Grandia en Partners B.V.
"100% sales agent"

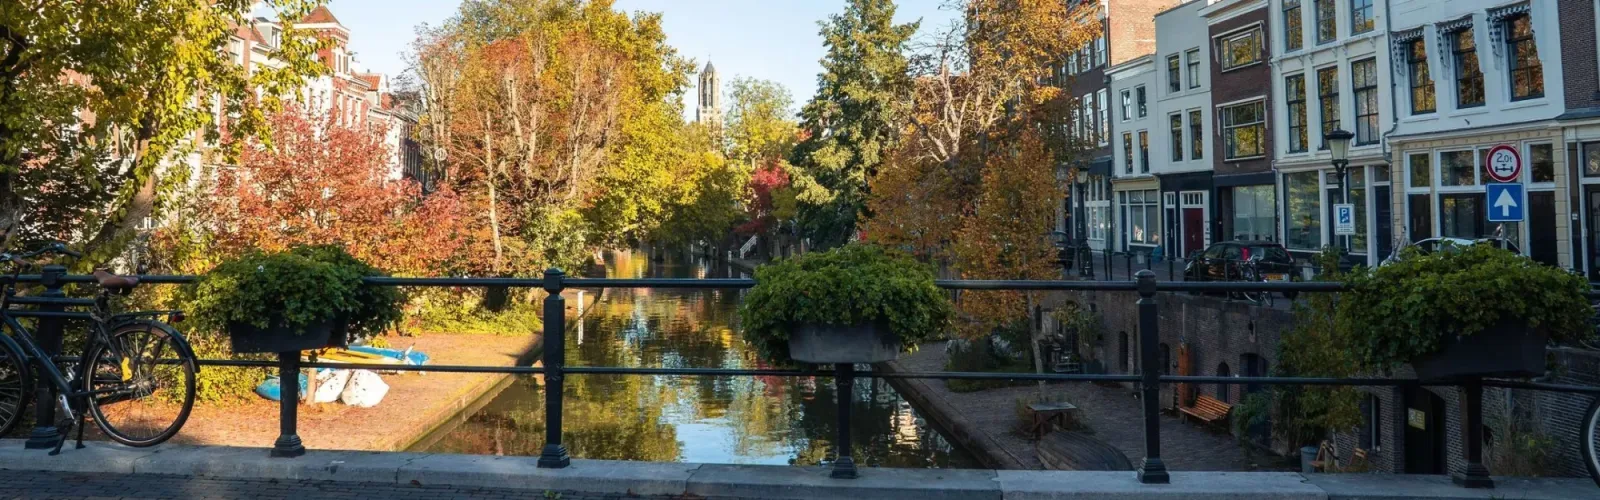
Grandia and Partners B.V. is a real estate agent in Utrecht, with property sales as its core activity. With years of experience in the industry, we bring a sober and honest approach. We emphasize clear information and a well-considered sales strategy, so that our clients can feel calm and focused during the process. Our approach is direct and transparent, without unnecessary talk. We work with a clear goal: the best result for our custo...
Current housing stock
-
- Available
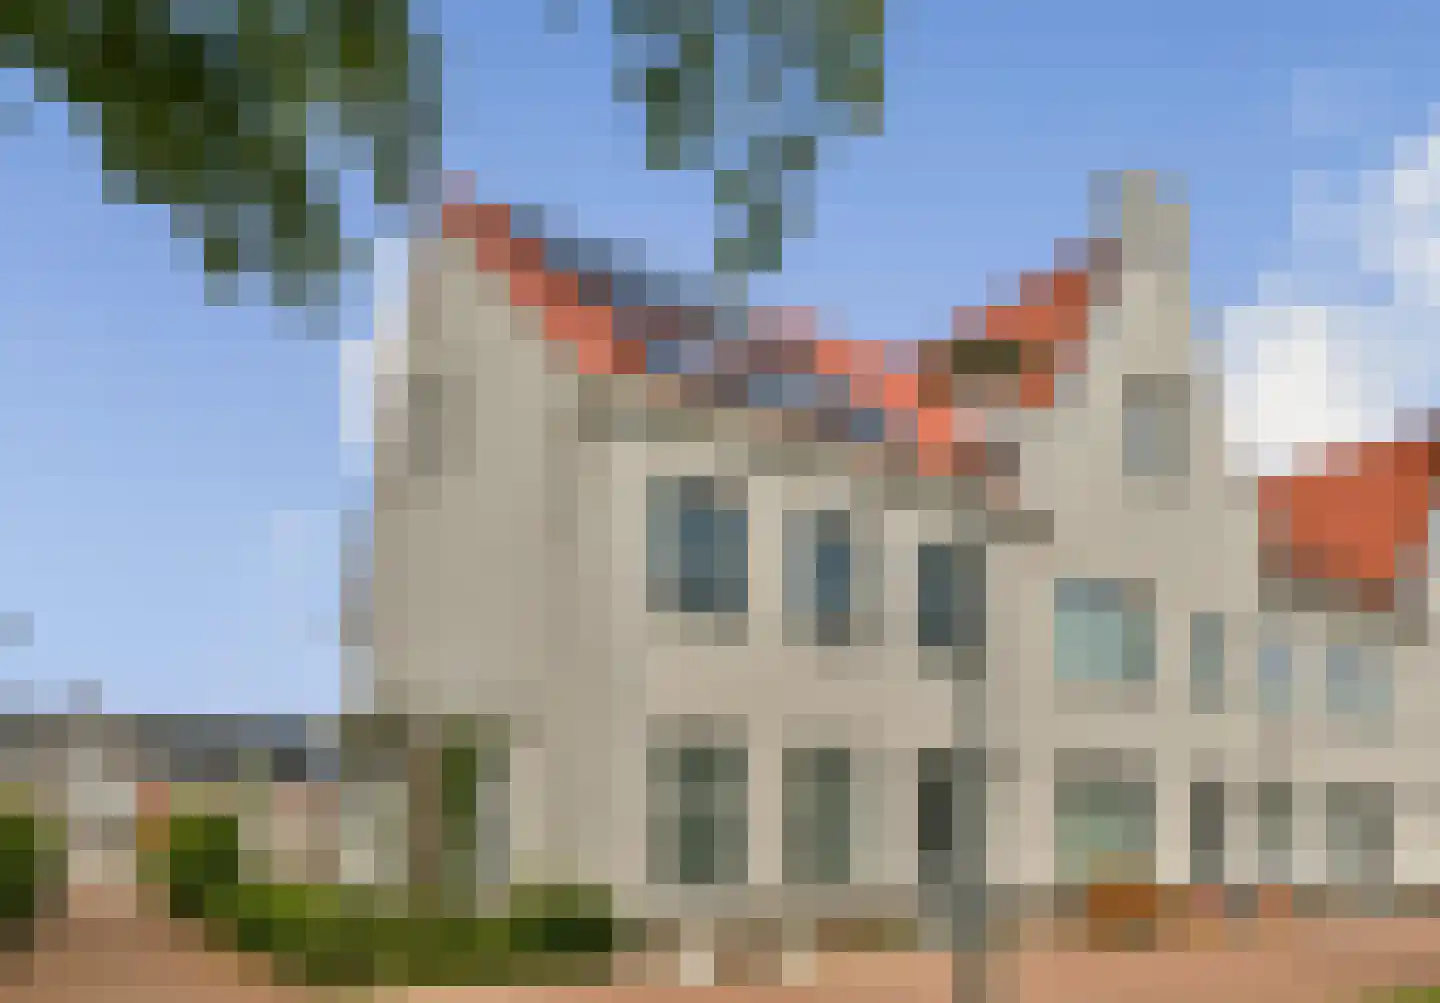
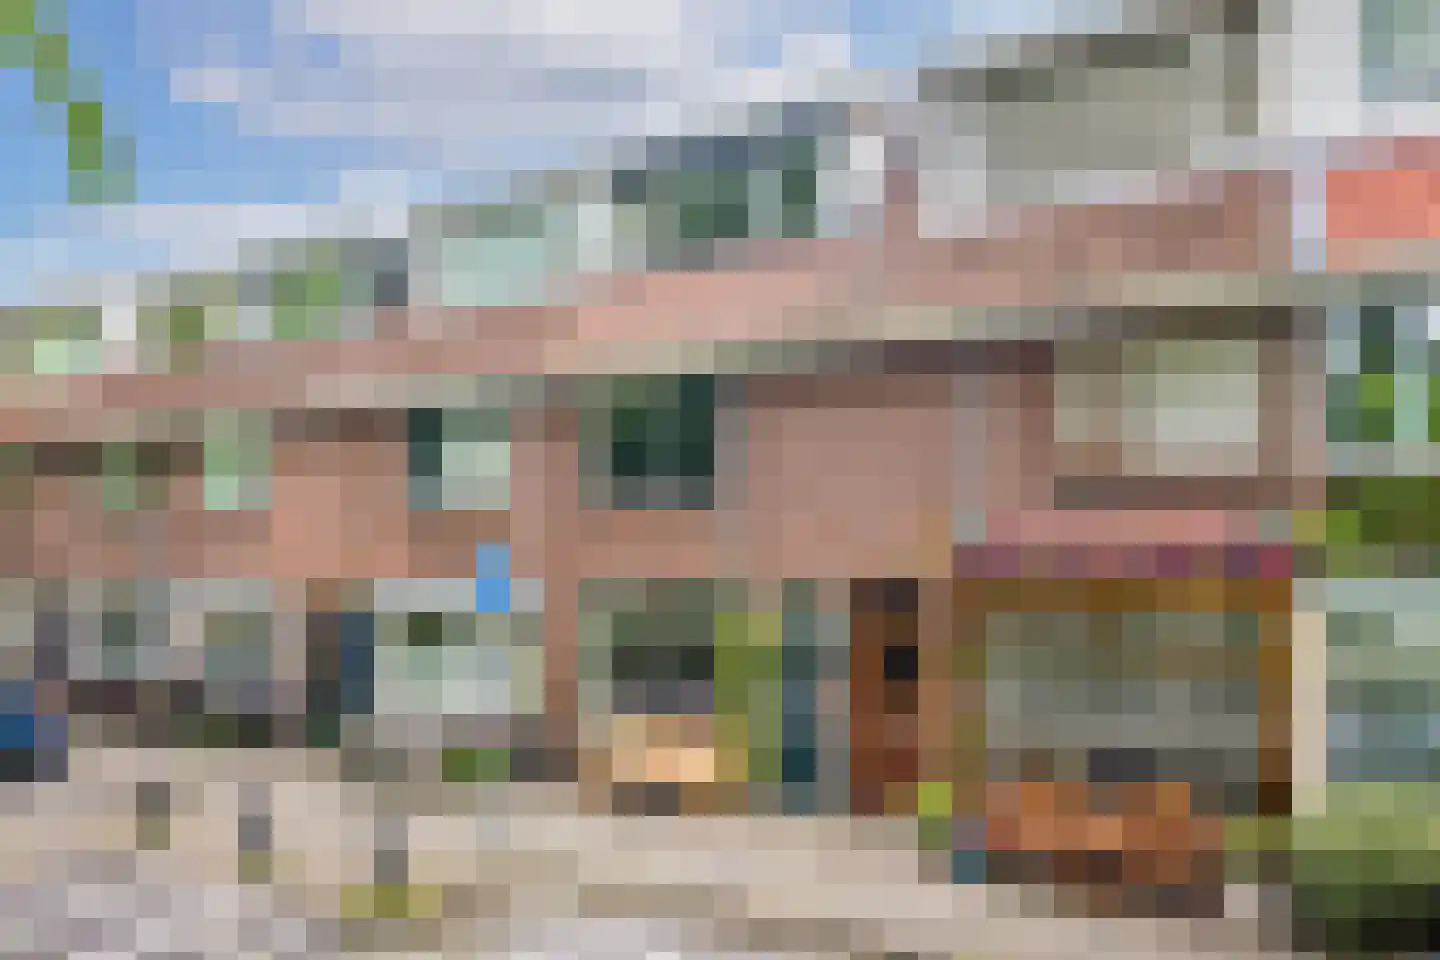
Riouwstraat 27
3531CT Utrecht
€ 550.000 k.k.
€ 6.044/m²
CSave as favorite- Living area
- 91 m²
- Land area
- 54 m²
- Bedrooms
- 3
-
- Under consideration
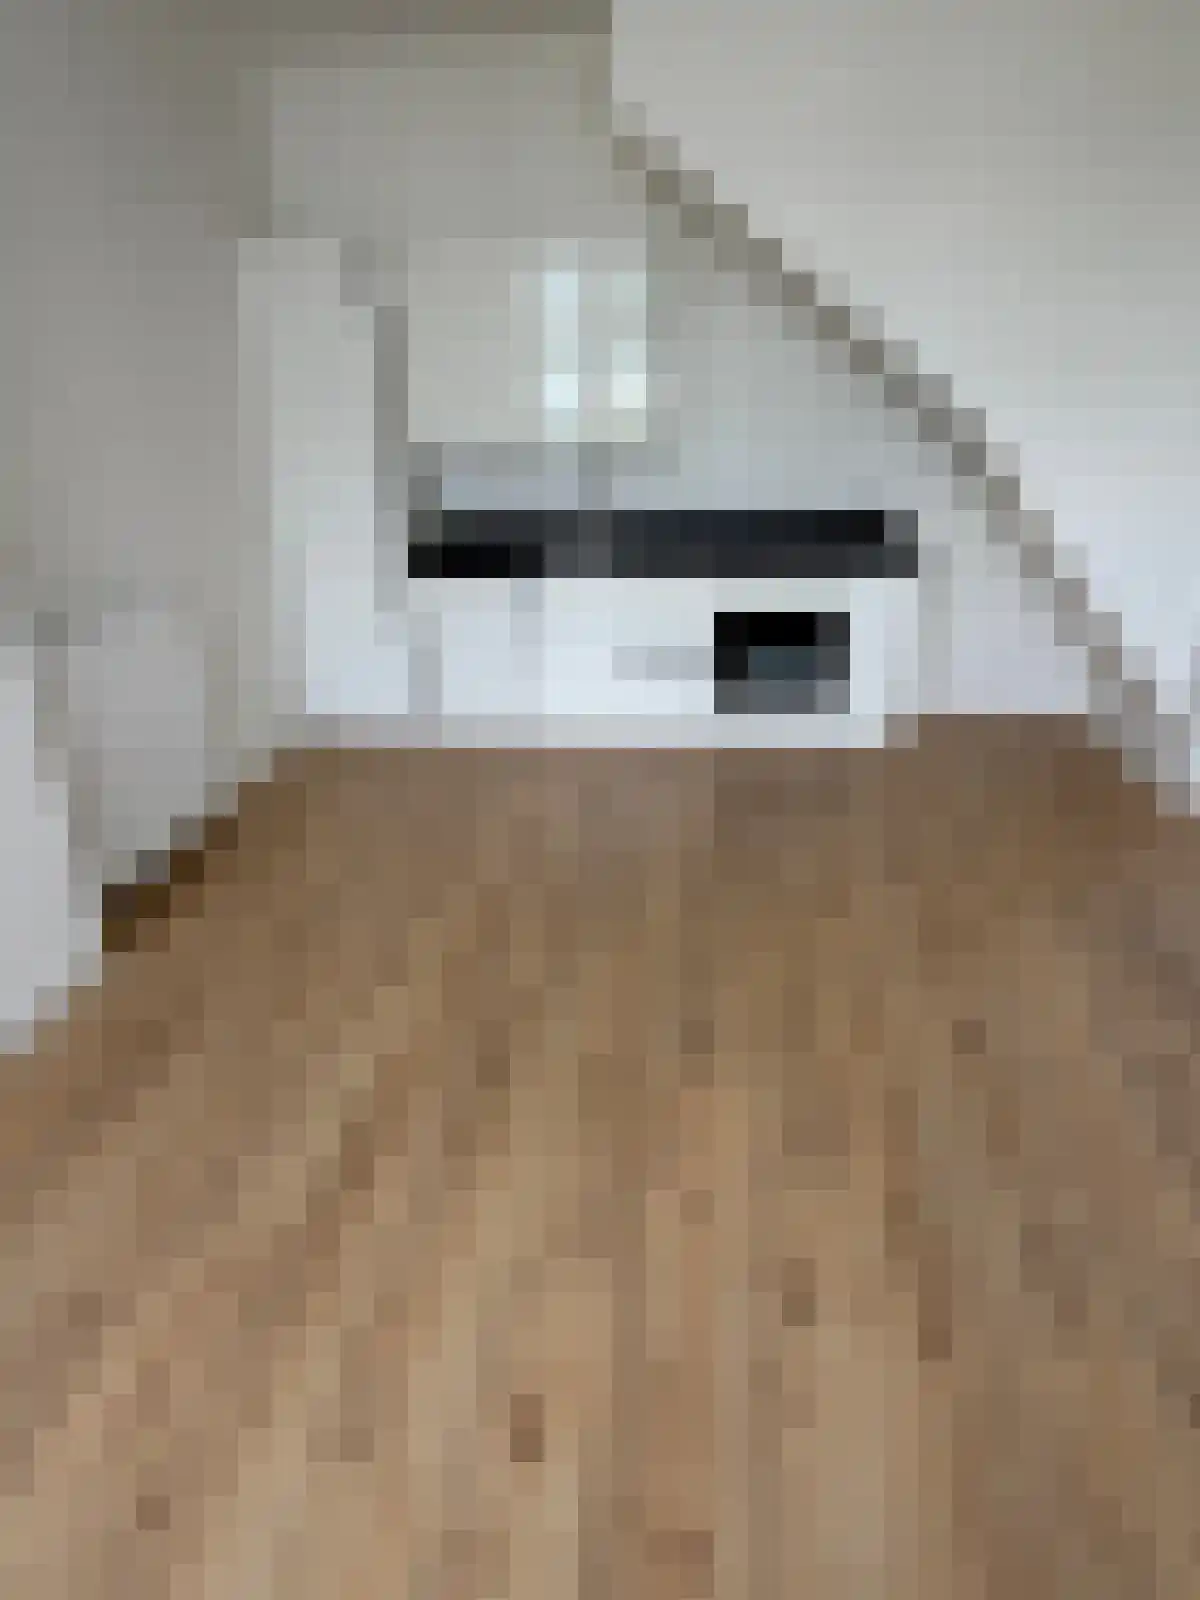
Oudwijkerlaan 1 B
3581TA Utrecht
€ 345.000 k.k.
€ 9.583/m²
FSave as favorite- Living area
- 36 m²
- Land area
- —
- Bedrooms
- 1
-
- Sold
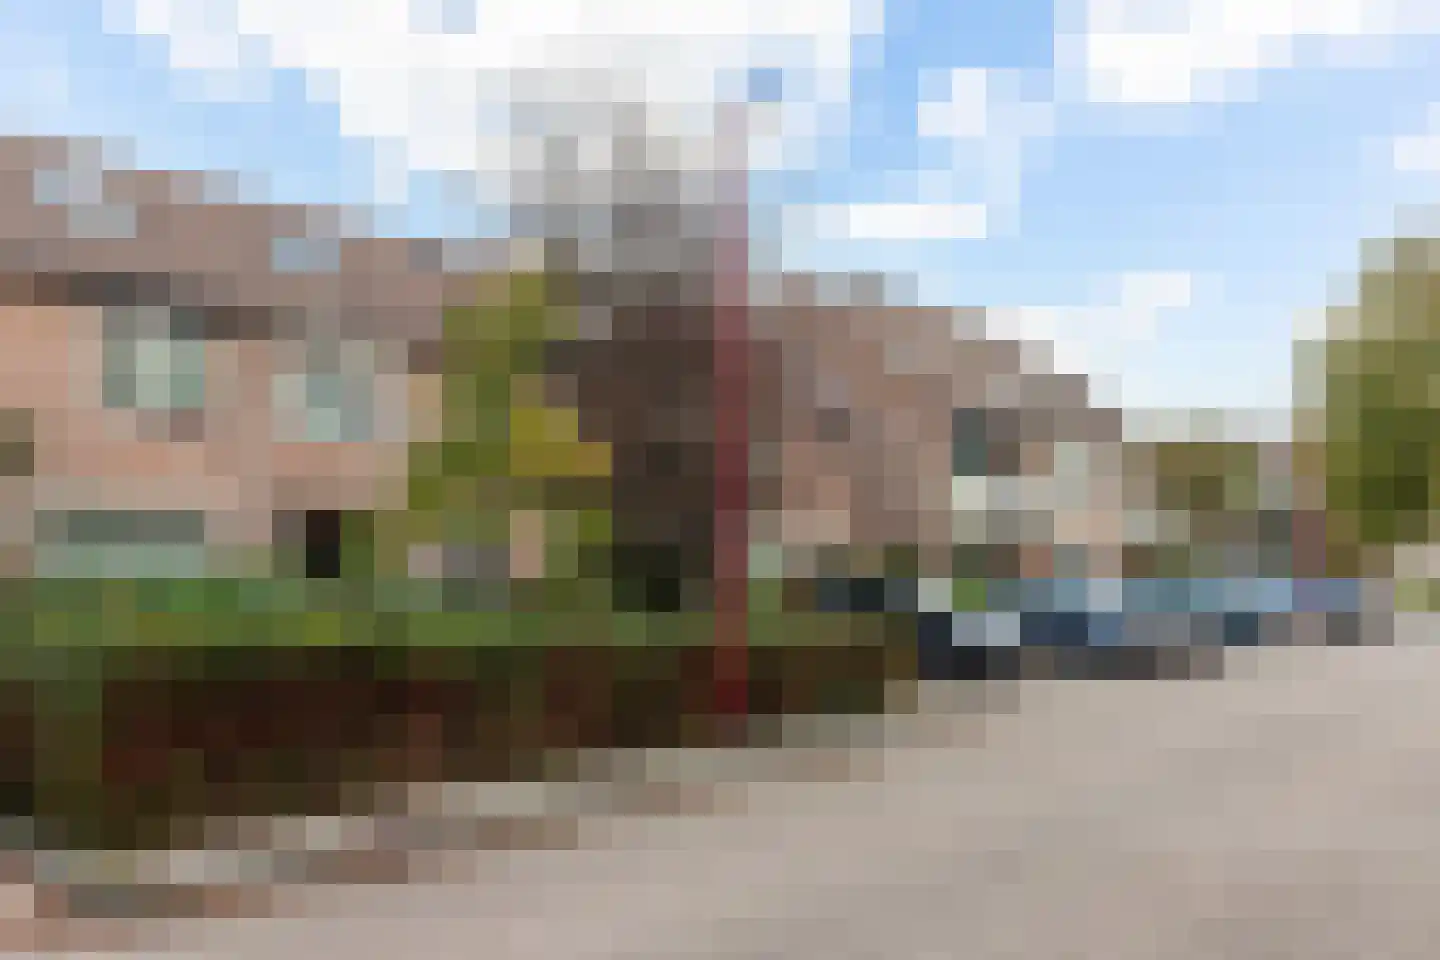
Makassarstraat 93
3531VM Utrecht
€ 650.000 k.k.
€ 6.500/m²
ASave as favorite- Living area
- 100 m²
- Land area
- 86 m²
- Bedrooms
- 3
-
- Sold
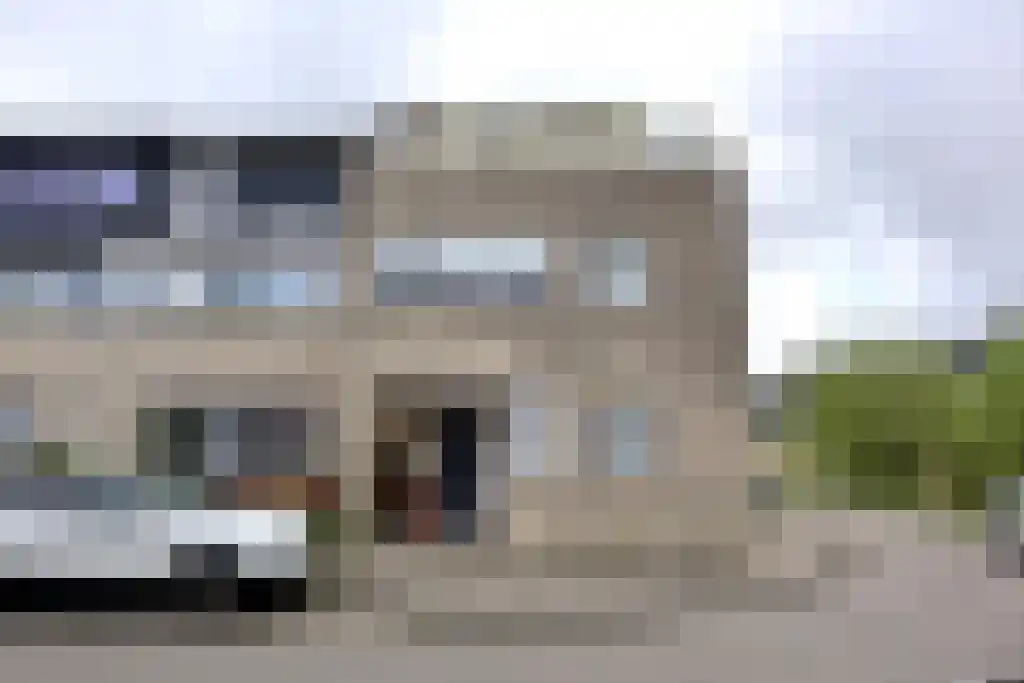
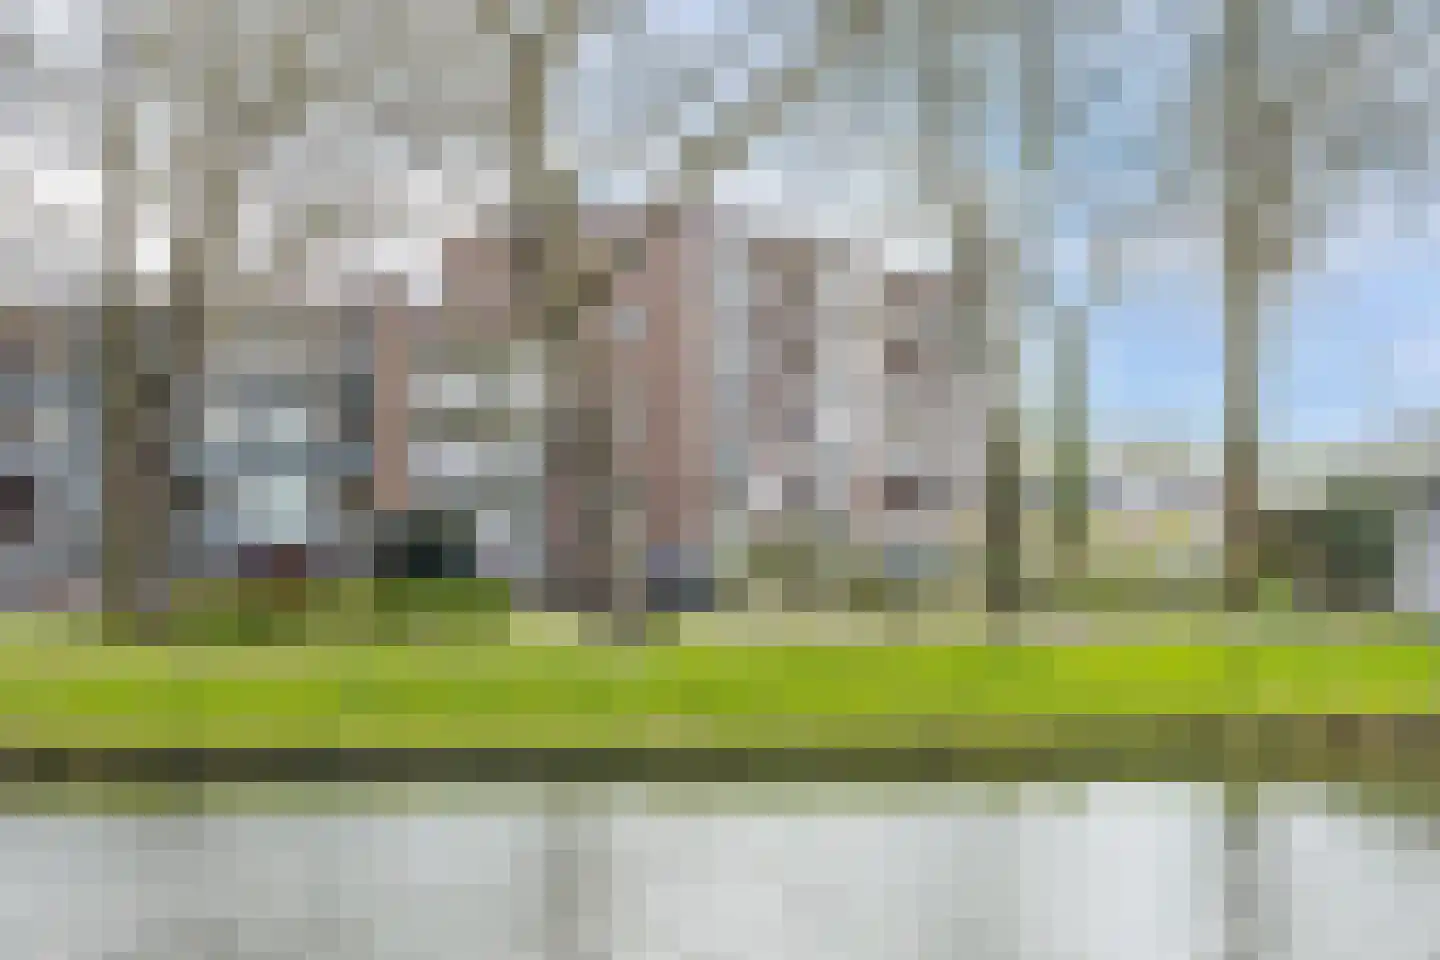
Vechtplantsoen 50 1
3554TE Utrecht
€ 375.000 k.k.
€ 5.208/m²
CSave as favorite- Living area
- 72 m²
- Land area
- —
- Bedrooms
- 2