Kleen Resorts Verkoop
In Capelle aan den IJssel staat Kleen Resorts Verkoop voor u klaar met expertise in de verkoop van recreatiewoningen. Wij zijn gespecialiseerd in het begeleiden van kopers op zoek naar een unieke woonervaring, met aandacht voor persoonlijke behoeften en kwaliteit. Onze focus ligt op transparantie, betrouwbare informatie en een rustige, persoonlijke benadering. Wij bieden verkoopdiensten aan met een duidelijke werkwijze en kennis van de...
Current housing stock
-
- Available
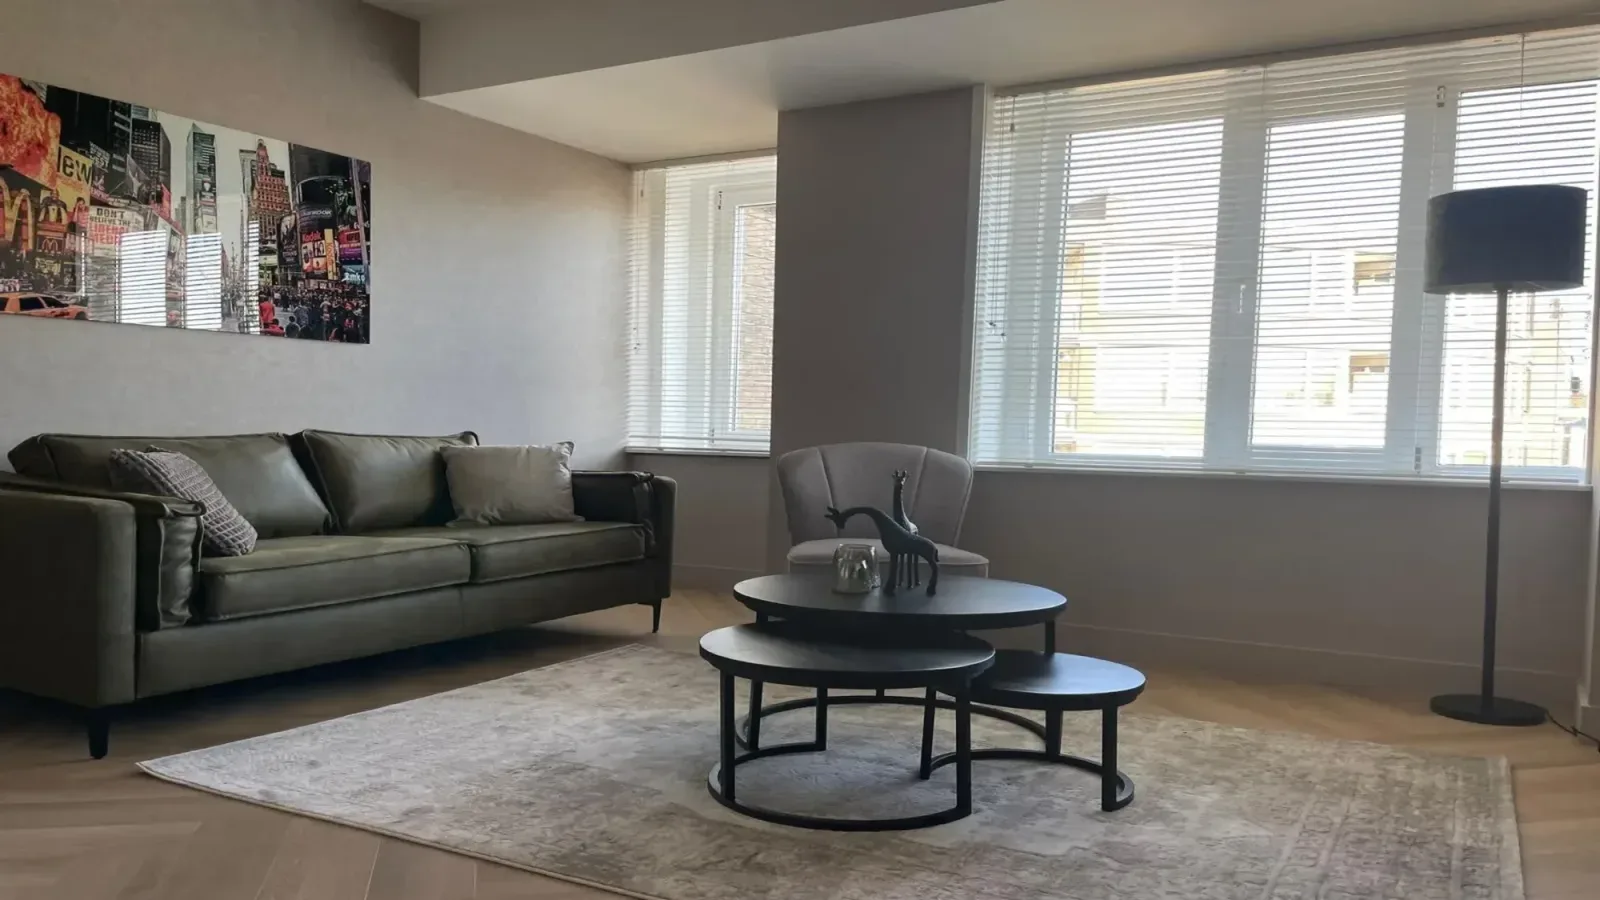
Tsjamkedykje 6 K70
8561HA Balk
€ 248.500 ,-
€ 3.550/m²
Save as favorite- Living area
- 70 m²
- Land area
- —
- Bedrooms
- 3