Dwars Makelaars Roermond B.V.
"Do you follow your heart? We'll take care of the rest!"

Dwars Makelaars Roermond B.V. has been a reliable partner in the housing market for 25 years. Since 2022 with our own office in Roermond, we support you with expertise and pleasure at every step. Whether it's about the sale, purchase, rental or letting of a property, we're here for you. Our team consisting of five experienced real estate agents ensures that you can focus on what is really important: your wishes and future. At Dwars Make...
Current housing stock
-

- Sold
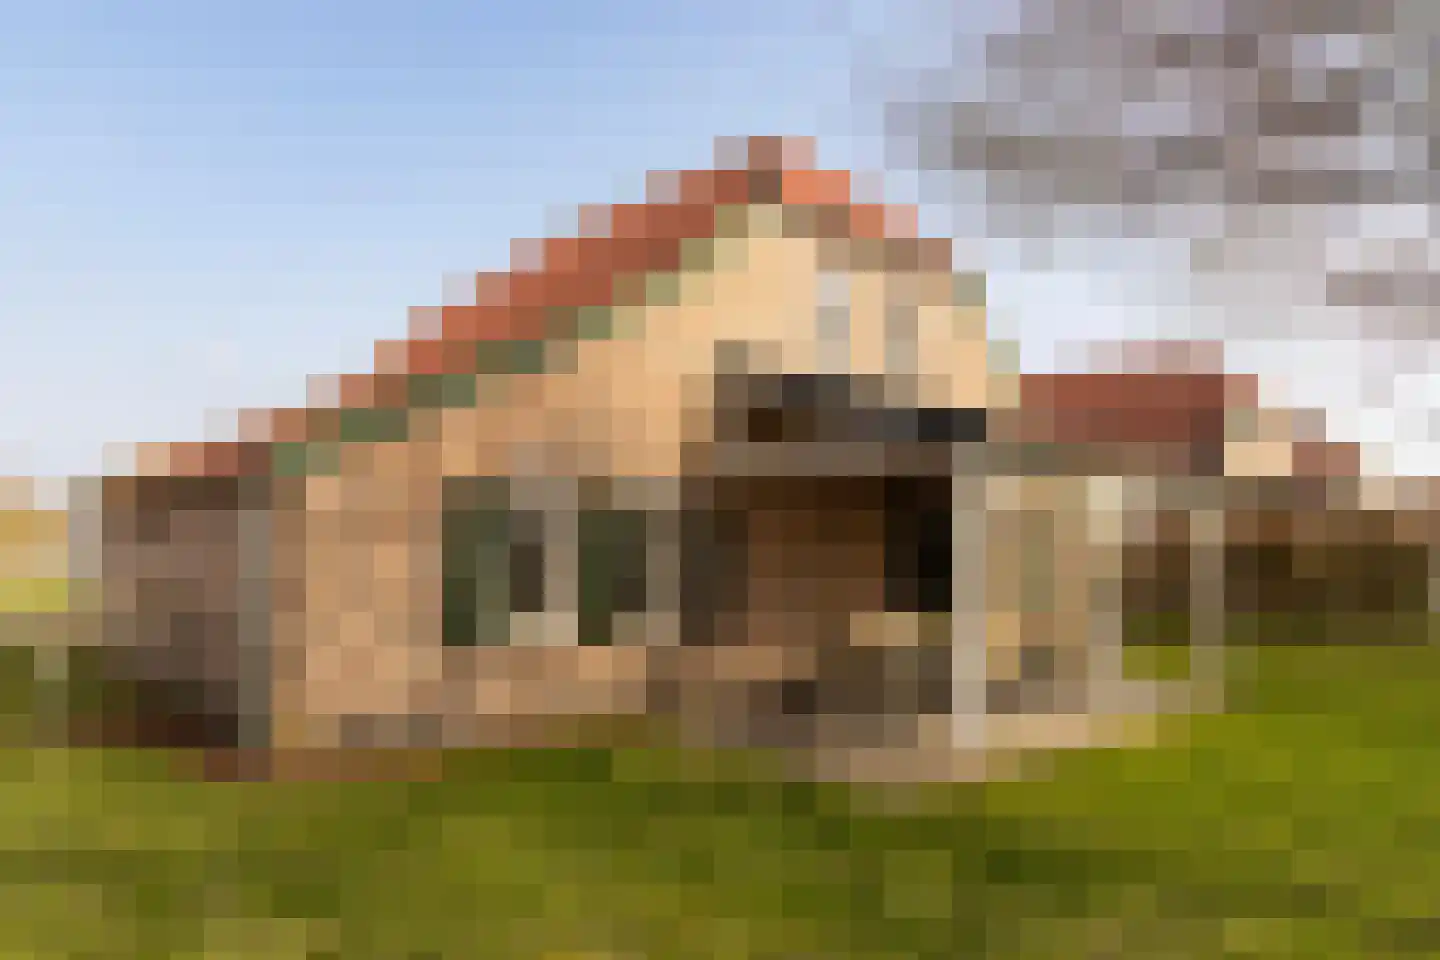
Staat 21
6031EL Nederweert
€ 699.000 k.k.
€ 4.660/m²
BSave as favorite- Living area
- 150 m²
- Land area
- 750 m²
- Bedrooms
- 4
-

- Sold
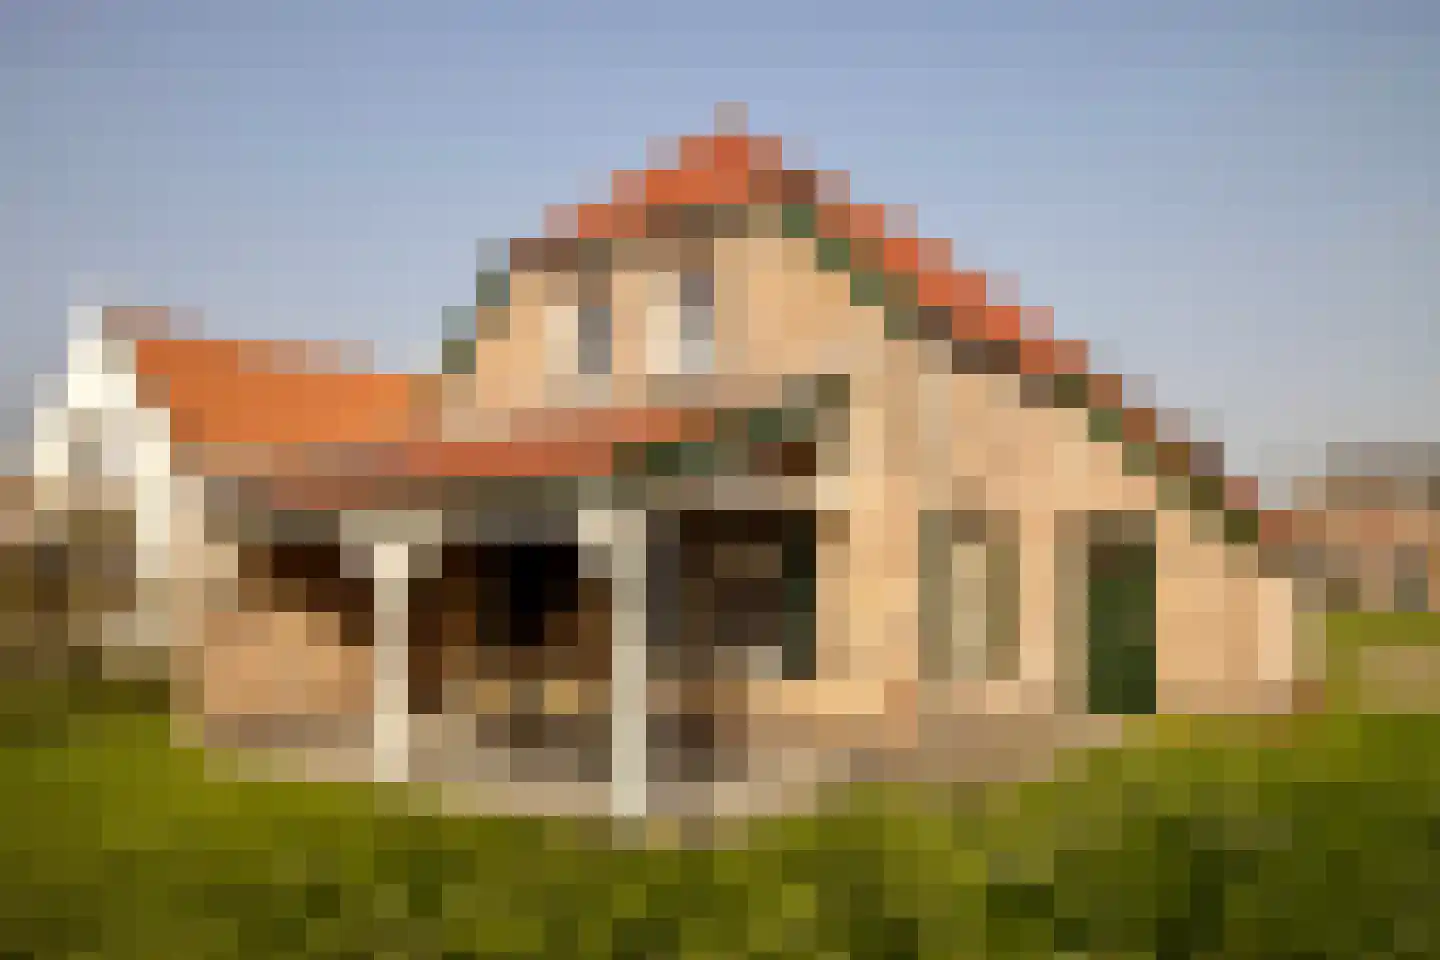
Ariënsstraat 11
5931HM Tegelen
€ 295.000 k.k.
€ 4.338/m²
FSave as favorite- Living area
- 68 m²
- Land area
- 158 m²
- Bedrooms
- 3
Reviews (1)
Review platforms
BronscoresTotal score
1 total reviews

Funda
1 reviews on Funda
-
Retersbekerweg 12
10Translated by AIContact excellent and pleasant and to the point. The agent took sufficient time. Actually, nothing went wrong.