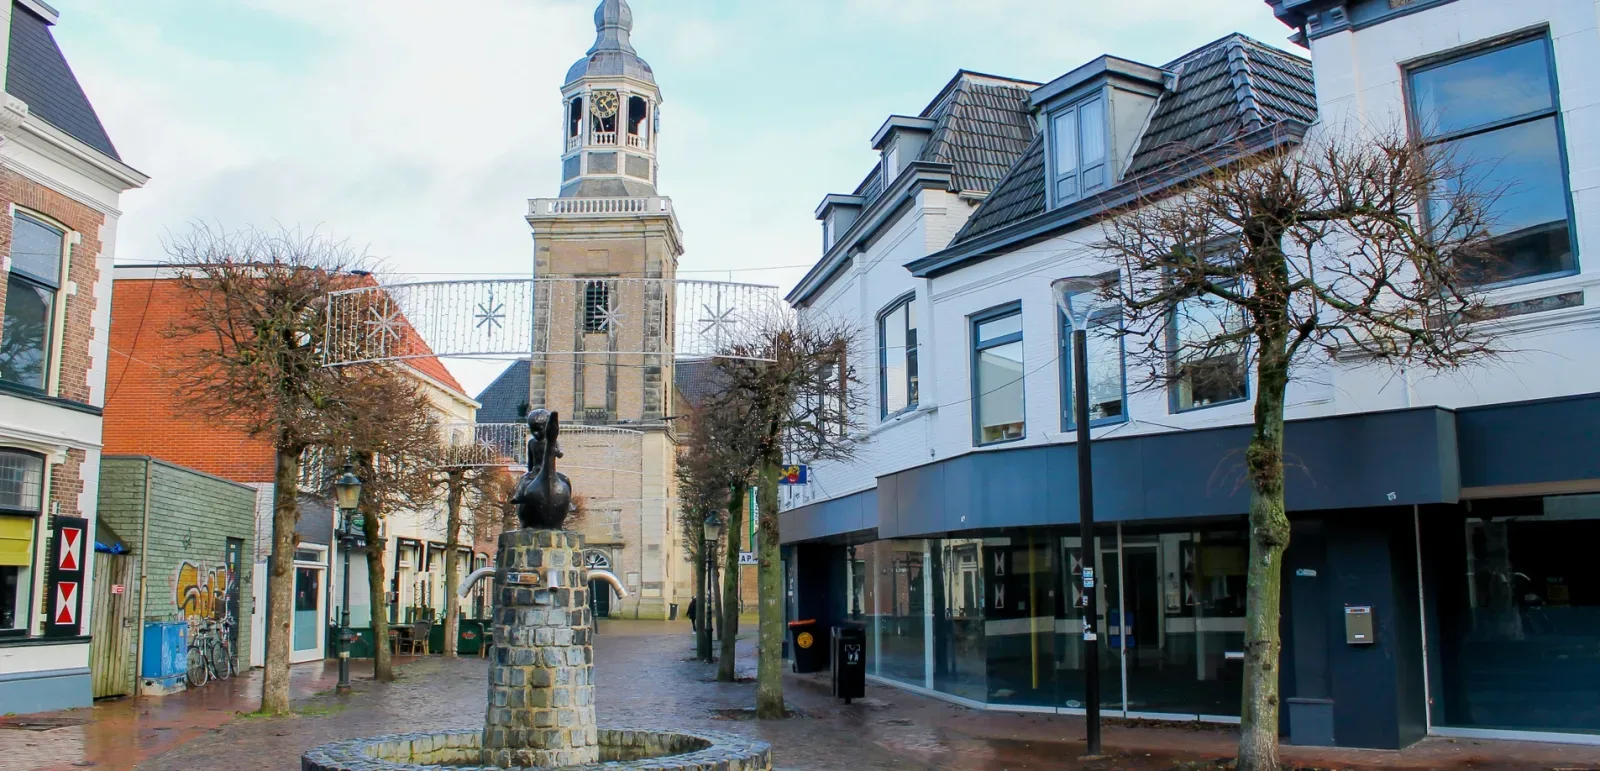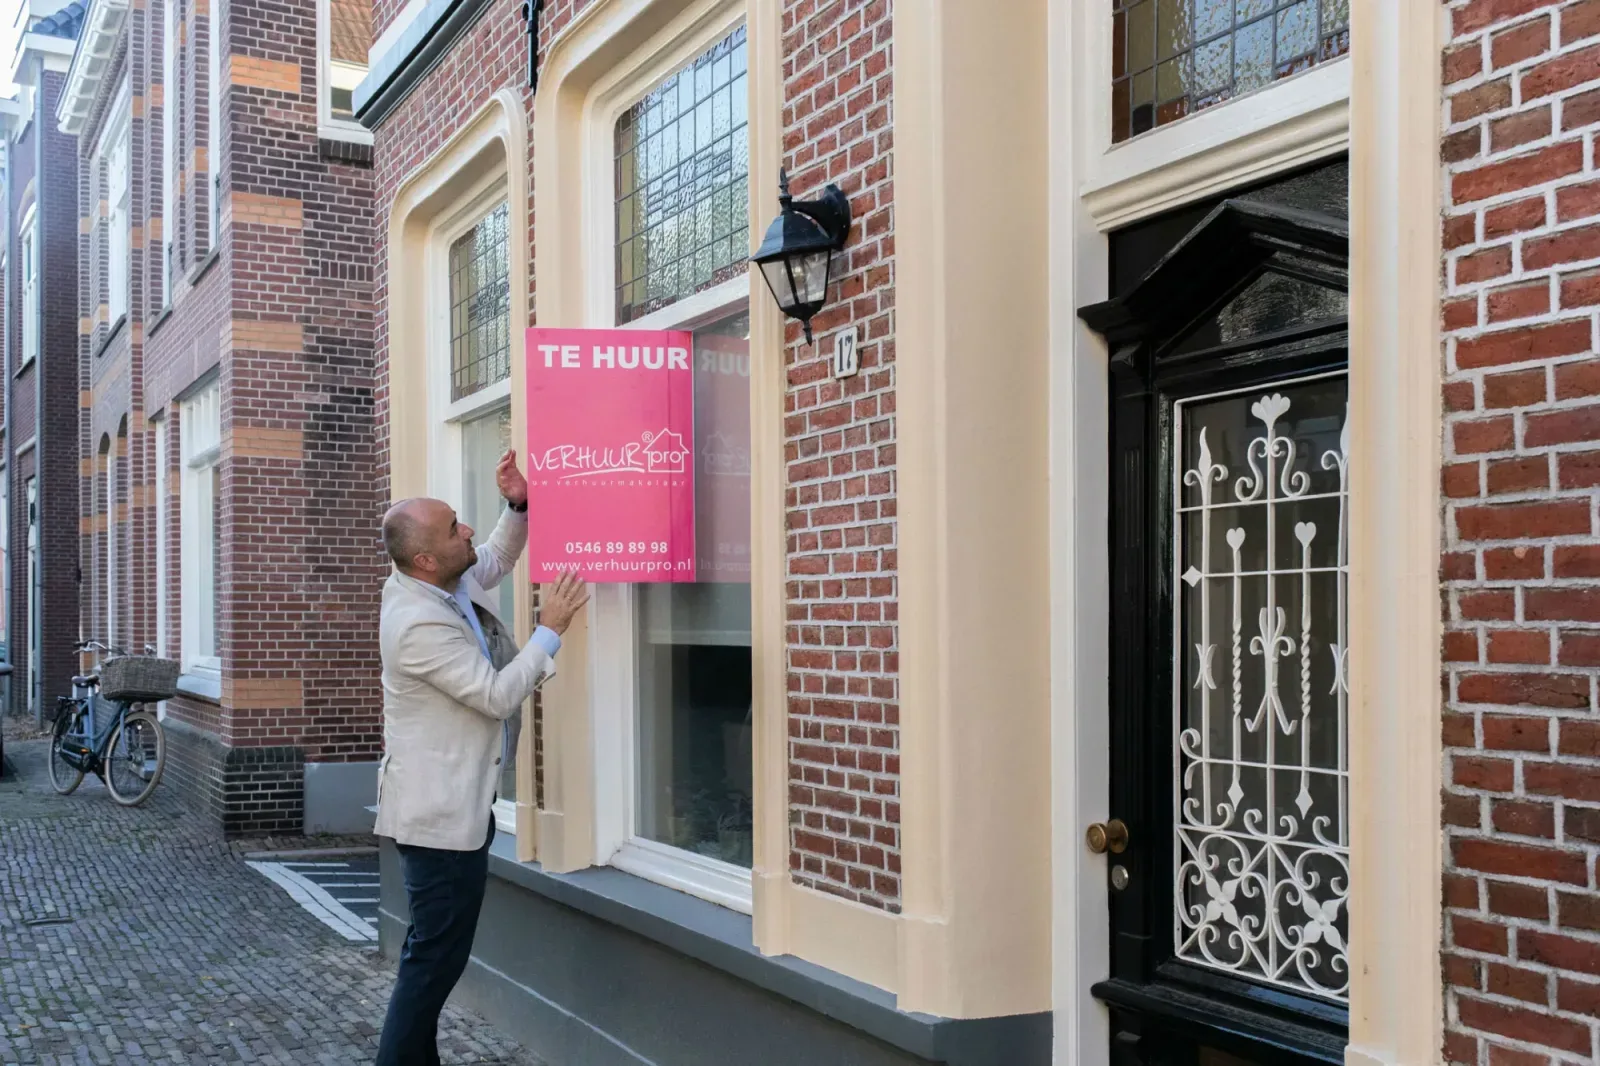
BijZonder Makelaars staat voor persoonlijk contact en oprecht advies in Almelo. Wij helpen u met vertrouwen en professionaliteit bij het kopen, verkopen of huren van uw woning. Onze benadering is gericht op de mens achter het dossier, zodat u altijd vertrouwd kunt zijn met de stappen die gegaan worden. Wij bieden dienstverlening in verkoop, aankoop, verhuur en aanhuur. Onze werkwijze is transparant en gericht op uw wensen, met expertise...
Current housing stock
-

- Available
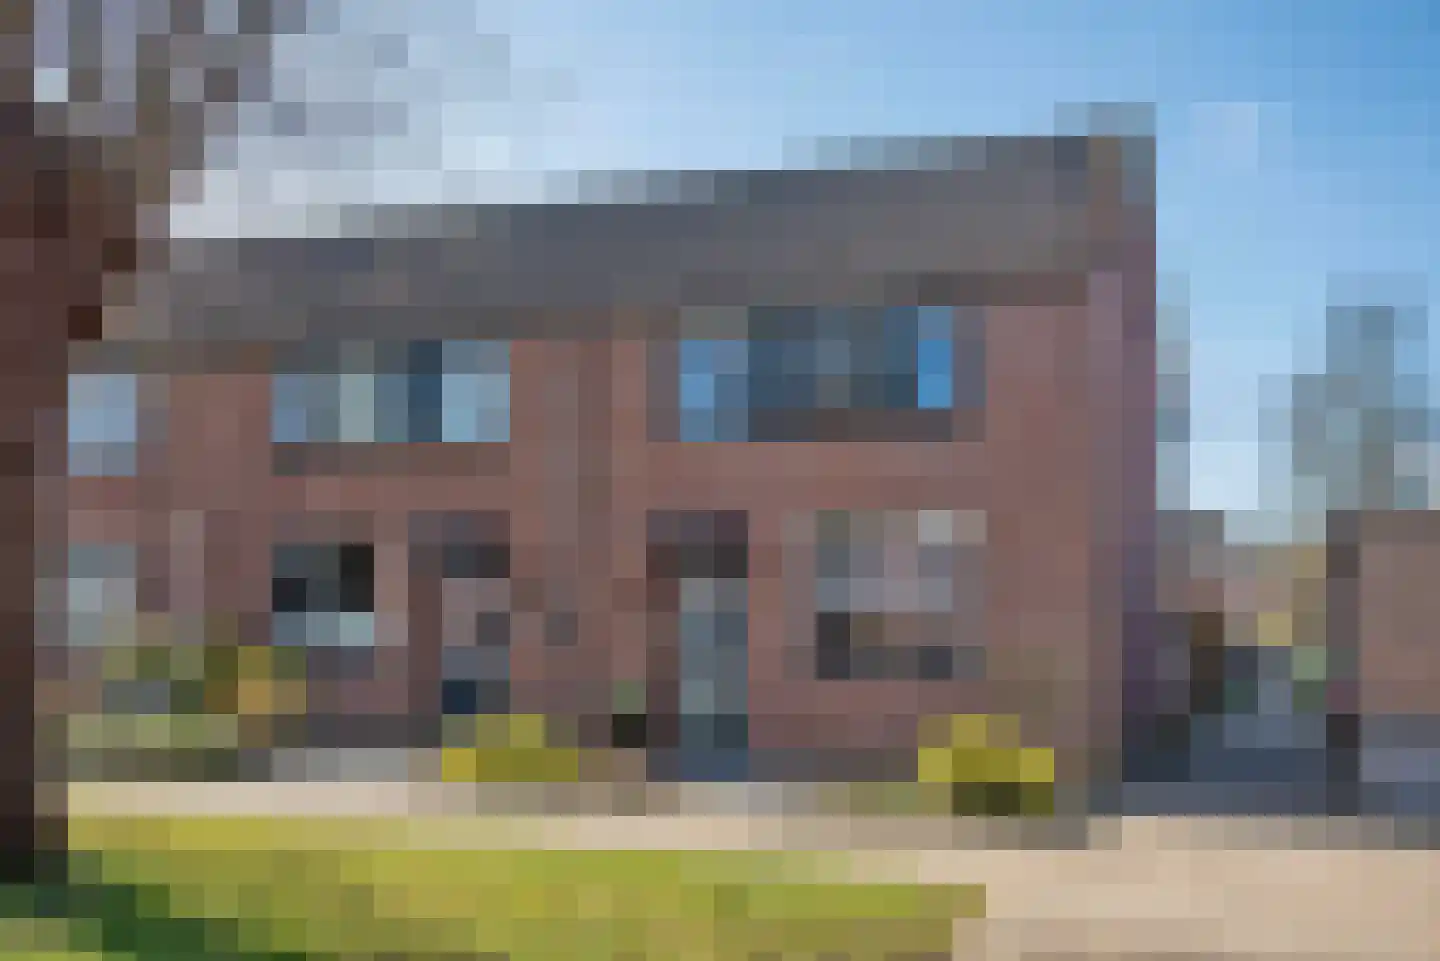
Rohofstraat 124
7604AK Almelo
€ 400.000 k.k.
Save as favorite- Living area
- 96 m²
- Land area
- 360 m²
- Bedrooms
- 3
-

- Sold
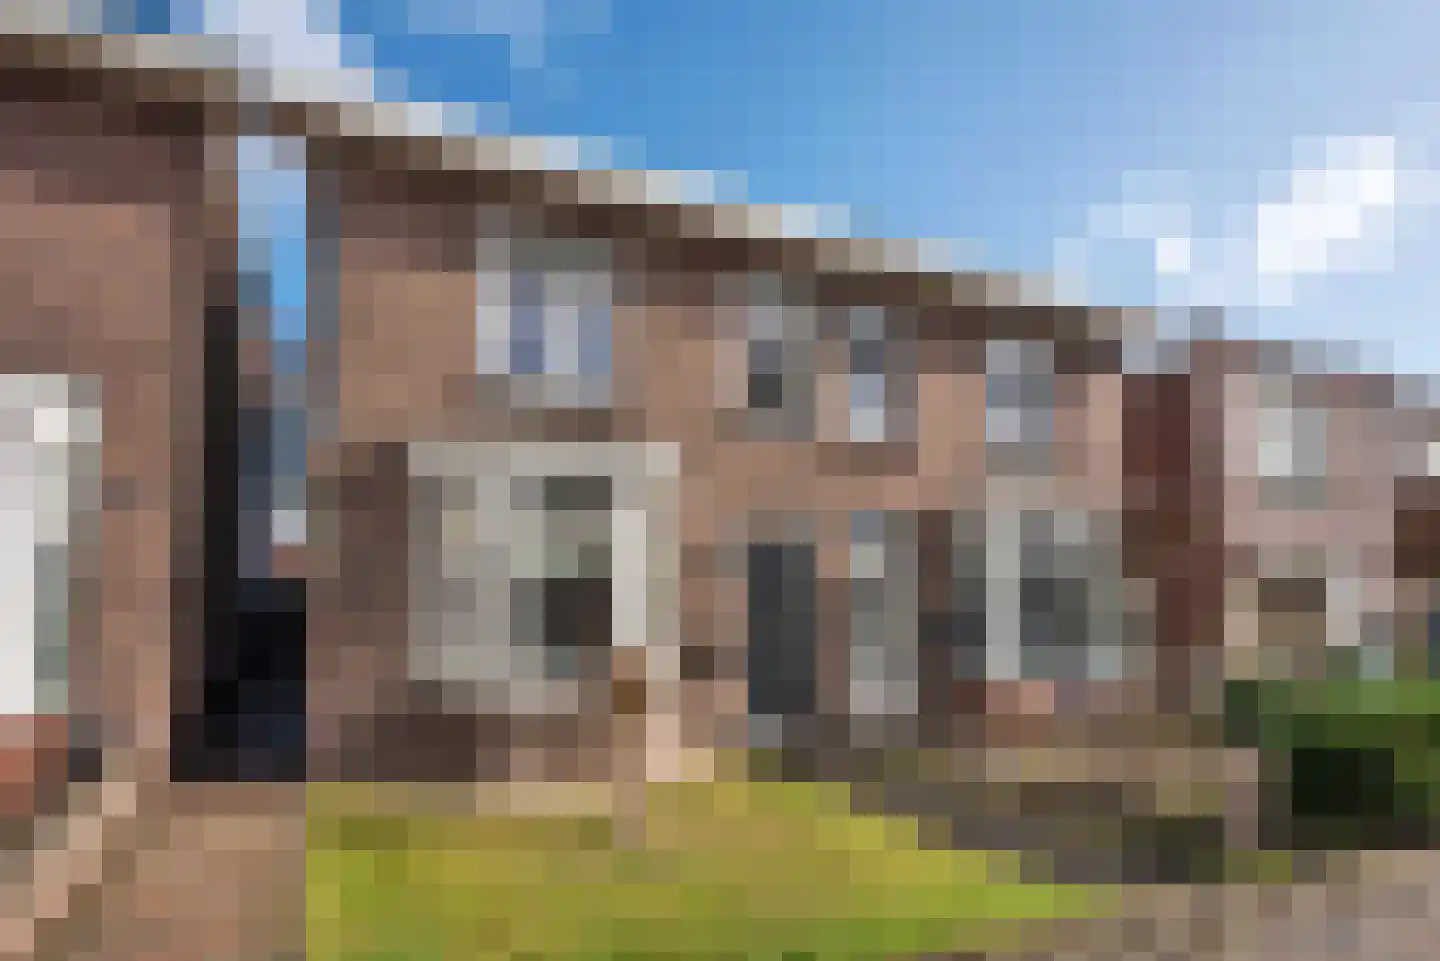
Mozartstraat 76
7604GS Almelo
€ 220.000 k.k.
€ 2.750/m²
DSave as favorite- Living area
- 80 m²
- Land area
- —
- Bedrooms
- 3
-
- Sold subject to confirmation
Springendalhoek 6
7546GT Enschede
€ 375.000 k.k.
€ 3.713/m²
CSave as favorite- Living area
- 101 m²
- Land area
- 139 m²
- Bedrooms
- 4
-
- Sold subject to confirmation
Rozenstraat 38
7601AP Almelo
€ 289.500 k.k.
€ 3.080/m²
CSave as favorite- Living area
- 94 m²
- Land area
- 220 m²
- Bedrooms
- 2
-

- Sold
Borg Piloursema 7
7608EX Almelo
€ 425.000 k.k.
€ 3.400/m²
CSave as favorite- Living area
- 125 m²
- Land area
- 332 m²
- Bedrooms
- 3
-

- Sold
De Delle 92
7609CJ Almelo
Price upon request
CSave as favorite- Living area
- 150 m²
- Land area
- —
- Bedrooms
- 3
Reviews (70)
Review platforms
BronscoresTotal score
70 total reviews

Funda
21 reviews on Funda

49 reviews on Google
-
Mozartstraat 76
10Mevr Zonder is een zeer vakbekwame dame die weet waar ze over praat. Een super bedrijf!! En een snelle afhandeling!
-
Moniquevanpijkeren@gmail.com Afcacbs1
10Super leuke en behulpzame makelaar, ze is nu zelfs mijn koffiemachine aan het installeren😅 …
-
Henkjan Lucas
2Niet heen gaan deze vrouw speelt een spelletje met kopers ze zegt dat wij beter een elke keer een hoger bod moesten doen Terwel ons bod goed genoeg was volgens een andere makelaar was ons bod al veel te veel
-
Hofkampstraat 159
10Correcte en klantgerichte informatie,begeleiding en advies. Tussentijdse updates. Erg prettige samenwerking!
-
Borg Ewsum 92
8Mascha is een prettige, enthousiaste makelaar, die aandacht heeft voor details en ook het tekenen van de koopovereenkomst een leuke gebeurtenis laat worden. Zij is erg attent en houdt je goed op de hoogte van de voortgang.
-
Bachlaan 5
9Ze hielp ons waar ze kon met heel veel geduld. Ze zorgde dat iedereen zich op zijn of haar gemak voelde.
-
Rabea Snijders
10Translated by AIMascha is knowledgeable, professional, sincere and empathetic. She takes ample time for the buyer and seller. The approach is very warm and personal. The video and brochures look very nice. Mascha really makes it ExtraOrdinary.
-
Havezatestraat 19
10Translated by AIMascha is knowledgeable, professional, honest and empathetic. She takes ample time for the buyer and seller. The approach is very warm and personal. The video and brochures look very nice. Mascha really makes it special.
-
Mona
10Translated by AII had the pleasure of meeting Mascha during a viewing. On behalf of her clients, she warmly welcomed my mother and me in a pleasant atmosphere. The viewing itself was very nice and professional. This is especially noteworthy given that house viewings can be quite stressful at times. Mascha clearly possesses knowledge and thought along with our wishes and possibilities. Unfortunately, my father could not attend; to this, Mascha mentioned that we could plan a second viewing. I found this extremely pleasant in addition to the nice rapport. During my search, I have yet to encounter an agent who is as considerate and people-oriented as she is. It felt very pleasant having this personal contact, thank you for this.
-
Getfertplein 114
10Translated by AIVery nice real estate agent with knowledge and who thinks well about you! Photography and styling done to perfection.
-
Willem de Clercqstraat 69
10Translated by AIVery good experiences and excellent personal contact. Thinks along and gives good advice. A knowledgeable agent who knows the business inside out. Sympathetic and customer-friendly, pleasant and nice person. For me a very good choice. Top!
-
Zweersstraat 43
10Translated by AIContact with the real estate agent went excellently, 'Particularly' pleasant. It was nice to speak from woman to woman. Still just a little different, great! The knowledge of the situation in the relevant residential area was very good!
-
Vincent Veldman
10 -
richard sonder
2Translated by AIOur experience with Mascha Zonder has been particularly bad. She provided us with no information whatsoever about the bidding process nor offered any options, although the rules of conduct of VastgoedPro (a qualitatively inferior variant of the NVM) prescribe this. She even left our emails with questions regarding this unanswered. Because a bid had already been made before the house was listed on Funda, she tried to motivate us to accept that first bid without listing the house on Funda. Later we received a much higher offer! When we asked if there were any more interested parties, both Mascha and her colleague denied this, while indeed a further viewing had been requested. Both admitted this afterwards without explanation or apology. VastgoedPro took no action when we reported this. Mascha is therefore a member of VastgoedPro without adhering to their rules. When we withdrew the assignment, Mascha refused to remove the property from Funda (we had to involve Funda for this!) and still has not returned our keys and building plans, preventing us from fulfilling the start-up costs. Mascha Zonder exploits the inexperience of sellers. Under the guise of 'personal' (and even 'sincere') and by having potential buyers write their motivations along with their bids, she tries to expedite the sale so that she can benefit as quickly as possible. A VastgoedPro real estate agent is therefore not a guarantee of quality. Mascha Zonder is certainly not recommended. (This is only a short listing of our negative experiences with her.)
-
Ankrot 63
8Translated by AIEverything was or is perfectly arranged! Contacts went entirely as expected. All papers and other matters were always perfectly on time. Viewings went smoothly.
-
Aalderinkshof 92
10Translated by AIThe contact was very personal and felt familiar. We experienced the sale as very pleasant and give BijZonder Makelaars a 10 with a feather!
-
Ootmarsumsestraat 376
10Translated by AIContact with the real estate agent went well (easily accessible). Short lines and clear what the expectations of the seller and buyer are. The property was sold quickly as expected, and I personally had little work with it.
-
Ramses Sweys
10Translated by AIMascha helped us well with the purchase of the new house. She sold the house with passion and enthusiasm. Mascha was also reachable and helpful outside office hours.
-
Posthuislaan 19
10Translated by AIVery satisfied with Bijzonder Makelaars. Mascha is an engaged real estate agent with a lot of experience and enthusiasm. Thanks to her personal approach, I look back on a very pleasant collaboration with a successful sale as the end result.
-
Anniek Groote beverborg
10Translated by AIWe've had a lot of contact with Macha recently, and we found this to be a very pleasant collaboration when buying a house. She takes the time for her clients and there is always room to ask questions; you can always reach her, even outside your appointment.