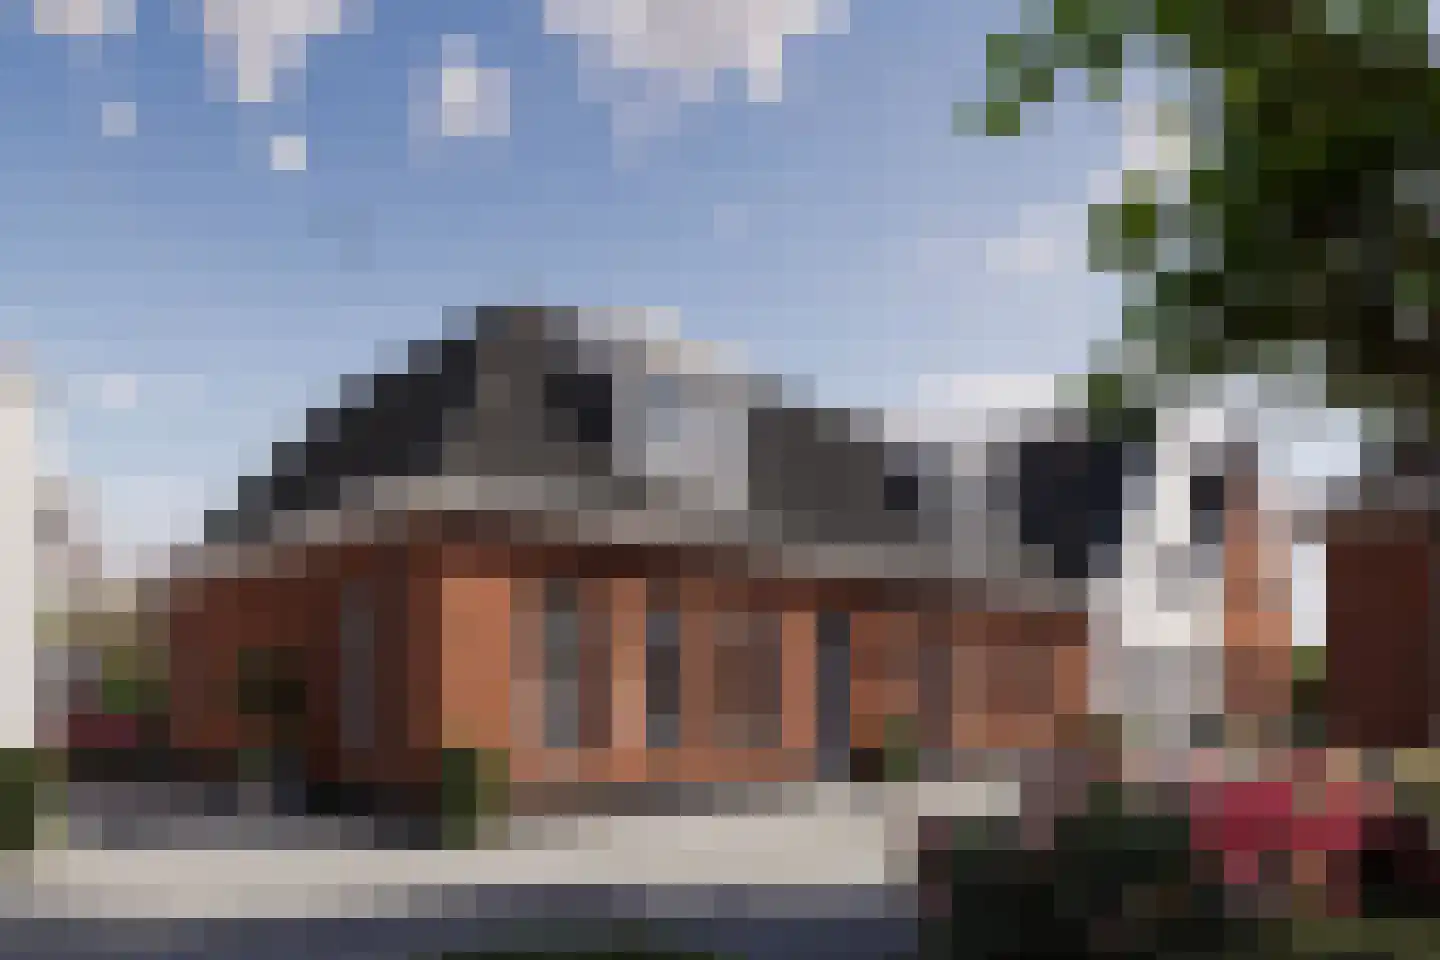
Houses sold in Baarn

View 287 sold houses in Baarn

Connected to: Vastgoed Nederland NVM Makelaars

On this page you will find recently sold homes in Baarn. Use this overview to better estimate selling prices, popular neighborhoods, and the local housing supply before you choose a real estate agent. Also view the current housing supply with 431 houses in Baarn.

Selection

Search and filter homes

Set your preferences and discover homes that suit you.

Total supply 241.421
Filters

Set price, area and other characteristics. Adjust a filter or click on Show homes. Location changes directly above.

Reset filters

You search for

  • Place Baarn
  • Status Sold

Huis verkopen in Baarn? Vergelijk verkoopmakelaars

Bekijk recente verkopen en ontvang gratis offertes van lokale verkoopmakelaars in Baarn.

Free request a quote

  • Quotes in Baarn
  • Non-binding
  • Personal
  • Gratis tarieven vergelijken

Recent verkocht in Baarn? Lees de verkoopgerichte gids huis verkopen in Baarn, vergelijk verkoopmakelaars in Baarn of bekijk de beste verkoopmakelaars in Baarn voor referentie bij jouw keuze.

Vergelijk meerdere offertes

Makelaars maken scherpere voorstellen als ze weten dat je vergelijkt — vraag offertes aan voor verkoop of aankoop.

Frequently asked questions about sold homes in Baarn

Short answers about housing prices, sold homes and comparing real estate agents in Baarn.

Residential and neighborhood statistics in Baarn

View current location data on residents, WOZ development, housing stock, energy consumption, business activity and safety in Baarn. In 2026 were there 25.442 residents. The average WOZ value in 2025 is EUR 508.000.

These figures help to better assess and compare the housing stock in Baarn with recent sold homes. Orient yourself then on suitable top real estate agents in Baarn for sales advice in this region.

Residents

25.442

Last year: 2026

Average WOZ

EUR 508.000

Last year: 2025

Average income per person.

EUR 41.200

Source: AllNumbers

Crimes (current year)

989

Total registered

Demographics and WOZ development

Inhabitants per year

Inhabitants per year in Baarn
Year Residents
2022 24.876
2023 25.008
2024 25.065
2025 25.184
2026 25.442

Annual WOZ value

WOZ value per year in Baarn
Year Average WOZ
2021 EUR 373.000
2022 EUR 410.000
2023 EUR 470.000
2024 EUR 490.000
2025 EUR 508.000

Composition of residents

Age build-up

65+: 6.429 0-15: 3.901 15-25: 2.412 25-45: 5.451 45-65: 6.991

Education level

Hoger

40

Praktisch

25

Middelbaar

35

Origin of residents (2025)

Europa

1.815

Nederland

19.672

Buiten Europa

3.697

Housing stock and construction periods

Types of homes

Hoekwoningen 1.766
Appartementen 4.289
Tussenwoningen 3.334
Vrijstaande woningen 1.174
Twee-onder-één-kap woningen 1.617

Construction period of buildings

Voor 1700 17
1700 tot 1900 409
1900 tot 1925 1.362
1925 tot 1950 1.084
1950 tot 1970 2.883
1970 tot 1980 1.331
1980 tot 1990 1.026
1990 tot 2000 603
2000 tot 2010 295
2010 tot 2020 259
2020 en later 246

Energy and sustainability

Energy label distribution

Label C

3.076

Label A

2.058

Label B

1.613

Label G

1.597

Label E

1.229

Label D

1.186

Label F

934

Label A+

292

Label A+++

246

Label A++

241

Label A++++

15

Label A+++++

2

Average energy consumption per year

Average energy consumption per year in Baarn
Year Gas (m3) Electricity (kWh)
2020 1.370 2.850
2021 1.560 2.900
2022 1.210 2.720
2023 1.030 2.560
2024 990 2.610

Consumption per house type

Hoekwoning

Gas: 1.060 • Electricity: 2.630

Huurwoning

Gas: 760 • Electricity: 1.880

Koopwoning

Gas: 1.190 • Electricity: 2.970

Appartement

Gas: 680 • Electricity: 1.780

Tussenwoning

Gas: 920 • Electricity: 2.350

Vrijstaande woning

Gas: 1.950 • Electricity: 4.460

Twee-onder-één-kap woning

Gas: 1.370 • Electricity: 3.300

Business activity in Baarn (2025)

Handel en HORECA 555
Nijverheid en energie 470
Zakelijke dienstverlening 1.415
Overheid, onderwijs en zorg 835
Landbouw, bosbouw en visserij 25
Vervoer, informatie en communicatie 335
Financiele diensten en onroerendgoed 245
Cultuur, recreatie en overige diensten 470

Total number of company establishments: 4.350

Recent crime statistics

Recent crime statistics in Baarn
Period Crimes
jan 2025 56
jan 2026 92
jul 2025 101
jun 2025 74
mei 2025 79
mrt 2025 81
nov 2024 83
nov 2025 105
okt 2024 71
okt 2025 90
sep 2024 66
sep 2025 101

These figures give an indicative picture of safety trends in the living environment of Baarn.

Frequently asked questions about living in Baarn

Short answers based on current local statistics, handy for a quick comparison of the living environment.

Hoeveel inwoners heeft Baarn?

Baarn telt in 2026 ongeveer 25.442 inwoners.

Wat is de gemiddelde WOZ-waarde in Baarn?

De gemiddelde WOZ-waarde in Baarn is in 2025 circa € 508.000.

Wat is het gemiddelde inkomen per inwoner in Baarn?

Het gemiddelde inkomen per inwoner in Baarn ligt rond € 41.200 per jaar.

Hoe veilig is wonen in Baarn?

Voor het huidige jaar gaat het om ongeveer 989 geregistreerde misdrijven. Gebruik deze cijfers als indicatie en vergelijk trends per periode.

Welke woningtypen komen het meest voor in Baarn?

In Baarn komt vooral "Appartementen" veel voor, met ongeveer 4.289 woningen.

Gratis vrijblijvende offertes ontvangen

Vergelijk meerdere makelaars en kies de beste match.