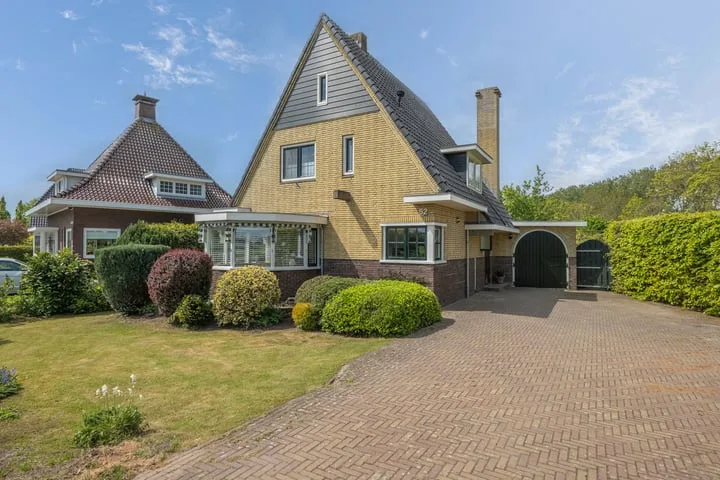
- Sold
De Drie Rozen 22
9781JW Bedum
€ 475.000 k.k.
€ 2.794/m²
- Living area
- 170 m²
- Land area
- 746 m²
- Bedrooms
- 4
View 76 sold houses in Bedum
Type to search. Use arrow down and arrow up to navigate through results and press Enter to open.
Hidden search suggestions.
Compare sold homes in Bedum or view the current offering in this location directly.
On this page you will find recently sold homes in Bedum. Use this overview to better estimate selling prices, popular neighborhoods, and the local housing supply before you choose a real estate agent. Also view the current housing supply with 102 houses in Bedum.
9781JW Bedum
€ 475.000 k.k.
€ 2.794/m²
9781MK Bedum
€ 287.500 k.k.
€ 2.686/m²
9781LE Bedum
€ 255.000 k.k.
€ 2.741/m²
9781CD Bedum
€ 285.000 k.k.
€ 3.433/m²
9781XJ Bedum
€ 395.000 k.k.
€ 3.291/m²
9781LH Bedum
€ 245.000 k.k.
€ 2.634/m²
9781BX Bedum
€ 325.000 k.k.
€ 2.826/m²
9781XA Bedum
€ 325.000 k.k.
€ 3.385/m²
9781LN Bedum
€ 350.000 k.k.
€ 2.464/m²
9781ZJ Bedum
€ 435.000 k.k.
€ 3.222/m²
9781XH Bedum
€ 325.000 k.k.
€ 3.611/m²
9781GN Bedum
€ 680.000 k.k.
€ 2.281/m²
9781KJ Bedum
€ 295.000 k.k.
€ 2.286/m²
9781ZJ Bedum
€ 339.000 k.k.
€ 4.581/m²
9781RE Bedum
€ 449.500 k.k.
€ 3.187/m²
9781VP Bedum
€ 349.000 k.k.
€ 3.525/m²
9781MJ Bedum
€ 298.000 k.k.
€ 2.759/m²
9781CW Bedum
€ 500.000 k.k.
€ 3.649/m²
9781XV Bedum
€ 425.000 k.k.
€ 3.171/m²
9781HK Bedum
€ 195.000 k.k.
€ 2.378/m²
Bekijk recente verkopen en ontvang gratis offertes van lokale verkoopmakelaars in Bedum.
Zelf je woning verkopen in Bedum? Vergelijk verkoopmakelaars in Bedum of bekijk de beste verkoopmakelaars in Bedum als referentie bij jouw keuze.
Makelaars maken scherpere voorstellen als ze weten dat je vergelijkt — vraag offertes aan voor verkoop of aankoop.
Short answers about housing prices, sold homes and comparing real estate agents in Bedum.
The costs of a real estate agent in Bedum vary per office, property type and sales approach. Therefore, compare multiple quotes and also look at the real estate agents in Bedum to better compare rates, presentation and local experience.
On this page we currently show 76 sold houses in Bedum from our selection. This helps you to better assess recent transactions and the local housing market.
Houses sold in Bedum give insight into asking prices, house types and neighborhoods where recent transactions have taken place. Compare this also with the current housing stock in Bedum to better understand the market.
You can use sold homes as a first market indication, but a local real estate agent can better take into account finishing, location, maintenance and current demand in Bedum.
Vergelijk makelaars in Bedum op lokale verkoopervaring, reviews, verwachte opbrengst, courtage en marketingaanpak. Bekijk verkoopmakelaars in Bedum of de top 10 makelaars in Bedum om snel sterke kantoren te ontdekken.
View current location data on residents, WOZ development, housing stock, energy consumption, business activity and safety in Bedum. In 2025 were there 8.465 residents. The average WOZ value in 2025 is EUR 315.149.
These figures help to better assess and compare the housing stock in Bedum with recent sold homes. Orient yourself then on suitable top real estate agents in Bedum for sales advice in this region.
Residents
8.465
Last year: 2025
Average WOZ
EUR 315.149
Last year: 2025
Average income per person.
EUR 28.754
Source: AllNumbers
Crimes (current year)
165
Total registered
| Year | Residents |
|---|---|
| 2021 | 8.373 |
| 2022 | 8.395 |
| 2023 | 8.450 |
| 2024 | 8.435 |
| 2025 | 8.465 |
| Year | Average WOZ |
|---|---|
| 2021 | EUR 209.029 |
| 2022 | EUR 232.519 |
| 2023 | EUR 279.243 |
| 2024 | EUR 290.246 |
| 2025 | EUR 315.149 |
Hoger
1.320
Praktisch
1.570
Middelbaar
3.020
Europa
320
Nederland
7.565
Buiten Europa
600
Label A
1.052
Label C
982
Label B
766
Label G
401
Label D
331
Label F
144
Label A+++
135
Label A+
125
Label E
103
Label A++
58
Label A++++
21
Label A+++++
0
| Year | Gas (m3) | Electricity (kWh) |
|---|---|---|
| 2020 | 1.331 | 2.498 |
| 2021 | 1.485 | 2.573 |
| 2022 | 1.114 | 2.395 |
| 2023 | 923 | 2.333 |
| 2024 | 884 | 2.444 |
Hoekwoning
Gas: 900 • Electricity: 2.213
Huurwoning
Gas: 771 • Electricity: 1.814
Koopwoning
Gas: 1.012 • Electricity: 2.597
Appartement
Gas: 510 • Electricity: 1.302
Tussenwoning
Gas: 839 • Electricity: 2.187
Vrijstaande woning
Gas: 1.185 • Electricity: 2.970
Twee-onder-één-kap woning
Gas: 983 • Electricity: 2.473
Total number of company establishments: 775
| Period | Crimes |
|---|---|
| jan 2025 | 17 |
| jan 2026 | 15 |
| jul 2025 | 14 |
| jun 2025 | 16 |
| mei 2025 | 12 |
| mrt 2025 | 9 |
| nov 2024 | 12 |
| nov 2025 | 13 |
| okt 2024 | 12 |
| okt 2025 | 8 |
| sep 2024 | 10 |
| sep 2025 | 21 |
These figures give an indicative picture of safety trends in the living environment of Bedum.
Short answers based on current local statistics, handy for a quick comparison of the living environment.
Bedum telt in 2025 ongeveer 8.465 inwoners.
De gemiddelde WOZ-waarde in Bedum is in 2025 circa € 315.149.
Het gemiddelde inkomen per inwoner in Bedum ligt rond € 28.754 per jaar.
Voor het huidige jaar gaat het om ongeveer 165 geregistreerde misdrijven. Gebruik deze cijfers als indicatie en vergelijk trends per periode.
In Bedum komt vooral "Tussenwoningen" veel voor, met ongeveer 1.037 woningen.