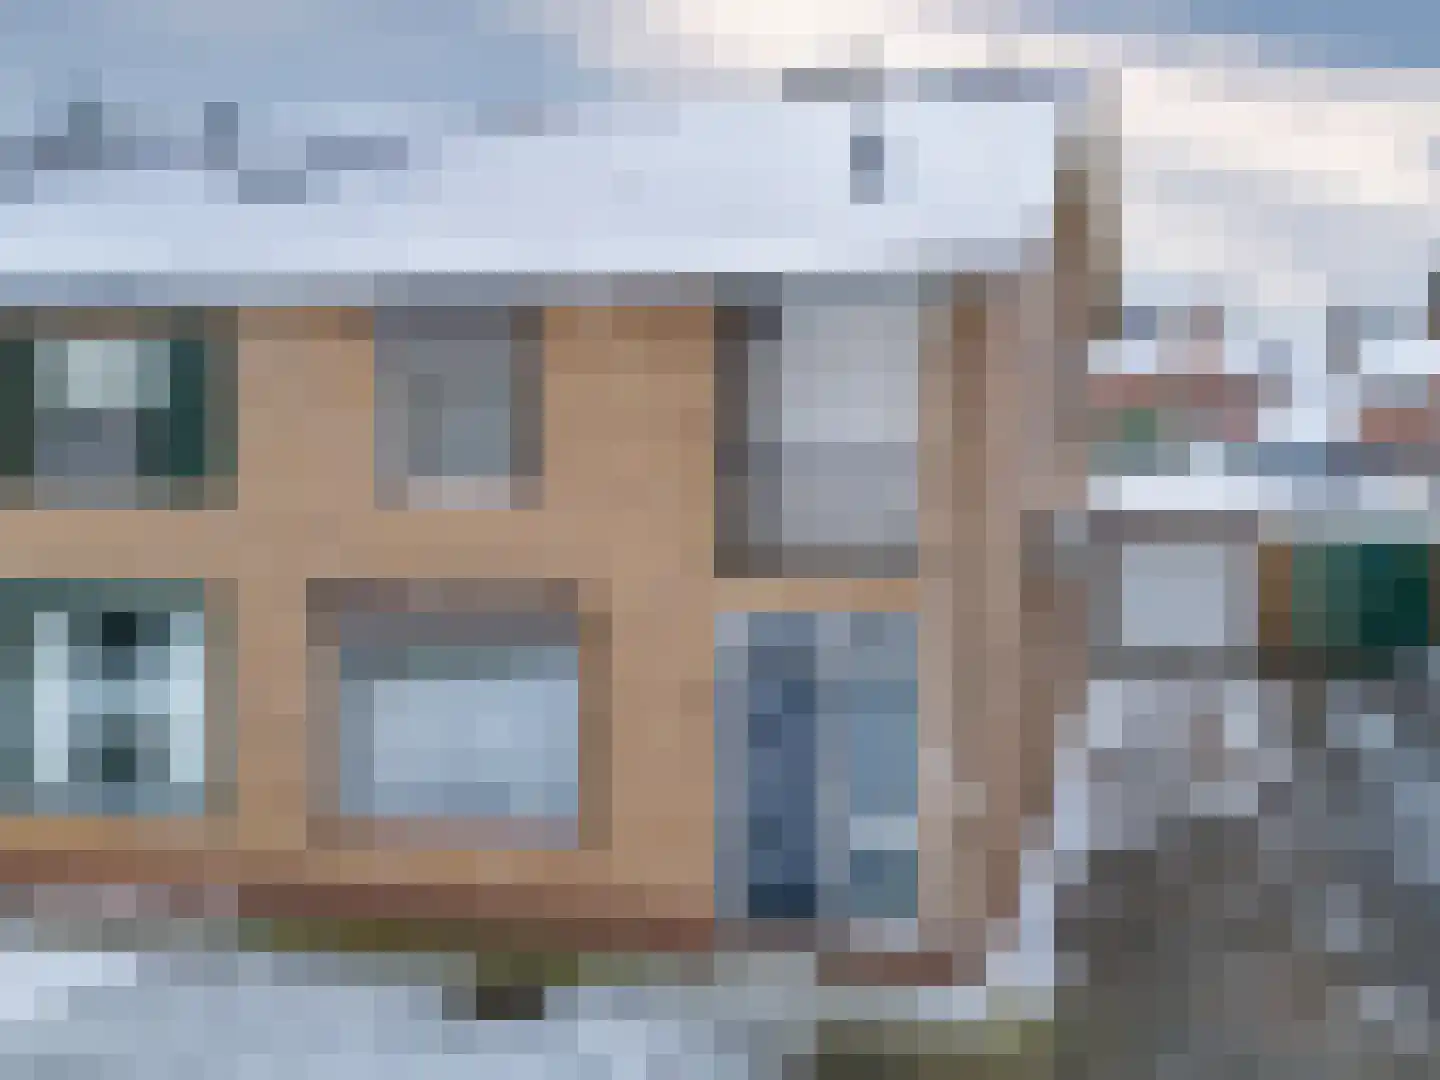
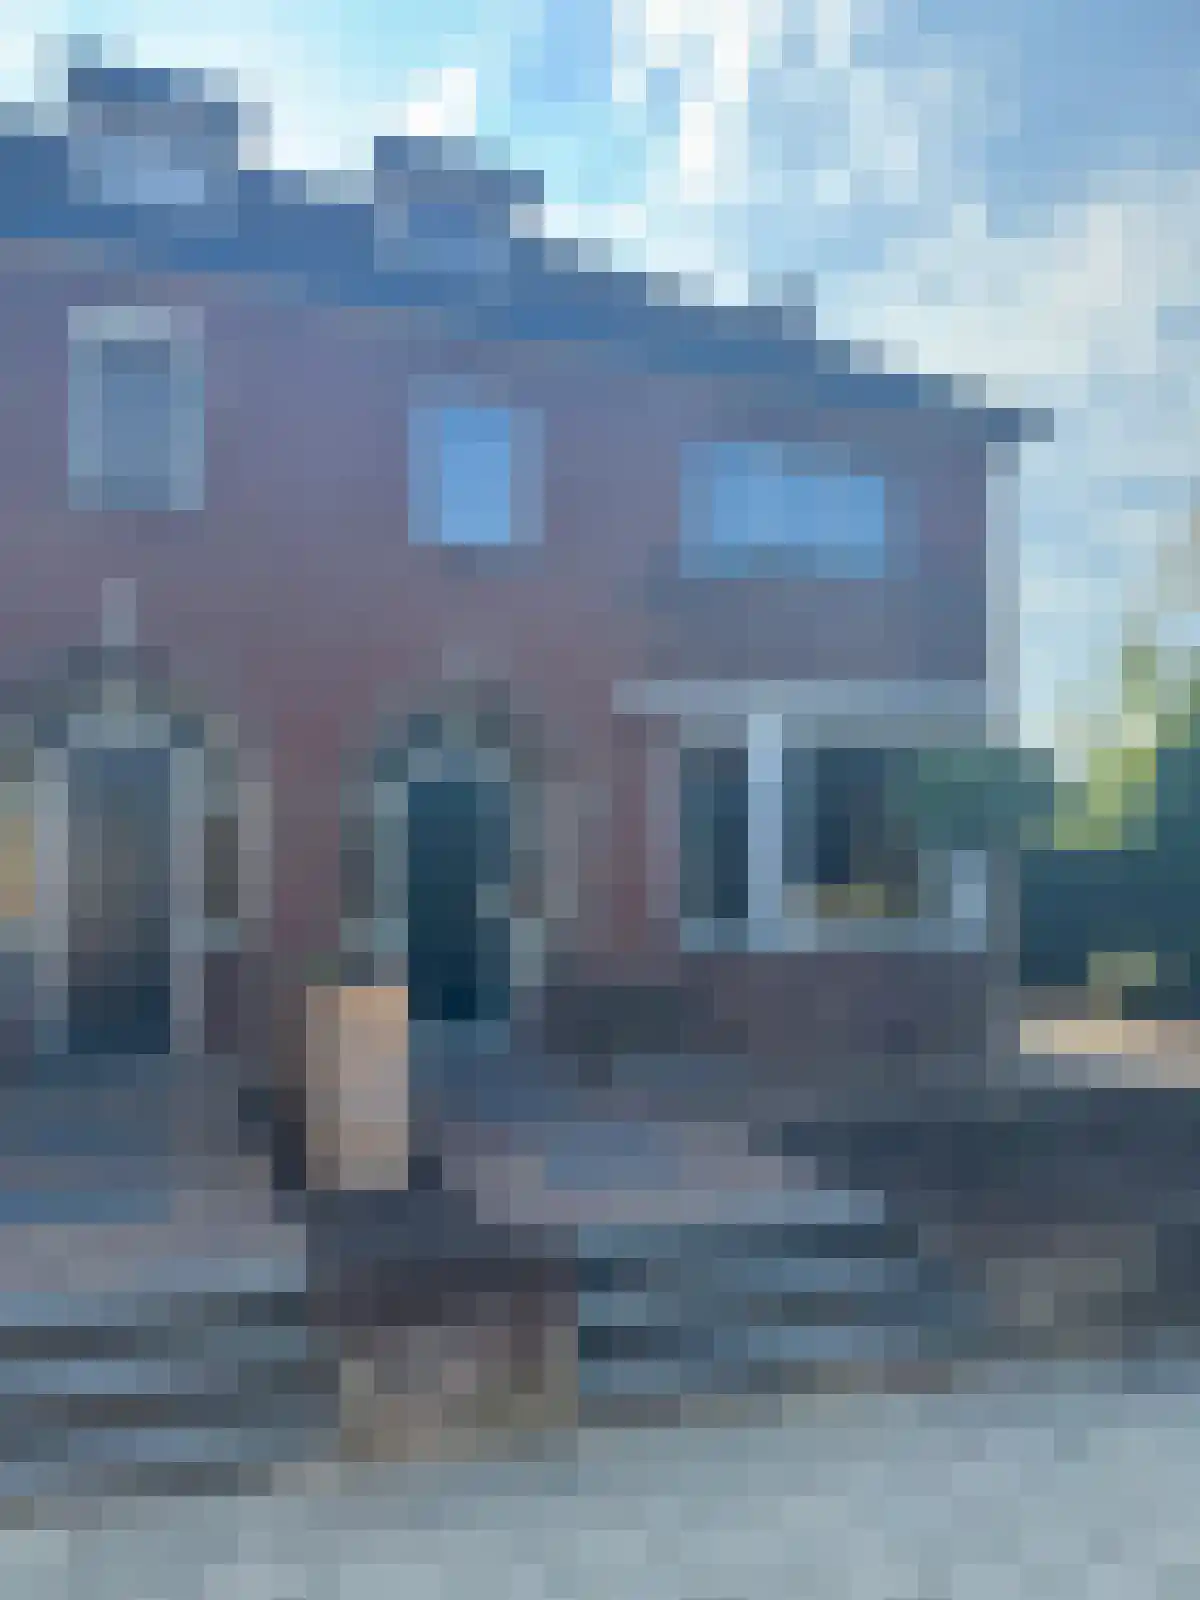
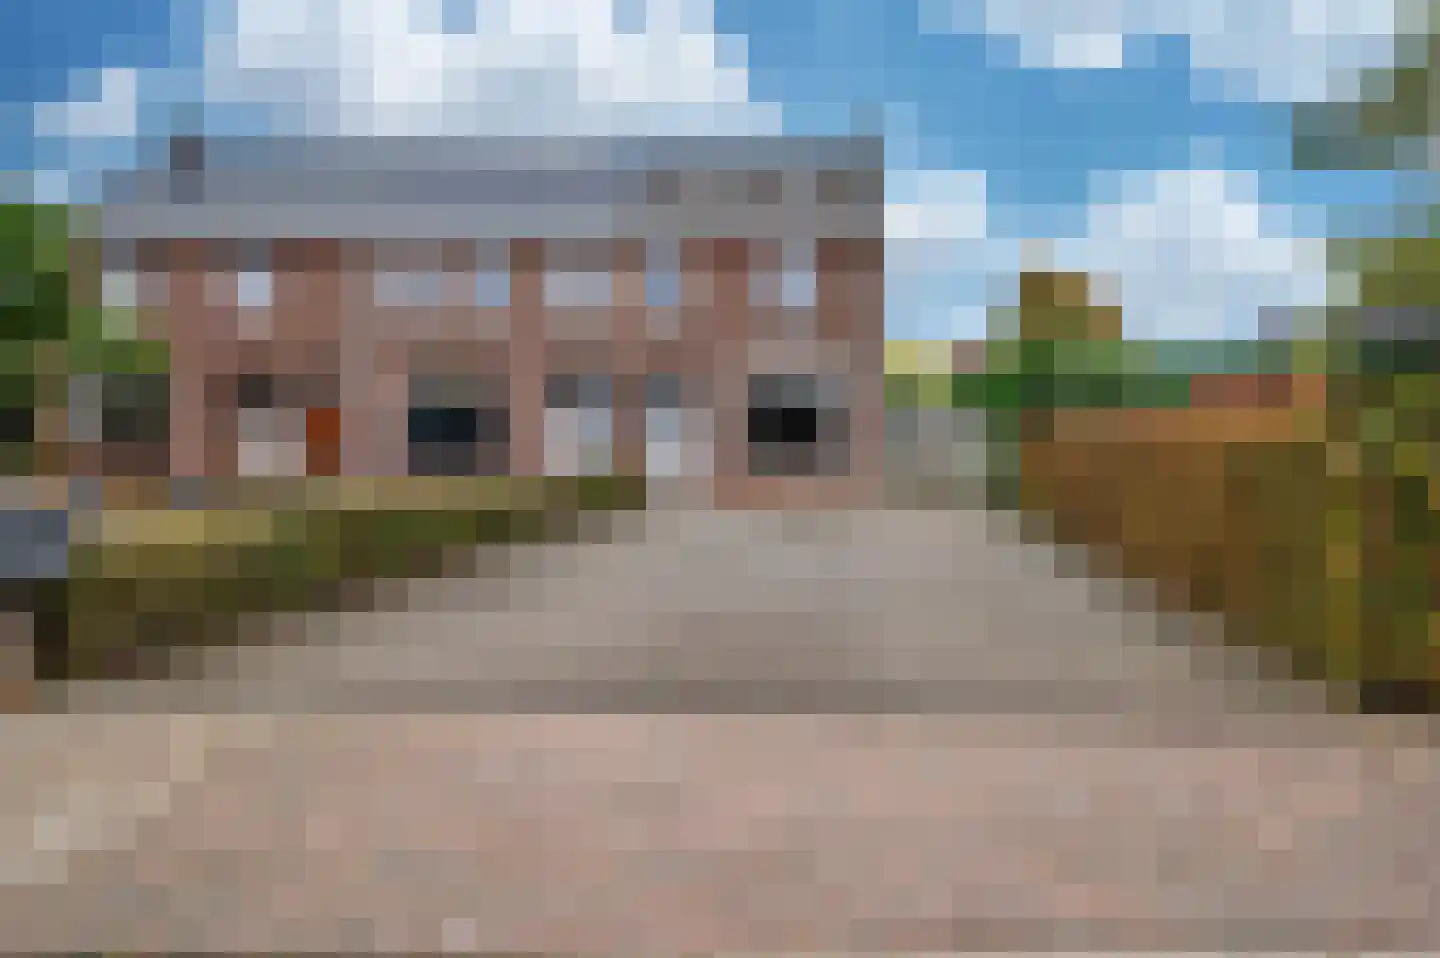
- Sold
Schoolstraat 163
5951CV Belfeld
€ 395.000 k.k.
€ 2.705/m²
- Living area
- 146 m²
- Land area
- 535 m²
- Bedrooms
- 3
View 27 sold houses in Belfeld
Type to search. Use arrow down and arrow up to navigate through results and press Enter to open.
Hidden search suggestions.
Compare sold homes in Belfeld or view the current offering in this location directly.
On this page you will find recently sold homes in Belfeld. Use this overview to better estimate selling prices, popular neighborhoods, and the local housing supply before you choose a real estate agent. Also view the current housing supply with 43 houses in Belfeld.
5951CV Belfeld
€ 395.000 k.k.
€ 2.705/m²
5951JK Belfeld
€ 289.000 k.k.
€ 3.567/m²
5951BL Belfeld
€ 275.000 k.k.
€ 3.161/m²
5951BW Belfeld
€ 394.500 k.k.
€ 3.233/m²
5951EJ Belfeld
€ 295.000 k.k.
€ 2.809/m²
5951BW Belfeld
€ 289.000 k.k.
€ 4.013/m²
5951GG Belfeld
€ 369.000 k.k.
€ 3.416/m²
5951EE Belfeld
€ 325.000 k.k.
€ 3.316/m²
5951GT Belfeld
€ 335.000 k.k.
€ 2.175/m²
5951CJ Belfeld
€ 250.000 k.k.
€ 1.724/m²
5951GL Belfeld
€ 259.000 k.k.
€ 2.252/m²
5951AE Belfeld
€ 310.000 k.k.
€ 3.333/m²
5951BP Belfeld
€ 249.000 k.k.
€ 2.621/m²
5951BA Belfeld
€ 350.000 k.k.
€ 2.777/m²
5951ER Belfeld
€ 399.000 k.k.
€ 3.000/m²
5951ES Belfeld
€ 395.000 k.k.
€ 3.495/m²
5951ER Belfeld
€ 339.000 k.k.
€ 2.607/m²
5951GZ Belfeld
€ 275.000 k.k.
€ 2.594/m²
5951BZ Belfeld
€ 639.000 k.k.
€ 3.672/m²
5951JD Belfeld
€ 449.000 k.k.
€ 3.805/m²
5951EH Belfeld
€ 239.000 k.k.
€ 2.515/m²
5951HB Belfeld
€ 369.500 k.k.
€ 2.447/m²
5951GD Belfeld
€ 295.000 k.k.
€ 3.470/m²
5951CH Belfeld
€ 287.500 k.k.
€ 2.764/m²
5951BW Belfeld
€ 425.000 k.k.
€ 3.148/m²
5951CN Belfeld
€ 395.000 k.k.
€ 2.862/m²
5951CZ Belfeld
€ 325.000 k.k.
€ 3.915/m²
Bekijk recente verkopen en ontvang gratis offertes van lokale makelaars. Vergelijk meer dan 27 makelaars in Belfeld.
Zelf je woning verkopen in Belfeld? Vergelijk verkoopmakelaars in Belfeld of bekijk de beste verkoopmakelaars in Belfeld als referentie bij jouw keuze.
Makelaars maken scherpere voorstellen als ze weten dat je vergelijkt — vraag offertes aan voor verkoop of aankoop.
Short answers about housing prices, sold homes and comparing real estate agents in Belfeld.
De kosten van een makelaar in Belfeld verschillen per kantoor, woningtype en verkoopaanpak. In Belfeld kun je 27 real estate agents vergelijken; bekijk daarom ook de makelaars in Belfeld om tarieven, presentatie en lokale ervaring beter naast elkaar te zetten.
On this page we currently show 27 sold houses in Belfeld from our selection. This helps you to better assess recent transactions and the local housing market.
Houses sold in Belfeld give insight into asking prices, house types and neighborhoods where recent transactions have taken place. Compare this also with the current housing stock in Belfeld to better understand the market.
You can use sold homes as a first market indication, but a local real estate agent can better take into account finishing, location, maintenance and current demand in Belfeld.
Vergelijk de 27 real estate agents in Belfeld op lokale verkoopervaring, reviews, verwachte opbrengst, courtage en marketingaanpak. Bekijk verkoopmakelaars in Belfeld of de top 10 makelaars in Belfeld om snel sterke kantoren te ontdekken.
View current location data on residents, WOZ development, housing stock, energy consumption, business activity and safety in Belfeld. In 2025 were there 5.515 residents. The average WOZ value in 2025 is EUR 329.000.
These figures help to better assess and compare the housing stock in Belfeld with recent sold homes. Orient yourself then on suitable top real estate agents in Belfeld for sales advice in this region.
Residents
5.515
Last year: 2025
Average WOZ
EUR 329.000
Last year: 2025
Average income per person.
EUR 30.200
Source: AllNumbers
Crimes (current year)
211
Total registered
| Year | Residents |
|---|---|
| 2021 | 5.505 |
| 2022 | 5.475 |
| 2023 | 5.530 |
| 2024 | 5.575 |
| 2025 | 5.515 |
| Year | Average WOZ |
|---|---|
| 2021 | EUR 244.000 |
| 2022 | EUR 256.000 |
| 2023 | EUR 300.000 |
| 2024 | EUR 301.000 |
| 2025 | EUR 329.000 |
Hoger
840
Praktisch
1.350
Middelbaar
1.840
Europa
690
Nederland
4.275
Buiten Europa
555
Label C
723
Label B
542
Label A
528
Label D
290
Label F
209
Label G
178
Label E
97
Label A++++
28
Label A+
25
Label A++
23
Label A+++
22
Label A+++++
2
| Year | Gas (m3) | Electricity (kWh) |
|---|---|---|
| 2020 | 1.310 | 3.170 |
| 2021 | 1.450 | 3.210 |
| 2022 | 1.130 | 3.040 |
| 2023 | 930 | 2.910 |
| 2024 | 890 | 2.950 |
Hoekwoning
Gas: 870 • Electricity: 2.690
Huurwoning
Gas: 780 • Electricity: 2.210
Koopwoning
Gas: 1.010 • Electricity: 3.260
Appartement
Gas: 560 • Electricity: 2.130
Tussenwoning
Gas: 770 • Electricity: 2.540
Vrijstaande woning
Gas: 1.340 • Electricity: 4.000
Twee-onder-één-kap woning
Gas: 950 • Electricity: 2.860
Total number of company establishments: 565
| Period | Crimes |
|---|---|
| jan 2025 | 17 |
| jan 2026 | 8 |
| jul 2025 | 14 |
| jun 2025 | 25 |
| mei 2025 | 32 |
| mrt 2025 | 18 |
| nov 2024 | 17 |
| nov 2025 | 12 |
| okt 2024 | 4 |
| okt 2025 | 17 |
| sep 2024 | 26 |
| sep 2025 | 10 |
These figures give an indicative picture of safety trends in the living environment of Belfeld.
Short answers based on current local statistics, handy for a quick comparison of the living environment.
Belfeld telt in 2025 ongeveer 5.515 inwoners.
De gemiddelde WOZ-waarde in Belfeld is in 2025 circa € 329.000.
Het gemiddelde inkomen per inwoner in Belfeld ligt rond € 30.200 per jaar.
Voor het huidige jaar gaat het om ongeveer 211 geregistreerde misdrijven. Gebruik deze cijfers als indicatie en vergelijk trends per periode.
In Belfeld komt vooral "Tussenwoningen" veel voor, met ongeveer 628 woningen.