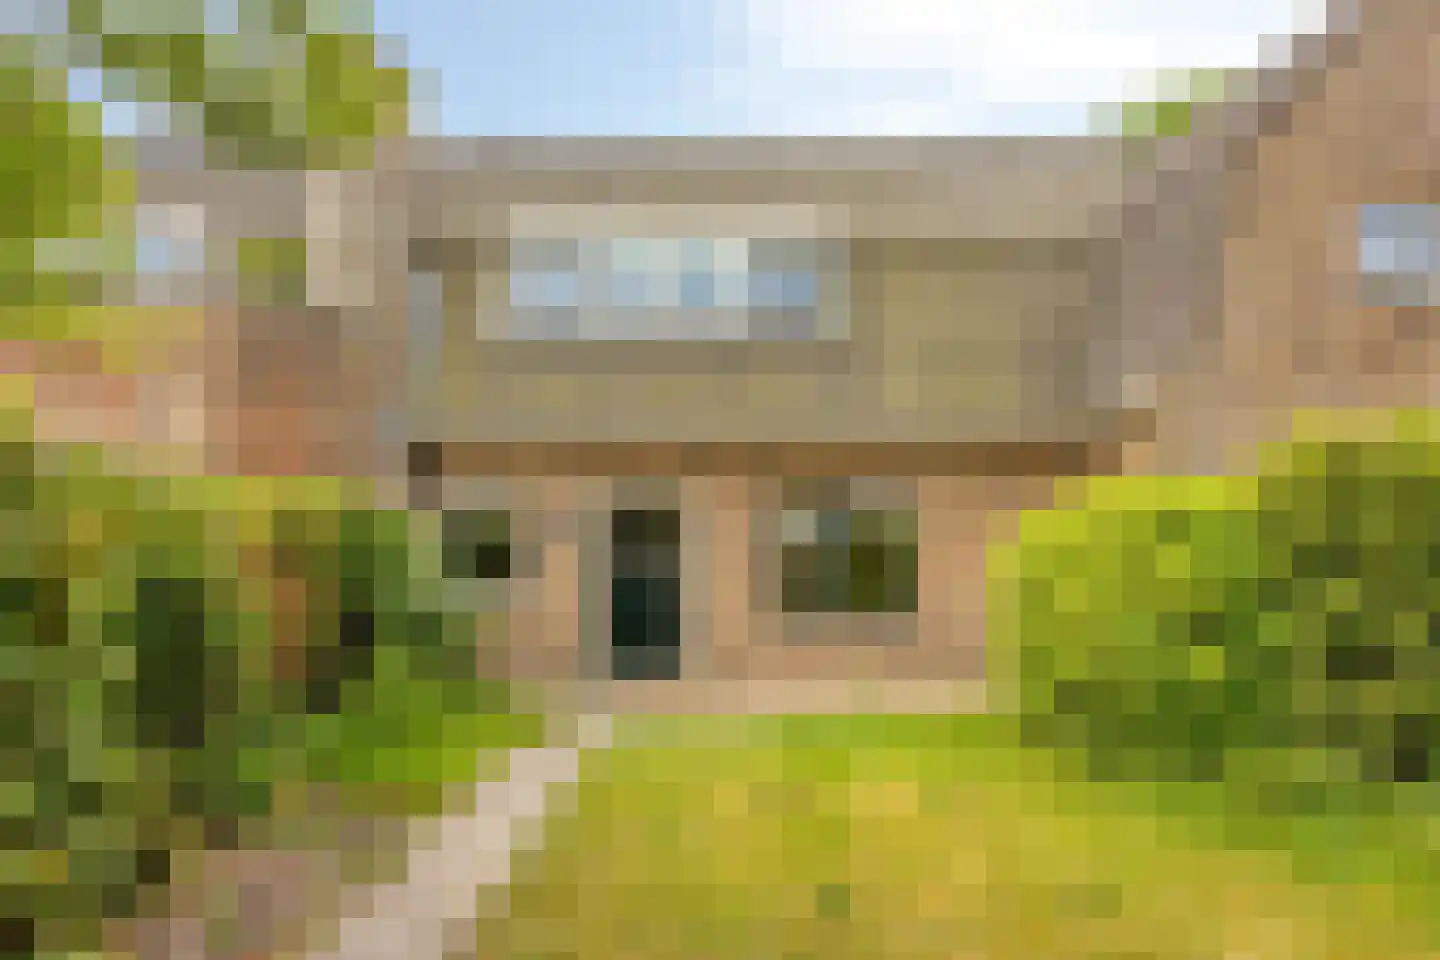
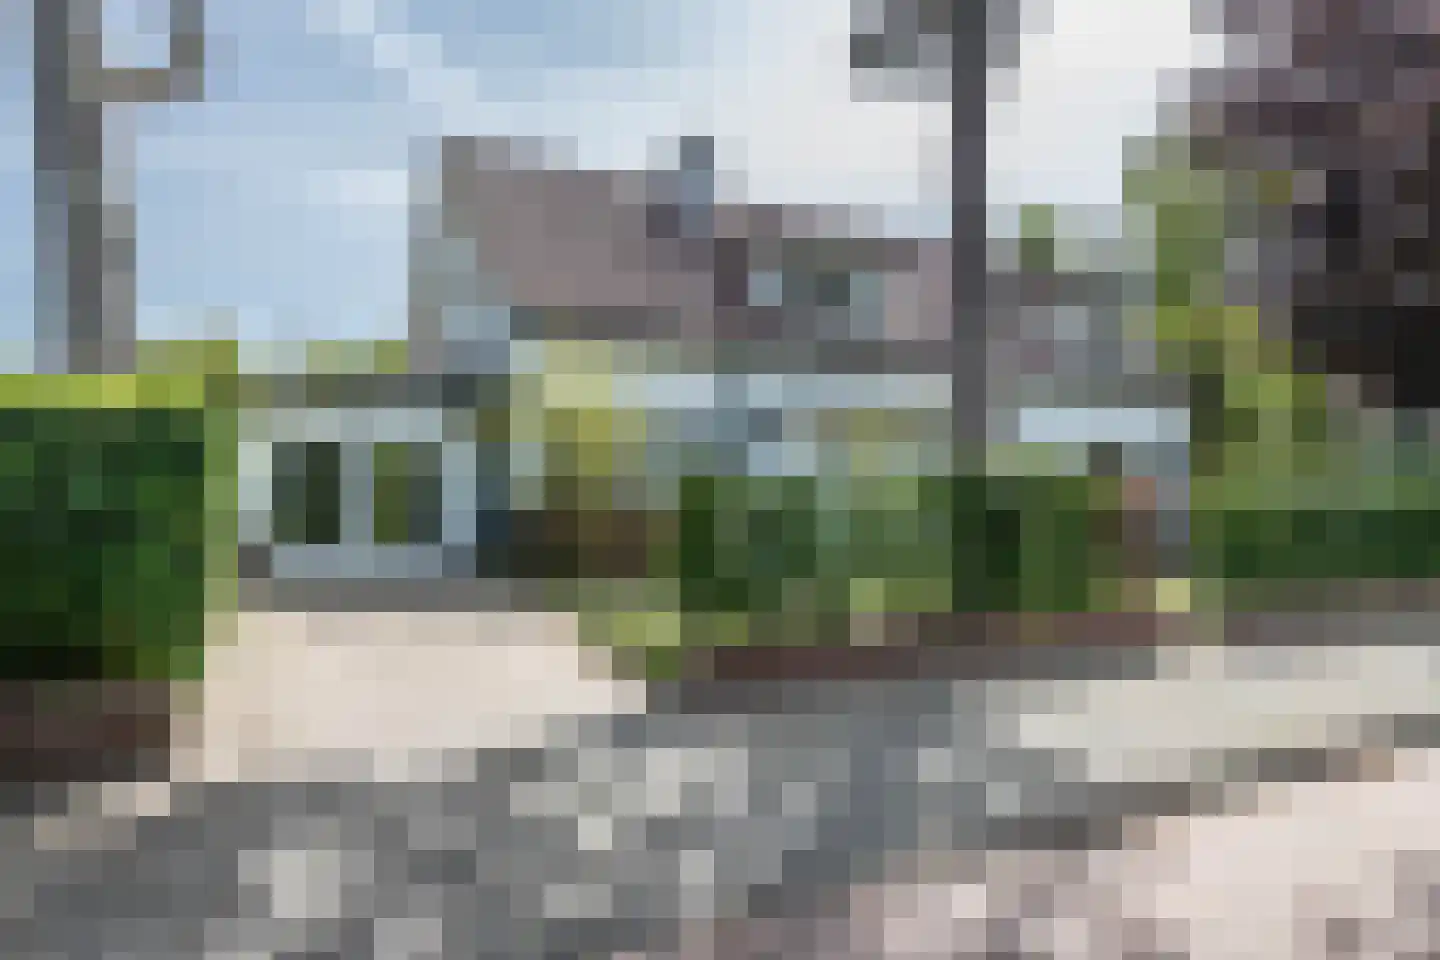
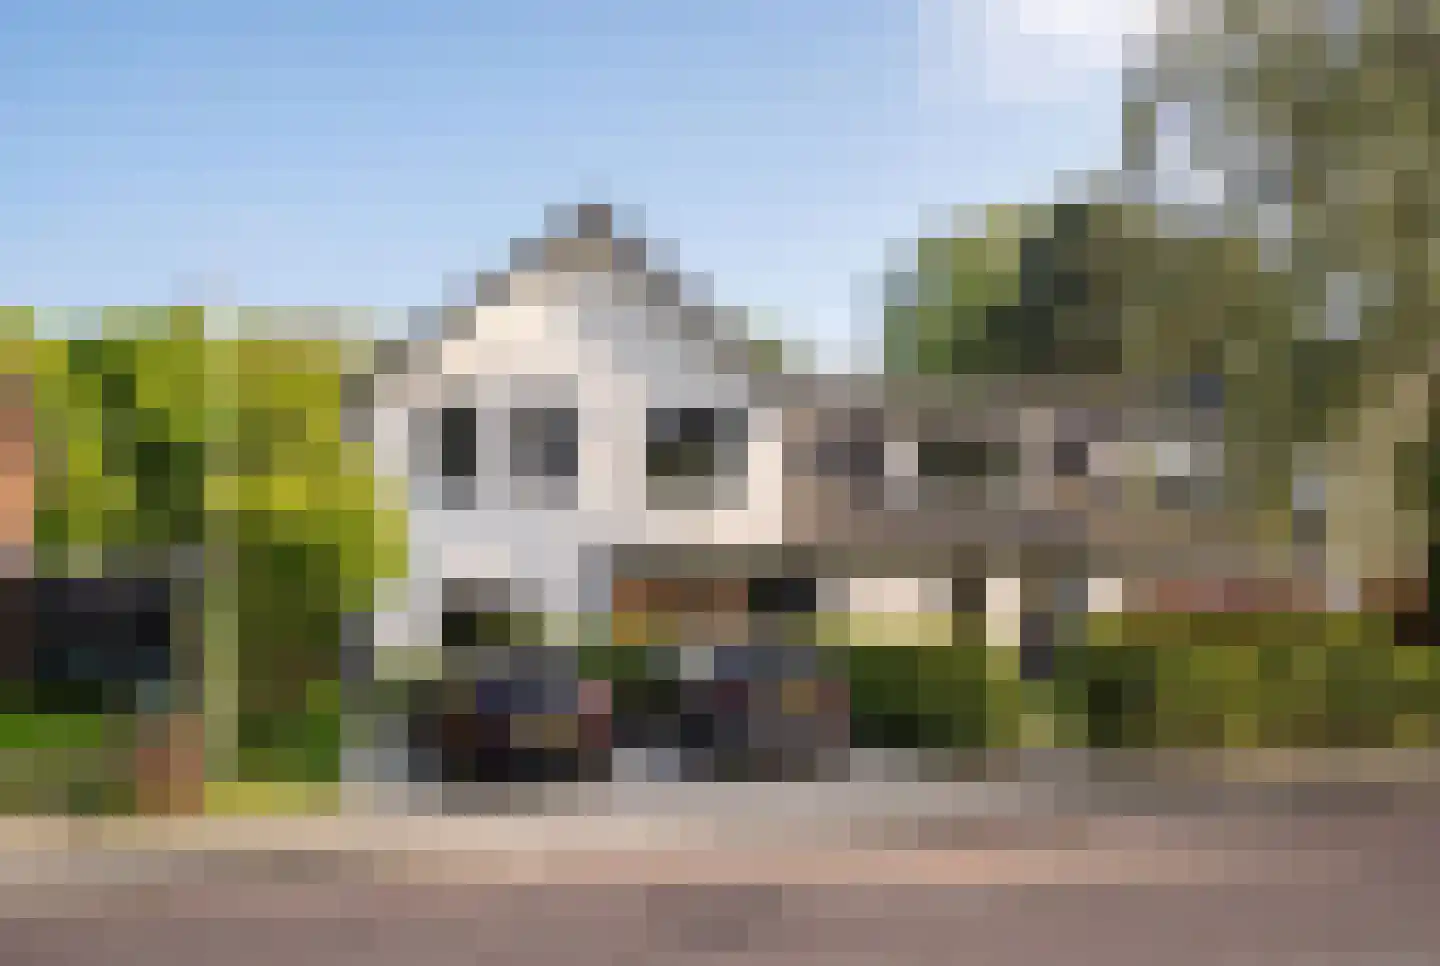
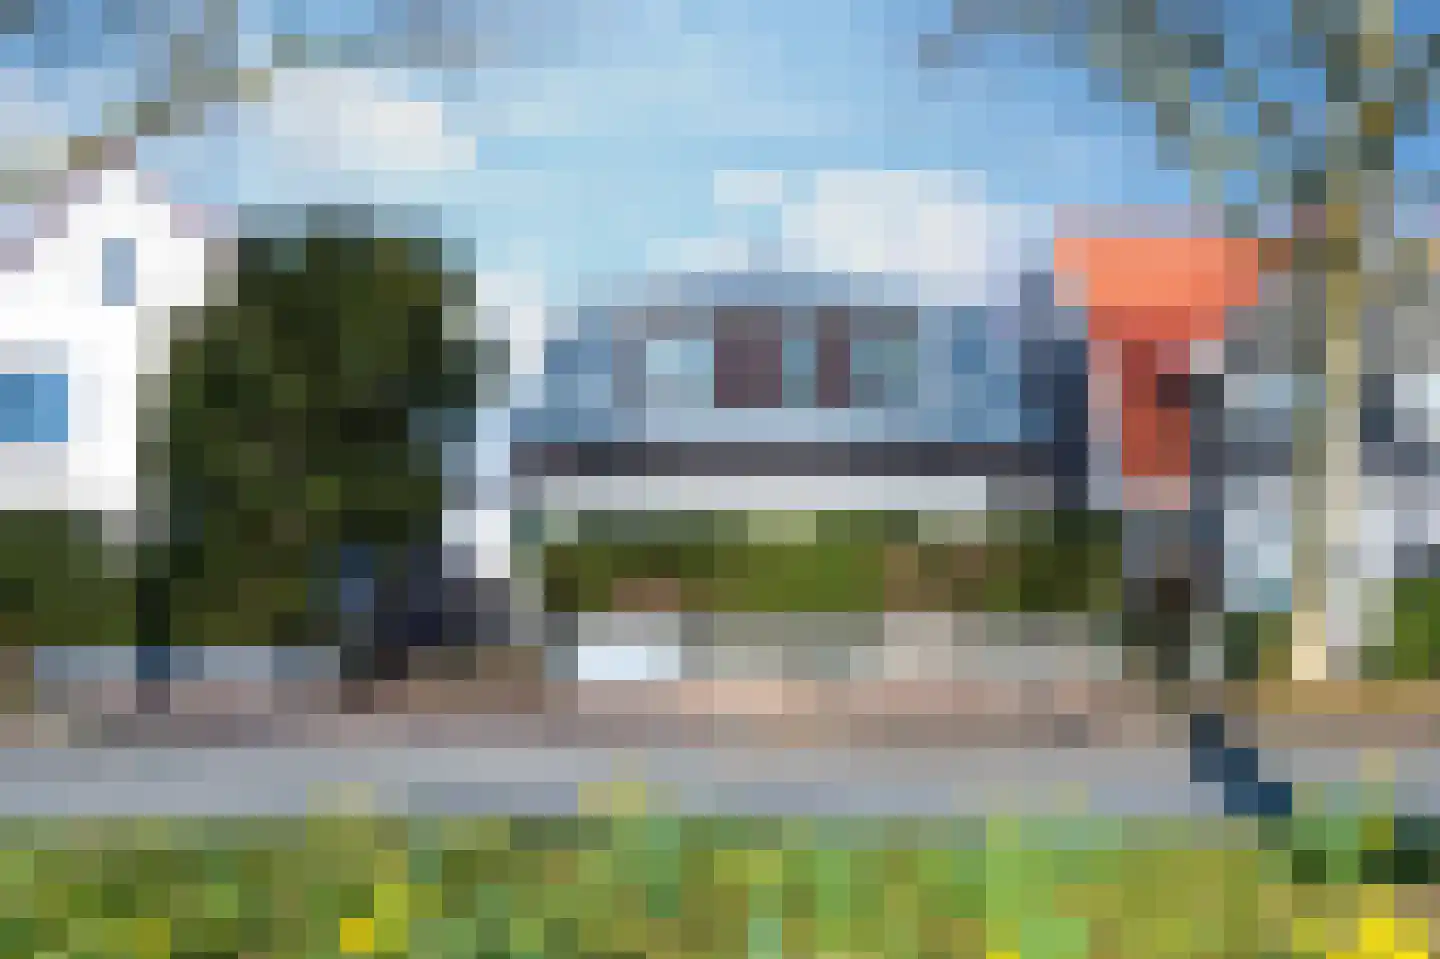
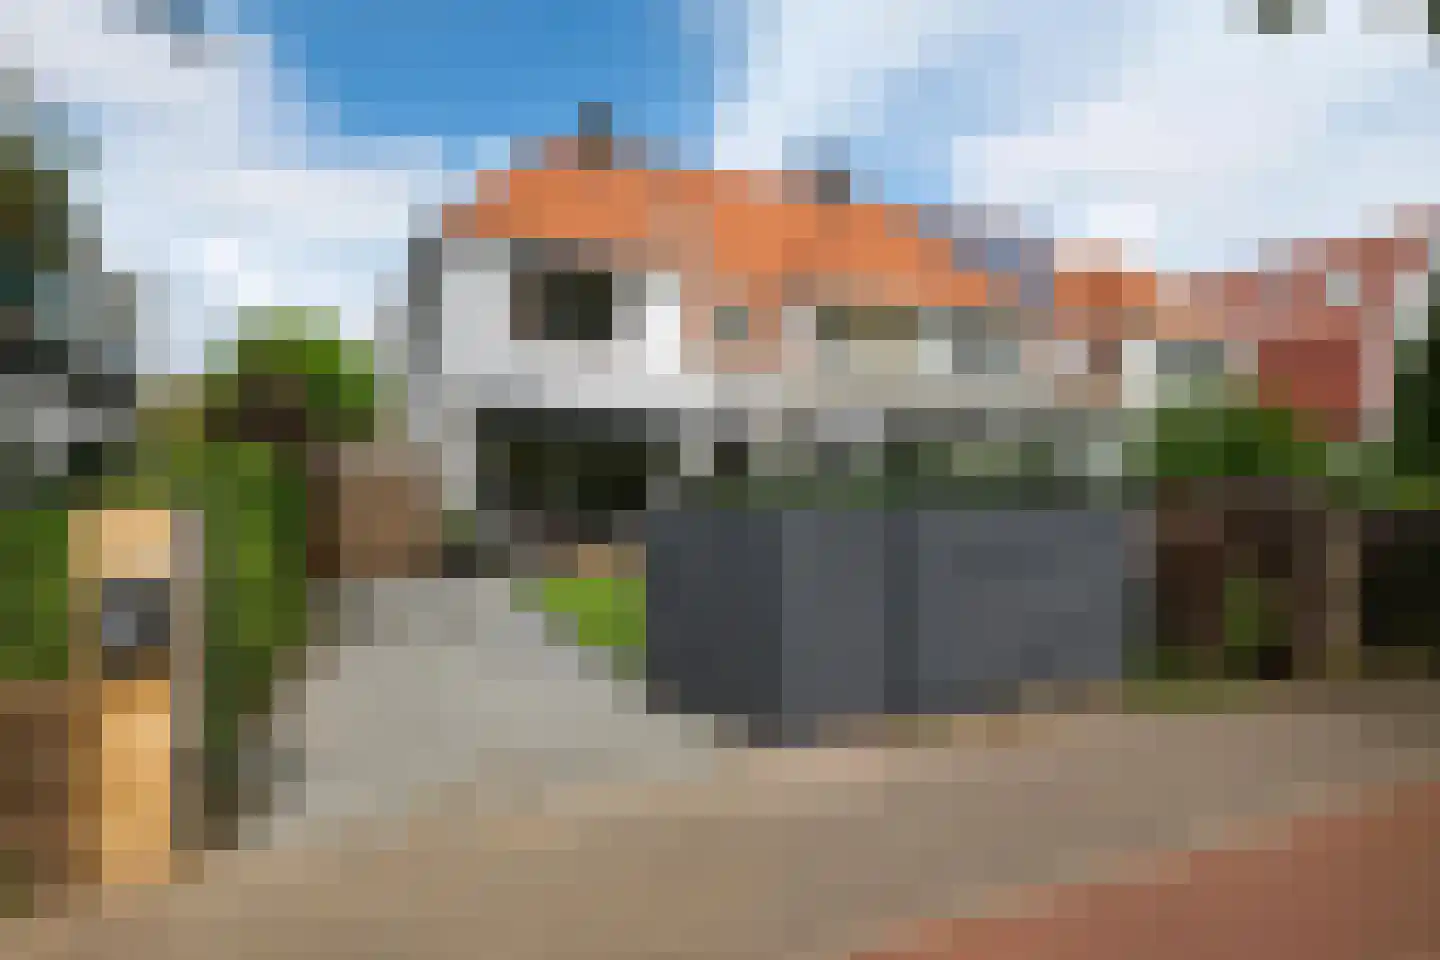
- Available
Bramenlaan 314
2116TV Bentveld
€ 950.000 k.k.
€ 6.884/m²
- Living area
- 138 m²
- Land area
- —
- Bedrooms
- 2
Searching in 22 houses in Bentveld
Type to search. Use arrow down and arrow up to navigate through results and press Enter to open.
Hidden search suggestions.
View current properties in Bentveld or search targeted on street, postal code and property characteristics.
View the current housing stock in Bentveld and quickly filter by price, living area, rooms and more. There are currently 22 houses in this place within our selection. View also 14 sold houses in Bentveld for extra insight into the local housing market.
2116TV Bentveld
€ 950.000 k.k.
€ 6.884/m²
2116ES Bentveld
€ 425.000 k.k.
€ 5.449/m²
2116VE Bentveld
€ 425.000 k.k.
€ 5.247/m²
2116TN Bentveld
€ 1.675.000 k.k.
€ 8.590/m²
2116TN Bentveld
€ 2.100.000 k.k.
€ 7.692/m²
2116EL Bentveld
€ 900.000 k.k.
€ 6.475/m²
2116TD Bentveld
€ 1.975.000 k.k.
2116EN Bentveld
€ 1.250.000 k.k.
€ 7.396/m²
2116EM Bentveld
€ 850.000 k.k.
€ 4.913/m²
2116ER Bentveld
€ 1.100.000 k.k.
€ 7.638/m²
2116TD Bentveld
€ 1.765.000 k.k.
€ 9.540/m²
2116TB Bentveld
€ 1.600.000 k.k.
€ 8.743/m²
2116EN Bentveld
€ 675.000 k.k.
€ 7.105/m²
2116TR Bentveld
€ 890.000 k.k.
€ 7.007/m²
2116VD Bentveld
€ 425.000 k.k.
€ 5.182/m²
2116TM Bentveld
€ 1.675.000 k.k.
€ 7.683/m²
2116EK Bentveld
€ 1.100.000 k.k.
€ 5.882/m²
2116VA Bentveld
€ 750.000 k.k.
€ 5.172/m²
2116VC Bentveld
€ 385.000 k.k.
€ 4.753/m²
2116TM Bentveld
€ 1.250.000 k.k.
€ 7.621/m²
2116TL Bentveld
€ 1.850.000 k.k.
€ 10.571/m²
2116TL Bentveld
€ 1.550.000 k.k.
€ 7.673/m²
Get free quotes from real estate agents with local market knowledge. Compare more than 150 real estate agents in Bentveld.
Selling a home in Bentveld? Compare all real estate agents in Bentveld or view the top 10 real estate agents in Bentveld for extra context for your choice.
Real estate agents make sharper offers when they know you're comparing — ask for quotes for sale or purchase.
Practical answers about housing supply, sales and comparing real estate agents in Bentveld.
The costs of a real estate agent in Bentveld depend on commission, setup costs, property presentation and the chosen service. Compare the 150 real estate agents in Bentveld via the real estate agent page and request multiple quotes to compare rates and approach well.
Within our selection, we are currently showing 22 houses in Bentveld. View also the sold houses in Bentveld to compare the current offering with recent transactions.
Take into account not only price and living area but also maintenance, energy label, location, outdoor space and sales status. This way you compare houses in Bentveld on more than just the asking price.
A local real estate agent knows the neighborhoods, recent transactions and demand in Bentveld. By comparing 150 real estate agents in the region you get a better insight into prices, sales strategy and expected yield; the top 10 in Bentveld provides a useful starting point.
Yes, when making a sales plan, a valuation in Bentveld is wise. You gain insight into a realistic asking price and can then compare offers from real estate agents specifically.
View current location data on residents, WOZ development, housing stock, energy consumption, business activity and safety in Bentveld. In 2025 were there 1.005 residents. The average WOZ value in 2025 is EUR 937.000.
These figures help to better assess and compare the housing stock in Bentveld with recent sold homes. Orient yourself then on suitable top real estate agents in Bentveld for sales advice in this region.
Residents
1.005
Last year: 2025
Average WOZ
EUR 937.000
Last year: 2025
Average income per person.
EUR 59.600
Source: AllNumbers
Crimes (current year)
38
Total registered
| Year | Residents |
|---|---|
| 2021 | 1.030 |
| 2022 | 1.035 |
| 2023 | 1.040 |
| 2024 | 1.020 |
| 2025 | 1.005 |
| Year | Average WOZ |
|---|---|
| 2021 | EUR 741.000 |
| 2022 | EUR 799.000 |
| 2023 | EUR 918.000 |
| 2024 | EUR 893.000 |
| 2025 | EUR 937.000 |
Hoger
33
Praktisch
29
Middelbaar
38
Europa
80
Nederland
775
Buiten Europa
150
Label C
149
Label F
97
Label G
71
Label B
66
Label A
61
Label E
59
Label D
27
Label A+++
2
Label A+
0
Label A++
0
Label A++++
0
Label A+++++
0
| Year | Gas (m3) | Electricity (kWh) |
|---|---|---|
| 2020 | 1.840 | 3.480 |
| 2021 | 2.130 | 3.560 |
| 2022 | 1.680 | 3.350 |
| 2023 | 1.440 | 3.220 |
| 2024 | 1.350 | 3.270 |
Hoekwoning
Gas: 1.640 • Electricity: 3.010
Huurwoning
Gas: 780 • Electricity: 1.610
Koopwoning
Gas: 1.750 • Electricity: 3.960
Appartement
Gas: 810 • Electricity: 1.850
Tussenwoning
Gas: 1.370 • Electricity: 2.150
Vrijstaande woning
Gas: 2.300 • Electricity: 5.150
Twee-onder-één-kap woning
Gas: 1.770 • Electricity: 4.260
Total number of company establishments: 210
| Period | Crimes |
|---|---|
| jan 2025 | 7 |
| jan 2026 | 2 |
| jul 2025 | 4 |
| jun 2025 | 5 |
| mei 2025 | 2 |
| mrt 2025 | 1 |
| nov 2024 | 3 |
| nov 2025 | 2 |
| okt 2024 | 2 |
| okt 2025 | 2 |
| sep 2024 | 1 |
| sep 2025 | 1 |
These figures give an indicative picture of safety trends in the living environment of Bentveld.
Short answers based on current local statistics, handy for a quick comparison of the living environment.
Bentveld telt in 2025 ongeveer 1.005 inwoners.
De gemiddelde WOZ-waarde in Bentveld is in 2025 circa € 937.000.
Het gemiddelde inkomen per inwoner in Bentveld ligt rond € 59.600 per jaar.
Voor het huidige jaar gaat het om ongeveer 38 geregistreerde misdrijven. Gebruik deze cijfers als indicatie en vergelijk trends per periode.
In Bentveld komt vooral "Appartementen" veel voor, met ongeveer 276 woningen.