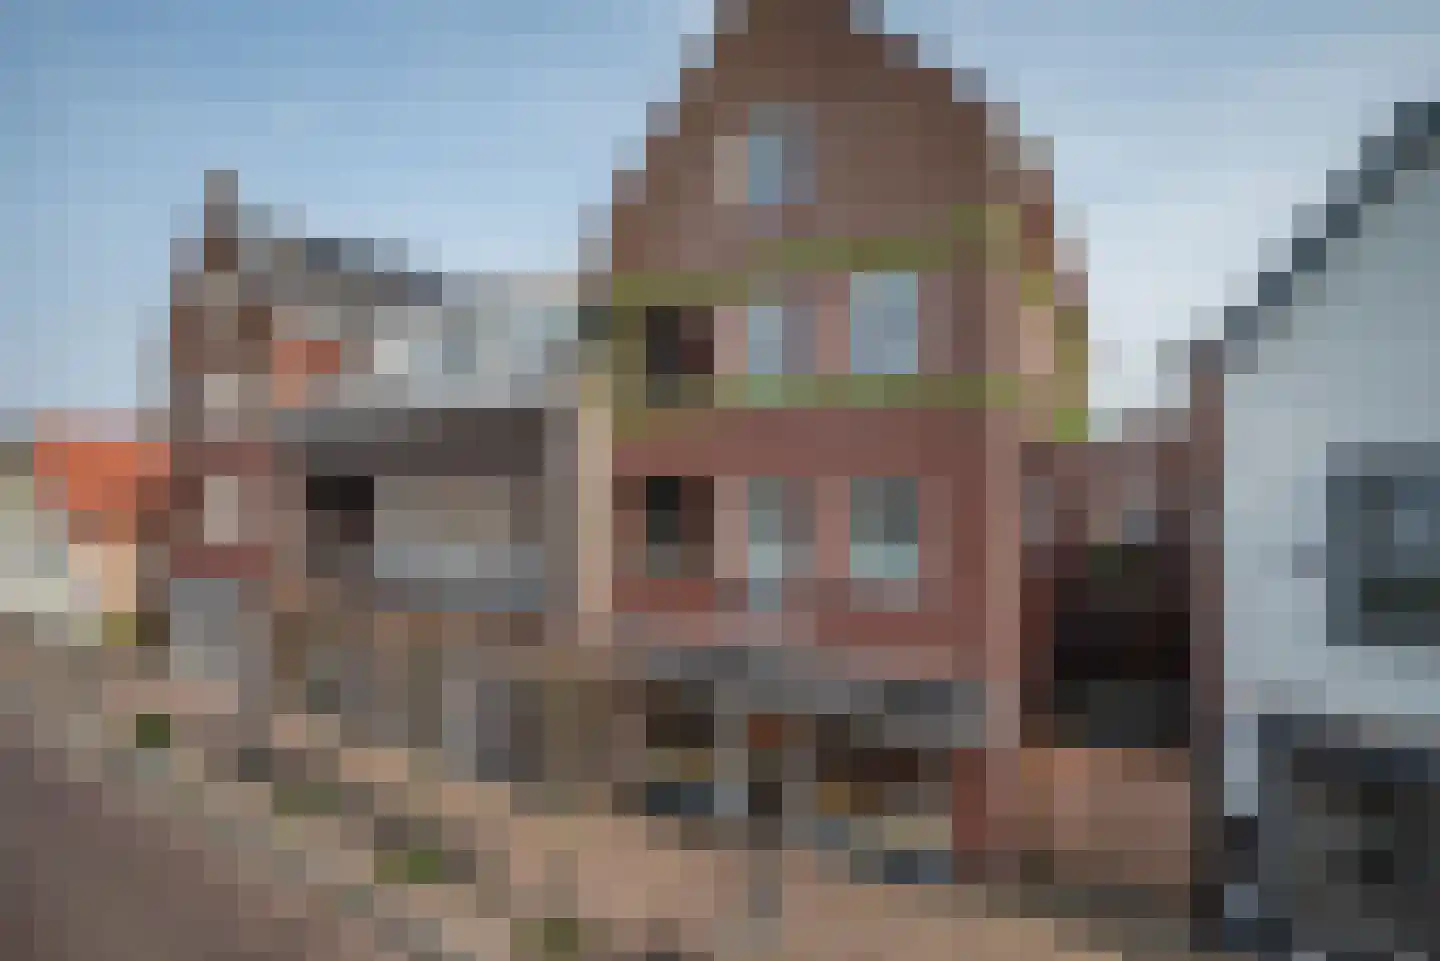
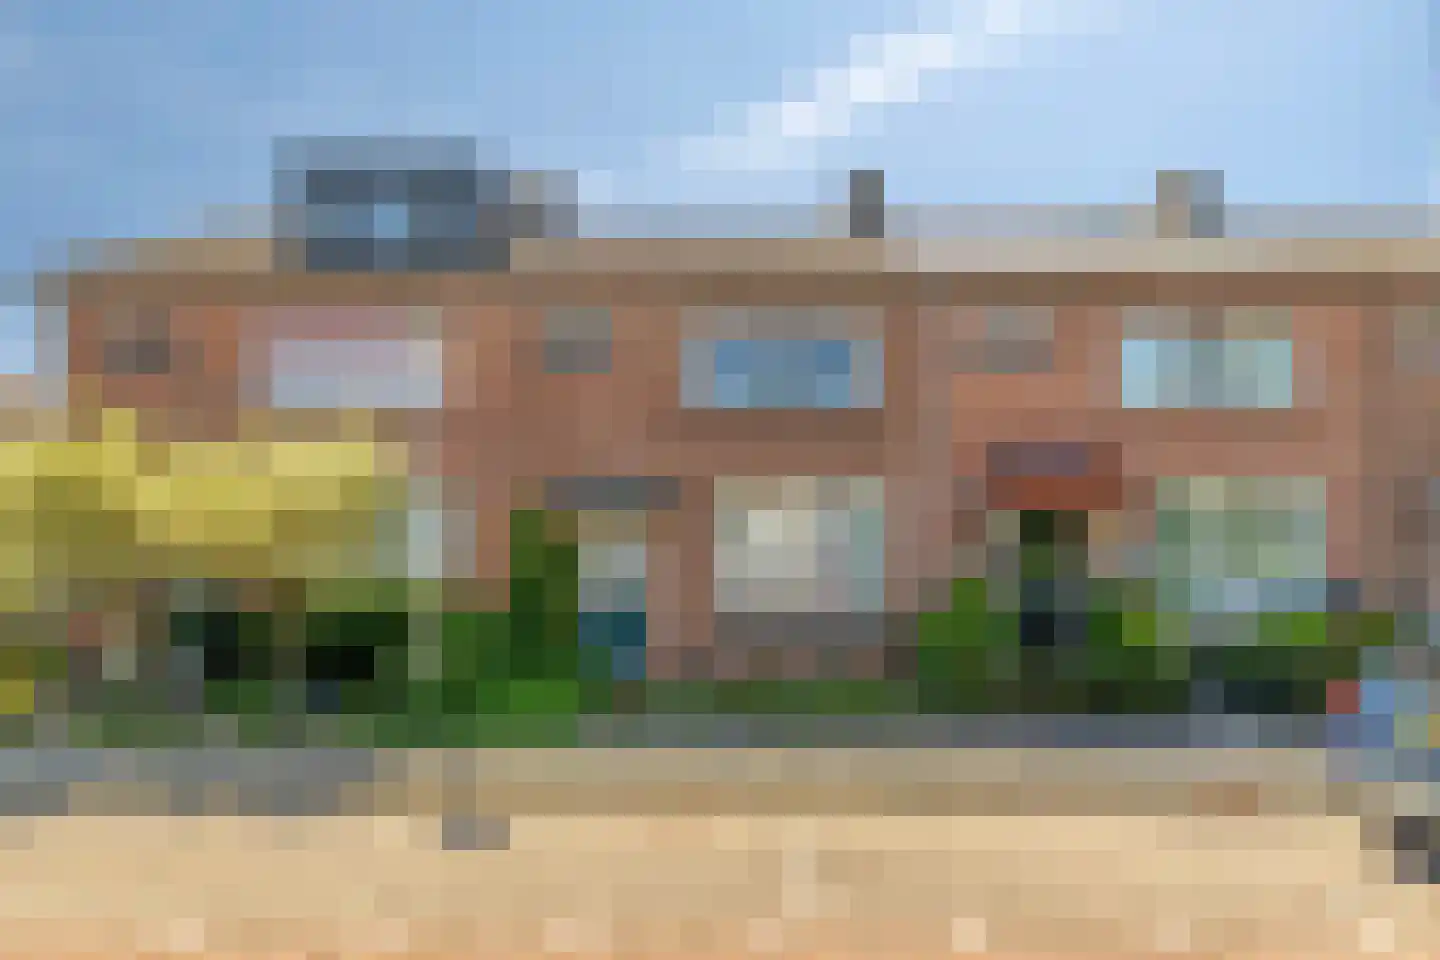
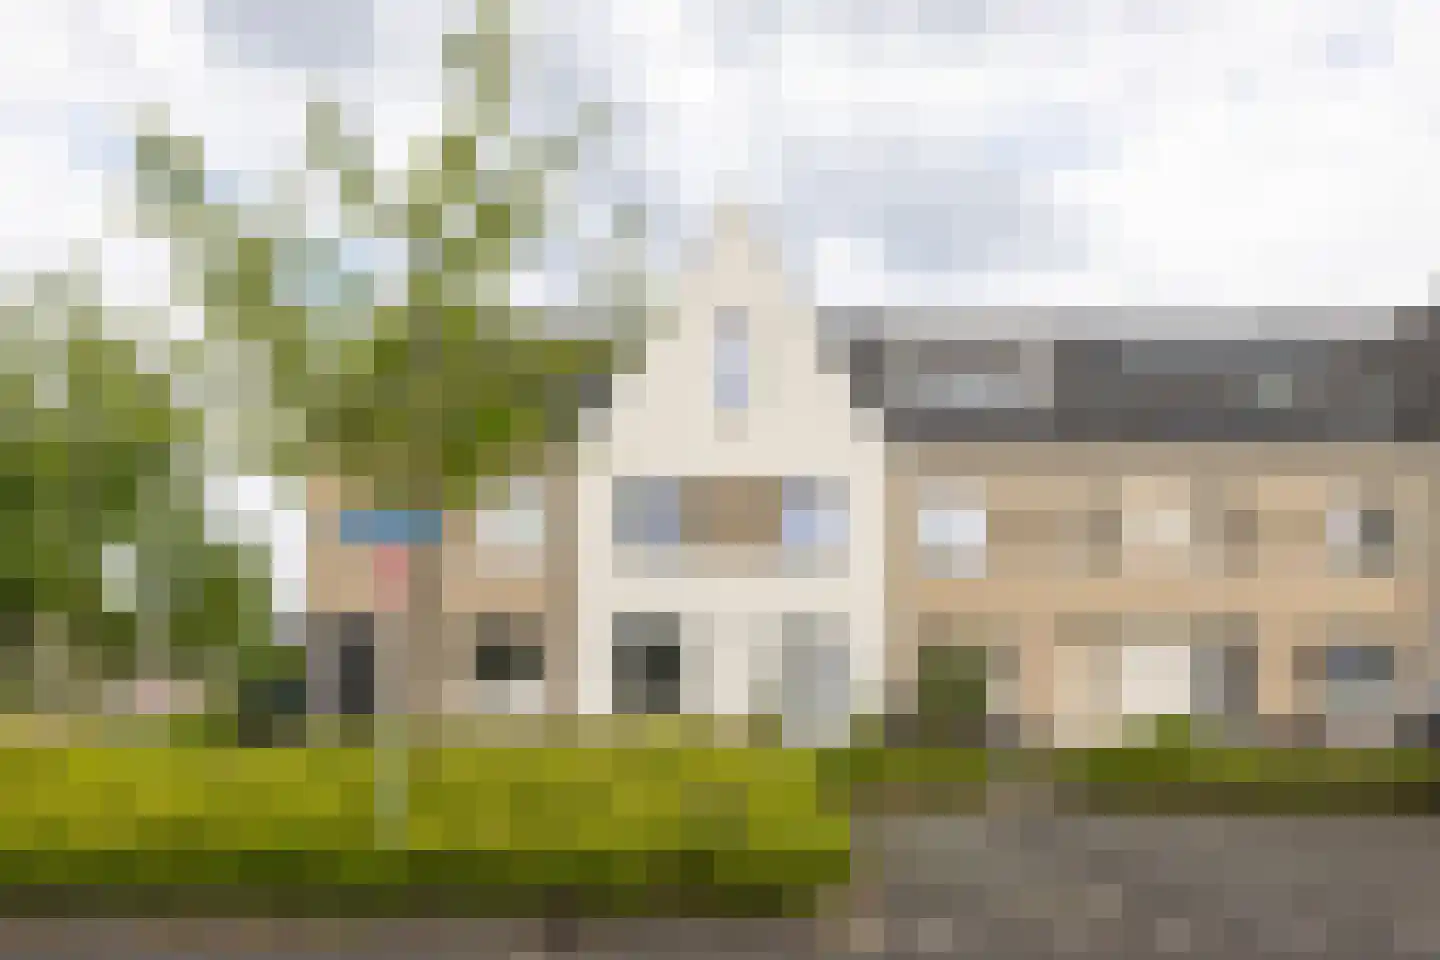
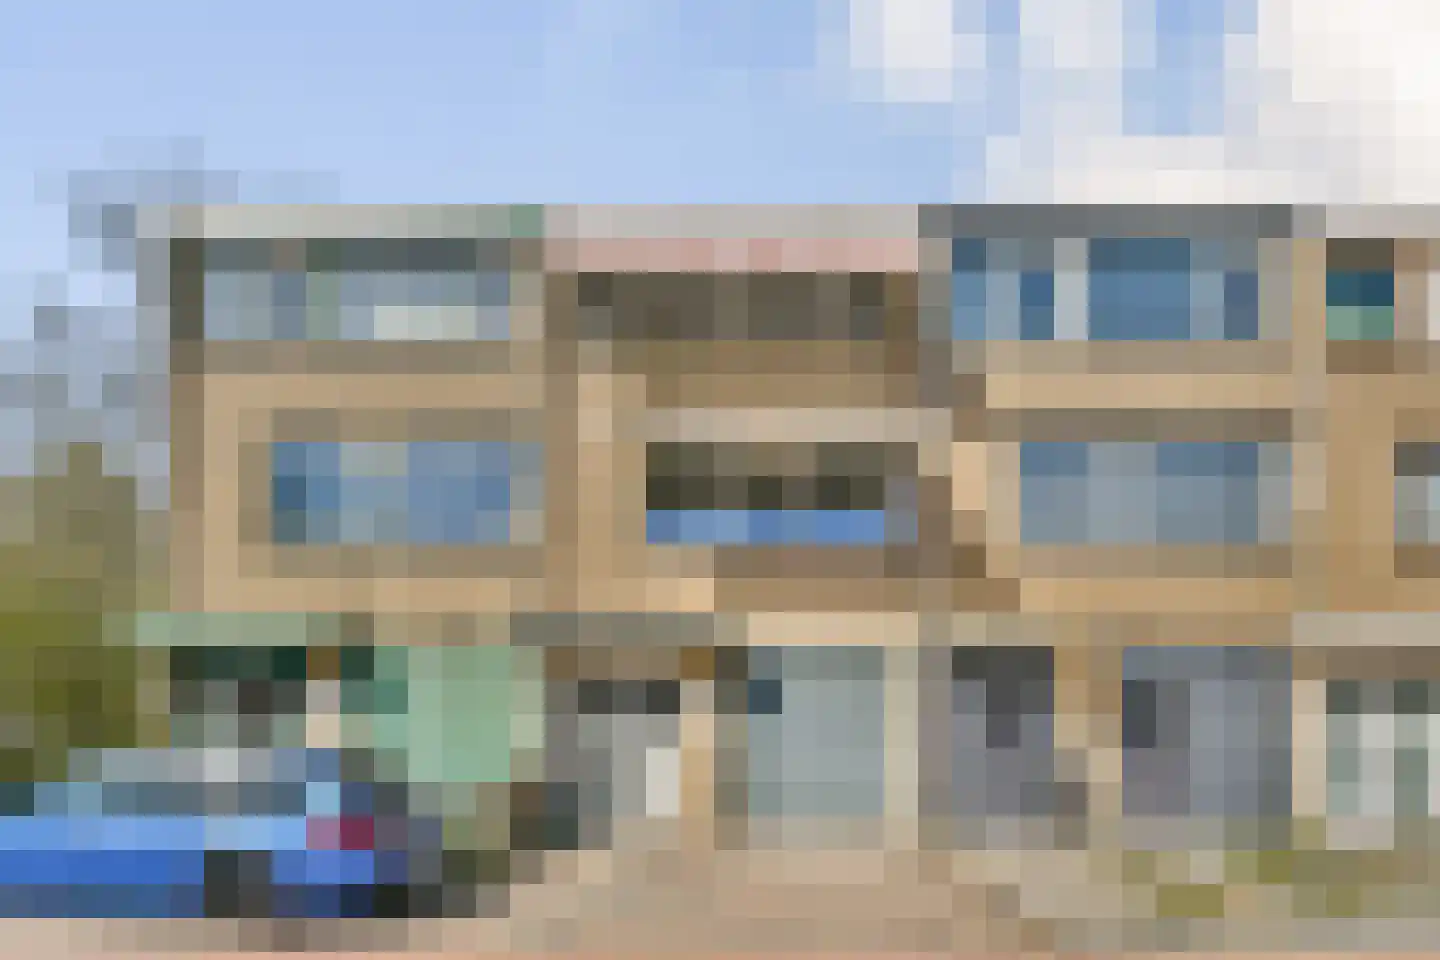
- Available
Groene Loper 11
2665VK Bleiswijk
€ 935.000 k.k.
€ 5.844/m²
- Living area
- 160 m²
- Land area
- 237 m²
- Bedrooms
- 4
Searching in 117 houses in Bleiswijk
Type to search. Use arrow down and arrow up to navigate through results and press Enter to open.
Hidden search suggestions.
View current properties in Bleiswijk or search targeted on street, postal code and property characteristics.
View the current housing stock in Bleiswijk and quickly filter by price, living area, rooms and more. There are currently 117 houses in this place within our selection. View also 76 sold houses in Bleiswijk for extra insight into the local housing market.
2665VK Bleiswijk
€ 935.000 k.k.
€ 5.844/m²
2665CX Bleiswijk
€ 550.000 k.k.
€ 5.288/m²
2665RV Bleiswijk
€ 325.000 k.k.
€ 3.533/m²
2665AE Bleiswijk
€ 500.000 k.k.
€ 3.906/m²
2665XL Bleiswijk
€ 575.000 k.k.
€ 5.088/m²
2665AN Bleiswijk
€ 350.000 k.k.
€ 4.795/m²
2665ES Bleiswijk
€ 525.000 k.k.
€ 4.234/m²
2665TL Bleiswijk
€ 598.000 k.k.
€ 5.292/m²
2665DL Bleiswijk
€ 525.000 k.k.
€ 4.565/m²
2665BA Bleiswijk
€ 515.000 k.k.
€ 4.952/m²
2665AG Bleiswijk
€ 525.000 k.k.
€ 4.102/m²
2665BW Bleiswijk
€ 1.150.000 k.k.
€ 5.066/m²
2665TK Bleiswijk
€ 1.075.000 k.k.
€ 3.277/m²
2665AD Bleiswijk
€ 535.000 k.k.
€ 4.115/m²
2665HS Bleiswijk
€ 598.000 k.k.
€ 4.430/m²
2665KT Bleiswijk
€ 1.595.000 k.k.
€ 6.787/m²
2665BC Bleiswijk
€ 499.000 k.k.
€ 3.669/m²
2665CE Bleiswijk
€ 510.000 k.k.
€ 4.595/m²
2665TE Bleiswijk
€ 39.500 k.k.
2665CA Bleiswijk
€ 950.000 k.k.
€ 5.689/m²
2665XK Bleiswijk
€ 445.000 k.k.
€ 3.836/m²
2665KC Bleiswijk
€ 925.000 k.k.
€ 4.843/m²
2665SX Bleiswijk
€ 2.795 p/m
€ 11/m²
2665XJ Bleiswijk
€ 425.000 k.k.
€ 3.373/m²
2665KE Bleiswijk
€ 895.000 k.k.
€ 5.234/m²
2665CB Bleiswijk
€ 950.000 k.k.
€ 5.307/m²
2665SL Bleiswijk
€ 849.000 k.k.
€ 4.665/m²
2665BZ Bleiswijk
€ 625.000 k.k.
€ 4.112/m²
Get free quotes from real estate agents with local market knowledge. Compare more than 148 real estate agents in Bleiswijk.
Selling a home in Bleiswijk? View the sales-oriented guide sell a house in Bleiswijk, compare all real estate agents in Bleiswijk or view the top 10 real estate agents in Bleiswijk for extra context to your choice.
Real estate agents make sharper offers when they know you're comparing — ask for quotes for sale or purchase.
Practical answers about housing supply, sales and comparing real estate agents in Bleiswijk.
The costs of a real estate agent in Bleiswijk depend on commission, setup costs, property presentation and the chosen service. Compare the 148 real estate agents in Bleiswijk via the real estate agent page and request multiple quotes to compare rates and approach well.
Within our selection, we are currently showing 117 houses in Bleiswijk. View also the sold houses in Bleiswijk to compare the current offering with recent transactions.
Take into account not only price and living area but also maintenance, energy label, location, outdoor space and sales status. This way you compare houses in Bleiswijk on more than just the asking price.
A local real estate agent knows the neighborhoods, recent transactions and demand in Bleiswijk. By comparing 148 real estate agents in the region you get a better insight into prices, sales strategy and expected yield; the top 10 in Bleiswijk provides a useful starting point.
Yes, when making a sales plan, a valuation in Bleiswijk is wise. You gain insight into a realistic asking price and can then compare offers from real estate agents specifically.
View current location data on residents, WOZ development, housing stock, energy consumption, business activity and safety in Bleiswijk. In 2025 were there 12.060 residents. The average WOZ value in 2025 is EUR 482.032.
These figures help to better assess and compare the housing stock in Bleiswijk with recent sold homes. Orient yourself then on suitable top real estate agents in Bleiswijk for sales advice in this region.
Residents
12.060
Last year: 2025
Average WOZ
EUR 482.032
Last year: 2025
Average income per person.
EUR 33.534
Source: AllNumbers
Crimes (current year)
457
Total registered
| Year | Residents |
|---|---|
| 2021 | 12.045 |
| 2022 | 11.985 |
| 2023 | 12.040 |
| 2024 | 11.890 |
| 2025 | 12.060 |
| Year | Average WOZ |
|---|---|
| 2021 | EUR 365.299 |
| 2022 | EUR 391.262 |
| 2023 | EUR 452.138 |
| 2024 | EUR 475.662 |
| 2025 | EUR 482.032 |
Hoger
2.820
Praktisch
2.160
Middelbaar
3.650
Europa
875
Nederland
9.475
Buiten Europa
1.710
Label A
2.083
Label C
1.445
Label B
819
Label D
358
Label G
167
Label A+
155
Label F
142
Label E
127
Label A++
60
Label A+++
35
Label A++++
14
Label A+++++
11
| Year | Gas (m3) | Electricity (kWh) |
|---|---|---|
| 2020 | 1.185 | 3.145 |
| 2021 | 1.352 | 3.181 |
| 2022 | 1.054 | 2.950 |
| 2023 | 904 | 2.755 |
| 2024 | 886 | 2.802 |
Hoekwoning
Gas: 881 • Electricity: 2.633
Huurwoning
Gas: 814 • Electricity: 2.091
Koopwoning
Gas: 943 • Electricity: 3.044
Appartement
Gas: 637 • Electricity: 1.886
Tussenwoning
Gas: 806 • Electricity: 2.586
Vrijstaande woning
Gas: 1.328 • Electricity: 4.135
Twee-onder-één-kap woning
Gas: 1.152 • Electricity: 3.234
Total number of company establishments: 2.240
| Period | Crimes |
|---|---|
| jan 2025 | 52 |
| jan 2026 | 33 |
| jul 2025 | 42 |
| jun 2025 | 32 |
| mei 2025 | 34 |
| mrt 2025 | 45 |
| nov 2024 | 33 |
| nov 2025 | 35 |
| okt 2024 | 36 |
| okt 2025 | 51 |
| sep 2024 | 43 |
| sep 2025 | 37 |
These figures give an indicative picture of safety trends in the living environment of Bleiswijk.
Short answers based on current local statistics, handy for a quick comparison of the living environment.
Bleiswijk telt in 2025 ongeveer 12.060 inwoners.
De gemiddelde WOZ-waarde in Bleiswijk is in 2025 circa € 482.032.
Het gemiddelde inkomen per inwoner in Bleiswijk ligt rond € 33.534 per jaar.
Voor het huidige jaar gaat het om ongeveer 457 geregistreerde misdrijven. Gebruik deze cijfers als indicatie en vergelijk trends per periode.
In Bleiswijk komt vooral "Tussenwoningen" veel voor, met ongeveer 2.152 woningen.