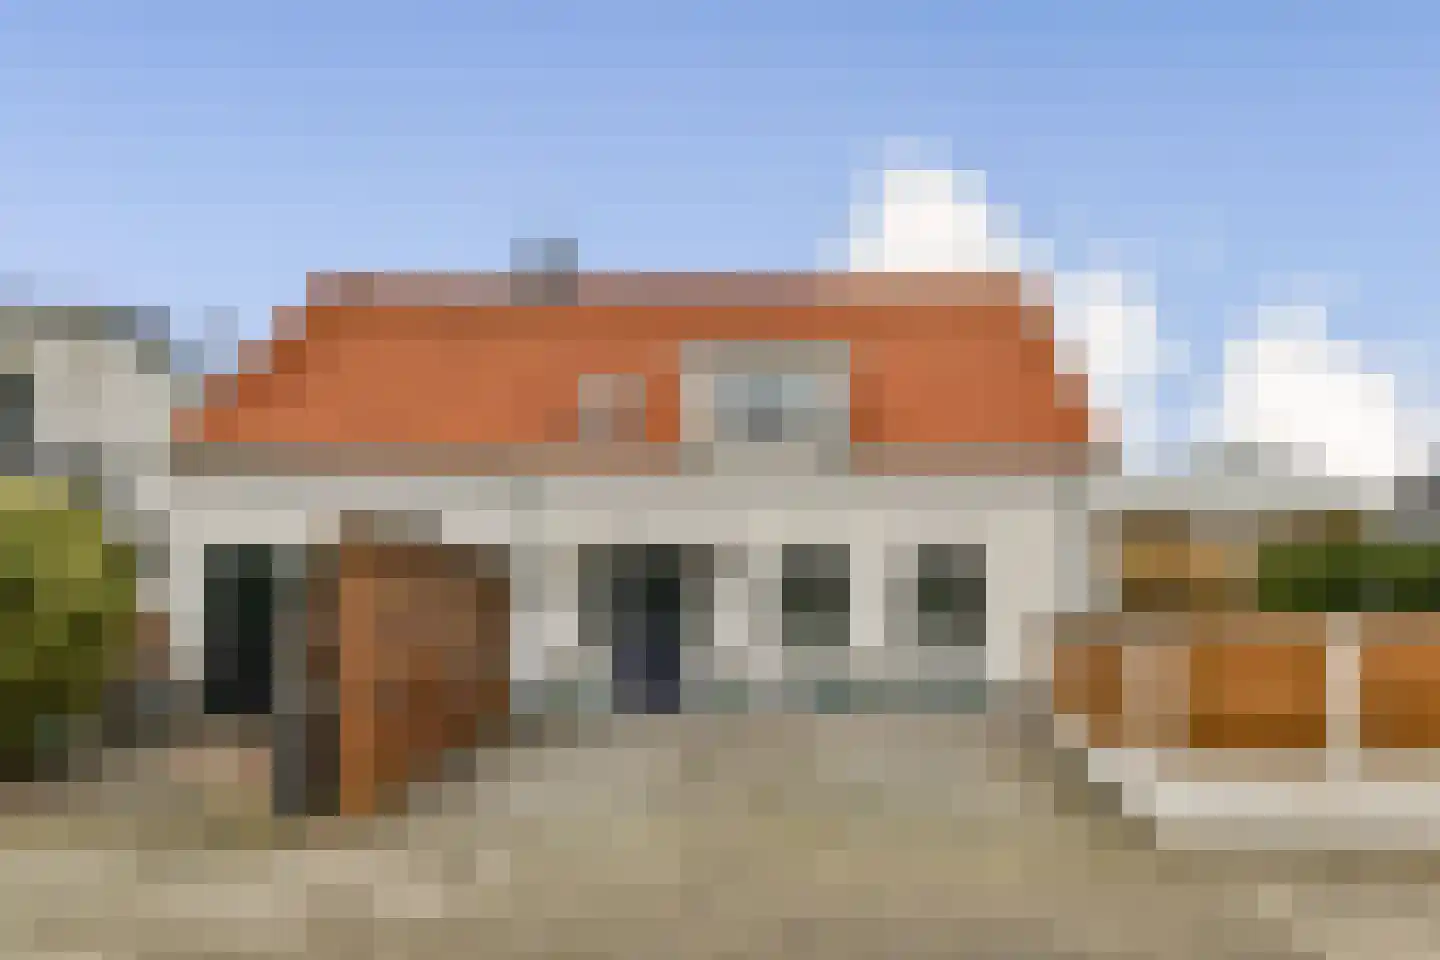
Houses sold in Bleiswijk

View 86 sold houses in Bleiswijk

Connected to: Vastgoed Nederland NVM Makelaars

On this page you will find recently sold homes in Bleiswijk. Use this overview to better estimate selling prices, popular neighborhoods, and the local housing supply before you choose a real estate agent. Also view the current housing supply with 121 houses in Bleiswijk.

Selection

Search and filter homes

Set your preferences and discover homes that suit you.

Total supply 242.874
Filters

Set price, area and other characteristics. Adjust a filter or click on Show homes. Location changes directly above.

Reset filters

You search for

  • Place Bleiswijk
  • Status Sold

Huis verkopen in Bleiswijk? Vergelijk verkoopmakelaars

Bekijk recente verkopen en ontvang gratis offertes van lokale makelaars. Vergelijk meer dan 140 makelaars in Bleiswijk.

Free request a quote

  • Quotes in Bleiswijk
  • Non-binding
  • Personal
  • Compare free rates

Recent verkocht in Bleiswijk? Lees de verkoopgerichte gids huis verkopen in Bleiswijk, vergelijk verkoopmakelaars in Bleiswijk of bekijk de beste verkoopmakelaars in Bleiswijk voor referentie bij jouw keuze.

Vergelijk meerdere offertes

Makelaars maken scherpere voorstellen als ze weten dat je vergelijkt — vraag offertes aan voor verkoop of aankoop.

Frequently asked questions about sold homes in Bleiswijk

Short answers about housing prices, sold homes and comparing real estate agents in Bleiswijk.

Residential and neighborhood statistics in Bleiswijk

View current location data on residents, WOZ development, housing stock, energy consumption, business activity and safety in Bleiswijk. In 2025 were there 12.060 residents. The average WOZ value in 2025 is EUR 482.032.

These figures help to better assess and compare the housing stock in Bleiswijk with recent sold homes. Orient yourself then on suitable top real estate agents in Bleiswijk for sales advice in this region.

Residents

12.060

Last year: 2025

Average WOZ

EUR 482.032

Last year: 2025

Average income per person.

EUR 33.534

Source: AllNumbers

Crimes (current year)

457

Total registered

Demographics and WOZ development

Inhabitants per year

Inhabitants per year in Bleiswijk
Year Residents
2021 12.045
2022 11.985
2023 12.040
2024 11.890
2025 12.060

Annual WOZ value

WOZ value per year in Bleiswijk
Year Average WOZ
2021 EUR 365.299
2022 EUR 391.262
2023 EUR 452.138
2024 EUR 475.662
2025 EUR 482.032

Composition of residents

Age build-up

65+: 2.620 0-15: 2.110 15-25: 1.415 25-45: 2.560 45-65: 3.350

Education level

Hoger

2.820

Praktisch

2.160

Middelbaar

3.650

Origin of residents (2025)

Europa

875

Nederland

9.475

Buiten Europa

1.710

Housing stock and construction periods

Types of homes

Hoekwoningen 967
Appartementen 821
Tussenwoningen 2.152
Vrijstaande woningen 815
Twee-onder-één-kap woningen 262

Construction period of buildings

Voor 1700 1
1700 tot 1900 56
1900 tot 1925 67
1925 tot 1950 159
1950 tot 1970 940
1970 tot 1980 1.166
1980 tot 1990 738
1990 tot 2000 713
2000 tot 2010 605
2010 tot 2020 406
2020 en later 147

Energy and sustainability

Energy label distribution

Label A

2.083

Label C

1.445

Label B

819

Label D

358

Label G

167

Label A+

155

Label F

142

Label E

127

Label A++

60

Label A+++

35

Label A++++

14

Label A+++++

11

Average energy consumption per year

Average energy consumption per year in Bleiswijk
Year Gas (m3) Electricity (kWh)
2020 1.185 3.145
2021 1.352 3.181
2022 1.054 2.950
2023 904 2.755
2024 886 2.802

Consumption per house type

Hoekwoning

Gas: 881 • Electricity: 2.633

Huurwoning

Gas: 814 • Electricity: 2.091

Koopwoning

Gas: 943 • Electricity: 3.044

Appartement

Gas: 637 • Electricity: 1.886

Tussenwoning

Gas: 806 • Electricity: 2.586

Vrijstaande woning

Gas: 1.328 • Electricity: 4.135

Twee-onder-één-kap woning

Gas: 1.152 • Electricity: 3.234

Business activity in Bleiswijk (2025)

Handel en HORECA 415
Nijverheid en energie 320
Zakelijke dienstverlening 580
Overheid, onderwijs en zorg 260
Landbouw, bosbouw en visserij 205
Vervoer, informatie en communicatie 165
Financiele diensten en onroerendgoed 150
Cultuur, recreatie en overige diensten 155

Total number of company establishments: 2.240

Recent crime statistics

Recent crime statistics in Bleiswijk
Period Crimes
jan 2025 52
jan 2026 33
jul 2025 42
jun 2025 32
mei 2025 34
mrt 2025 45
nov 2024 33
nov 2025 35
okt 2024 36
okt 2025 51
sep 2024 43
sep 2025 37

These figures give an indicative picture of safety trends in the living environment of Bleiswijk.

Frequently asked questions about living in Bleiswijk

Short answers based on current local statistics, handy for a quick comparison of the living environment.

Hoeveel inwoners heeft Bleiswijk?

Bleiswijk telt in 2025 ongeveer 12.060 inwoners.

Wat is de gemiddelde WOZ-waarde in Bleiswijk?

De gemiddelde WOZ-waarde in Bleiswijk is in 2025 circa € 482.032.

Wat is het gemiddelde inkomen per inwoner in Bleiswijk?

Het gemiddelde inkomen per inwoner in Bleiswijk ligt rond € 33.534 per jaar.

Hoe veilig is wonen in Bleiswijk?

Voor het huidige jaar gaat het om ongeveer 457 geregistreerde misdrijven. Gebruik deze cijfers als indicatie en vergelijk trends per periode.

Welke woningtypen komen het meest voor in Bleiswijk?

In Bleiswijk komt vooral "Tussenwoningen" veel voor, met ongeveer 2.152 woningen.

Receive free, non-binding quotes

Compare multiple real estate agents and choose the best match.