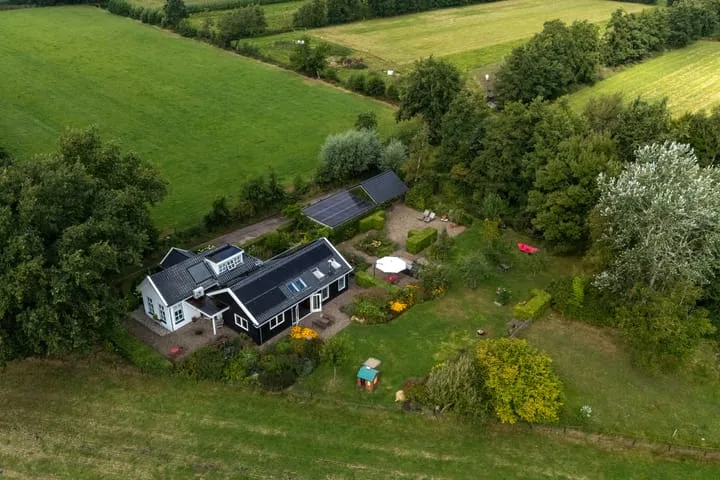
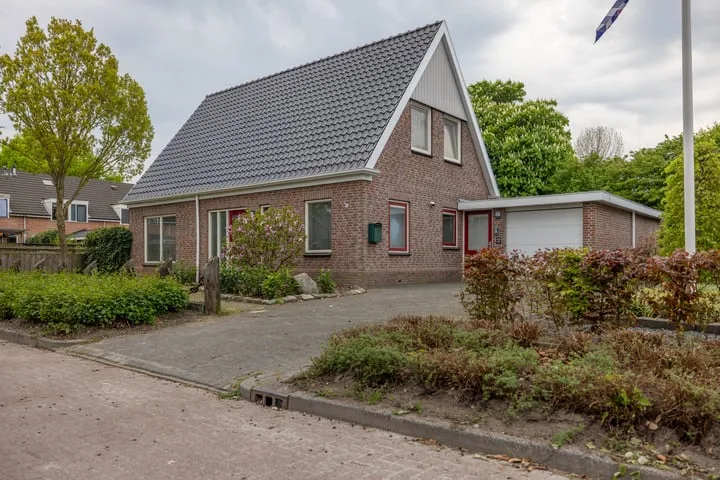
Houses sold in Boelenslaan

View 8 sold houses in Boelenslaan

Connected to: Vastgoed Nederland NVM Makelaars

On this page you will find recently sold homes in Boelenslaan. Use this overview to better estimate selling prices, popular neighborhoods, and the local housing supply before you choose a real estate agent. Also view the current housing supply with 16 houses in Boelenslaan.

Selection

Search and filter homes

Set your preferences and discover homes that suit you.

Total supply 242.874
Filters

Set price, area and other characteristics. Adjust a filter or click on Show homes. Location changes directly above.

Reset filters

You search for

  • Place Boelenslaan
  • Status Sold

Huis verkopen in Boelenslaan? Vergelijk verkoopmakelaars

Bekijk recente verkopen en ontvang gratis offertes van lokale makelaars. Vergelijk meer dan 32 makelaars in Boelenslaan.

Free request a quote

  • Quotes in Boelenslaan
  • Non-binding
  • Personal
  • Compare free rates

Zelf je woning verkopen in Boelenslaan? Vergelijk verkoopmakelaars in Boelenslaan of bekijk de beste verkoopmakelaars in Boelenslaan als referentie bij jouw keuze.

Vergelijk meerdere offertes

Makelaars maken scherpere voorstellen als ze weten dat je vergelijkt — vraag offertes aan voor verkoop of aankoop.

Frequently asked questions about sold homes in Boelenslaan

Short answers about housing prices, sold homes and comparing real estate agents in Boelenslaan.

Residential and neighborhood statistics in Boelenslaan

View current location data on residents, WOZ development, housing stock, energy consumption, business activity and safety in Boelenslaan. In 2025 were there 1.205 residents. The average WOZ value in 2025 is EUR 347.538.

These figures help to better assess and compare the housing stock in Boelenslaan with recent sold homes. Orient yourself then on suitable top real estate agents in Boelenslaan for sales advice in this region.

Residents

1.205

Last year: 2025

Average WOZ

EUR 347.538

Last year: 2025

Average income per person.

EUR 27.254

Source: AllNumbers

Crimes (current year)

22

Total registered

Demographics and WOZ development

Inhabitants per year

Inhabitants per year in Boelenslaan
Year Residents
2021 1.195
2022 1.215
2023 1.200
2024 1.205
2025 1.205

Annual WOZ value

WOZ value per year in Boelenslaan
Year Average WOZ
2021 EUR 243.530
2022 EUR 268.563
2023 EUR 303.319
2024 EUR 320.487
2025 EUR 347.538

Composition of residents

Age build-up

65+: 250 0-15: 190 15-25: 155 25-45: 255 45-65: 355

Education level

Hoger

100

Praktisch

230

Middelbaar

460

Origin of residents (2025)

Europa

30

Nederland

1.140

Buiten Europa

30

Housing stock and construction periods

Types of homes

Hoekwoningen 53
Appartementen 19
Tussenwoningen 61
Vrijstaande woningen 312
Twee-onder-één-kap woningen 67

Construction period of buildings

Voor 1700 0
1700 tot 1900 8
1900 tot 1925 37
1925 tot 1950 93
1950 tot 1970 103
1970 tot 1980 79
1980 tot 1990 42
1990 tot 2000 56
2000 tot 2010 41
2010 tot 2020 28
2020 en later 29

Energy and sustainability

Energy label distribution

Label G

103

Label C

96

Label B

95

Label A

77

Label D

46

Label F

46

Label E

37

Label A+++

5

Label A+

3

Label A++

3

Label A++++

3

Label A+++++

0

Average energy consumption per year

Average energy consumption per year in Boelenslaan
Year Gas (m3) Electricity (kWh)
2020 1.559 3.267
2021 1.738 3.378
2022 1.331 3.160
2023 1.083 2.944
2024 1.028 3.066

Consumption per house type

Hoekwoning

Gas: 647 • Electricity: 1.444

Huurwoning

Gas: 1.026 • Electricity: 2.219

Koopwoning

Gas: 1.100 • Electricity: 3.198

Appartement

Gas: 421 • Electricity: 1.149

Tussenwoning

Gas: 615 • Electricity: 1.049

Vrijstaande woning

Gas: 1.151 • Electricity: 3.289

Twee-onder-één-kap woning

Gas: 1.159 • Electricity: 2.958

Business activity in Boelenslaan (2025)

Handel en HORECA 20
Nijverheid en energie 35
Zakelijke dienstverlening 25
Overheid, onderwijs en zorg 20
Landbouw, bosbouw en visserij 15
Vervoer, informatie en communicatie 5
Financiele diensten en onroerendgoed 5
Cultuur, recreatie en overige diensten 15

Total number of company establishments: 145

Recent crime statistics

Recent crime statistics in Boelenslaan
Period Crimes
jan 2025 1
jan 2026 0
jul 2025 1
jun 2025 2
mei 2025 5
mrt 2025 0
nov 2024 2
nov 2025 0
okt 2024 2
okt 2025 6
sep 2024 1
sep 2025 1

These figures give an indicative picture of safety trends in the living environment of Boelenslaan.

Frequently asked questions about living in Boelenslaan

Short answers based on current local statistics, handy for a quick comparison of the living environment.

Hoeveel inwoners heeft Boelenslaan?

Boelenslaan telt in 2025 ongeveer 1.205 inwoners.

Wat is de gemiddelde WOZ-waarde in Boelenslaan?

De gemiddelde WOZ-waarde in Boelenslaan is in 2025 circa € 347.538.

Wat is het gemiddelde inkomen per inwoner in Boelenslaan?

Het gemiddelde inkomen per inwoner in Boelenslaan ligt rond € 27.254 per jaar.

Hoe veilig is wonen in Boelenslaan?

Voor het huidige jaar gaat het om ongeveer 22 geregistreerde misdrijven. Gebruik deze cijfers als indicatie en vergelijk trends per periode.

Welke woningtypen komen het meest voor in Boelenslaan?

In Boelenslaan komt vooral "Vrijstaande woningen" veel voor, met ongeveer 312 woningen.

Receive free, non-binding quotes

Compare multiple real estate agents and choose the best match.