
Residents
5.575
Last year: 2025
9104BK Damwâld • Fryslân

For this property, no detailed description is available yet.
€ 349.500
Cost of copper (estimated): € 8.840
2% transfer tax (€ 6.990) + notary (€ 1.150) + valuation (€ 700)
Total purchase (incl. p.p.): € 358.340
2,78%
Yearly
€ 17.475
Direct available
Estimated mortgage
Indicative gross monthly cost
Based on annuity and 30 year term
Indicative net monthly cost
iDisclaimer: this mortgage calculation is a simplified indication based on general assumptions. No rights can be derived from the results shown. Calculated with 10-annual interest (met NHG), automatically determined based on the price limit € 470.000. Source: 10-jaars rente uit mortgage_rates (04-05-2026 03:45).
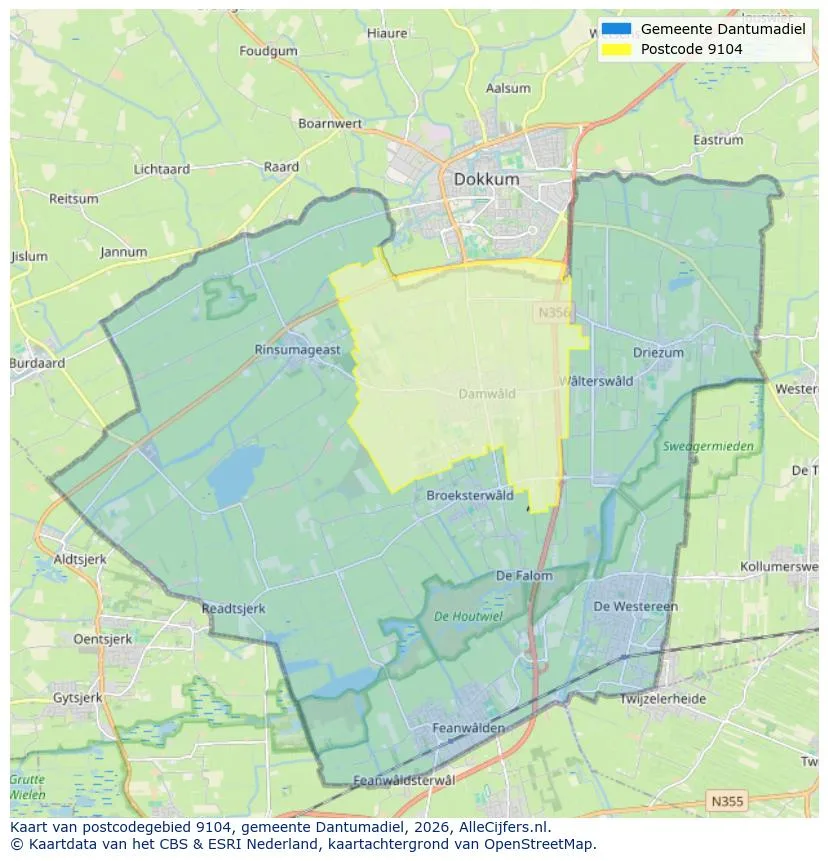
Geographic orientation and real estate agent density in Damwâld
View current location data on residents, WOZ development, housing stock, energy consumption, business activity and safety in Damwâld. In 2025 were there 5.575 residents. The average WOZ value in 2025 is EUR 316.000.
Residents
5.575
Last year: 2025
Average WOZ
EUR 316.000
Last year: 2025
Average income per person.
EUR 27.200
Source: AllNumbers
Crimes (current year)
90
Total registered
| Year | Residents |
|---|---|
| 2021 | 5.510 |
| 2022 | 5.530 |
| 2023 | 5.665 |
| 2024 | 5.605 |
| 2025 | 5.575 |
| Year | Average WOZ |
|---|---|
| 2021 | EUR 212.000 |
| 2022 | EUR 245.000 |
| 2023 | EUR 293.000 |
| 2024 | EUR 306.000 |
| 2025 | EUR 316.000 |
Hoger
700
Praktisch
1.150
Middelbaar
2.110
Europa
160
Nederland
5.215
Buiten Europa
200
Label C
588
Label B
440
Label A
438
Label G
336
Label D
280
Label F
161
Label E
123
Label A+
27
Label A+++
19
Label A++
8
Label A++++
8
Label A+++++
1
| Year | Gas (m3) | Electricity (kWh) |
|---|---|---|
| 2020 | 1.420 | 2.530 |
| 2021 | 1.600 | 2.560 |
| 2022 | 1.250 | 2.370 |
| 2023 | 1.010 | 2.350 |
| 2024 | 980 | 2.460 |
Hoekwoning
Gas: 920 • Electricity: 1.830
Huurwoning
Gas: 890 • Electricity: 1.600
Koopwoning
Gas: 1.080 • Electricity: 2.740
Appartement
Gas: 780 • Electricity: 1.650
Tussenwoning
Gas: 920 • Electricity: 1.730
Vrijstaande woning
Gas: 1.120 • Electricity: 2.810
Twee-onder-één-kap woning
Gas: 970 • Electricity: 2.350
Total number of company establishments: 570
| Period | Crimes |
|---|---|
| jan 2025 | 9 |
| jan 2026 | 10 |
| jul 2025 | 10 |
| jun 2025 | 4 |
| mei 2025 | 8 |
| mrt 2025 | 6 |
| nov 2024 | 7 |
| nov 2025 | 9 |
| okt 2024 | 5 |
| okt 2025 | 10 |
| sep 2024 | 9 |
| sep 2025 | 5 |
These figures give an indicative picture of safety trends in the living environment of Damwâld.
Short answers based on current local statistics, handy for a quick comparison of the living environment.
Damwâld telt in 2025 ongeveer 5.575 inwoners.
De gemiddelde WOZ-waarde in Damwâld is in 2025 circa € 316.000.
Het gemiddelde inkomen per inwoner in Damwâld ligt rond € 27.200 per jaar.
Voor het huidige jaar gaat het om ongeveer 90 geregistreerde misdrijven. Gebruik deze cijfers als indicatie en vergelijk trends per periode.
In Damwâld komt vooral "Vrijstaande woningen" veel voor, met ongeveer 1.150 woningen.
View more homes in this location.

9104HB Damwâld
€ 319.500 k.k.

9104HV Damwâld
€ 549.500 k.k.
€ 3.790/m²

9104DE Damwâld
€ 385.000 k.k.
€ 4.529/m²

9104ED Damwâld
€ 299.500 k.k.
€ 3.153/m²

9104BR Damwâld
€ 475.000 k.k.
€ 3.740/m²

9104EP Damwâld
€ 335.000 k.k.
€ 5.000/m²

9104CG Damwâld
€ 335.000 k.k.
€ 3.317/m²

9104HL Damwâld
€ 350.000 k.k.
€ 2.413/m²
