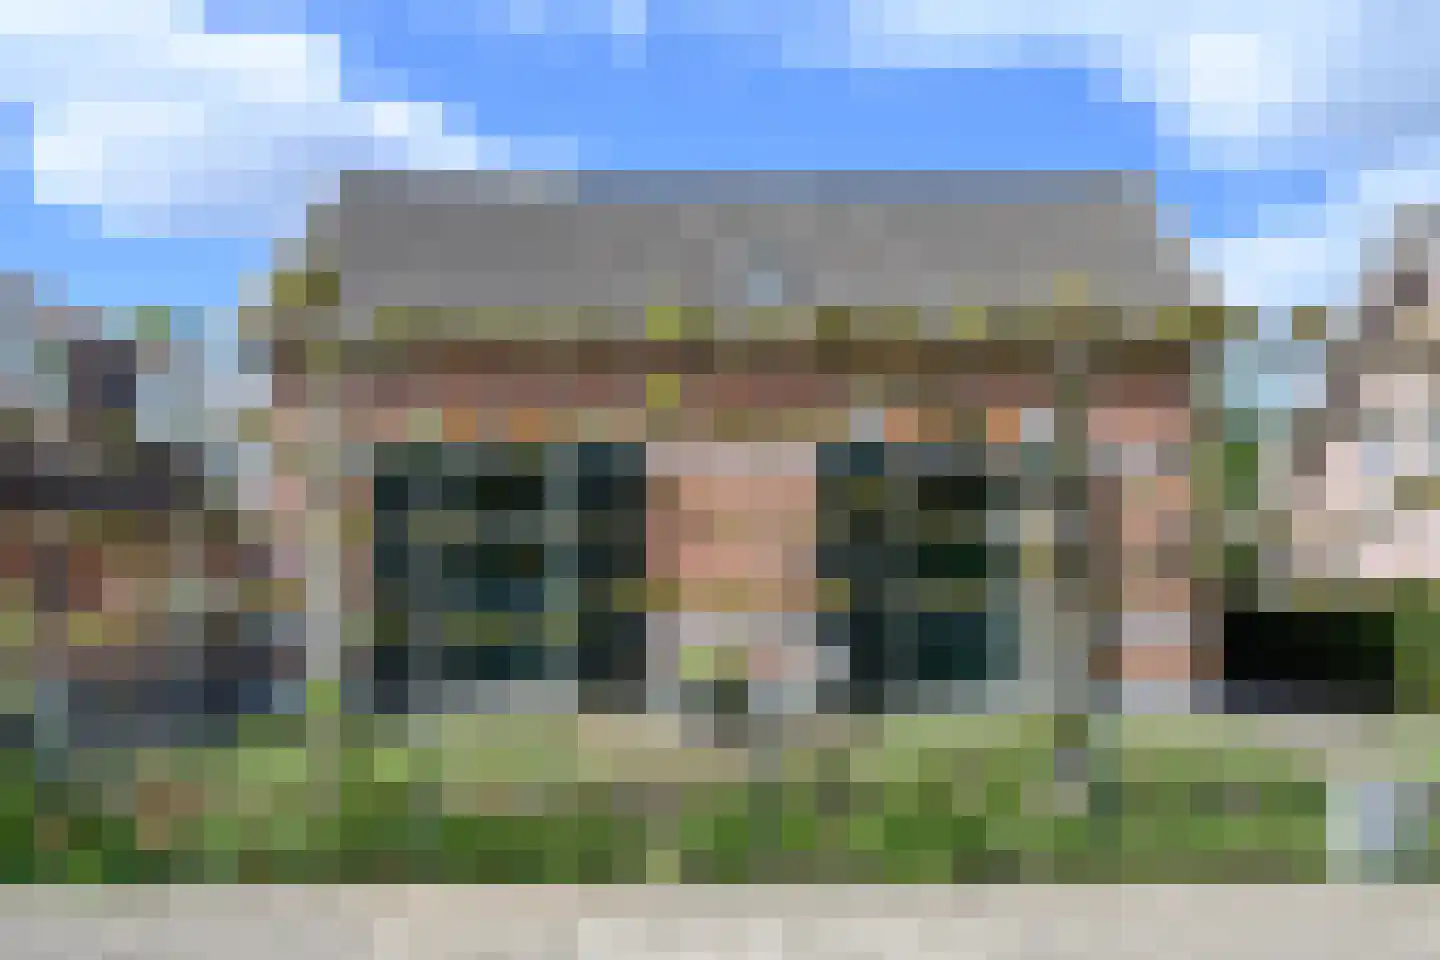
- Available
Parkweg 3
6994CM De Steeg
€ 425.000 k.k.
€ 4.167/m²
- Living area
- 102 m²
- Land area
- 249 m²
- Bedrooms
- 3
Searching in 12 houses in De Steeg
Type to search. Use arrow down and arrow up to navigate through results and press Enter to open.
Hidden search suggestions.
View current properties in De Steeg or search targeted on street, postal code and property characteristics.
View the current housing stock in De Steeg and quickly filter by price, living area, rooms and more. There are currently 12 houses in this place within our selection. View also 7 sold houses in De Steeg for extra insight into the local housing market.
6994CM De Steeg
€ 425.000 k.k.
€ 4.167/m²
6994CB De Steeg
€ 895.000 k.k.
€ 3.714/m²
6994AM De Steeg
€ 399.000 k.k.
€ 3.531/m²
6994AE De Steeg
€ 1.300.000 k.k.
€ 1.410/m²
6994CP De Steeg
€ 695.000 k.k.
€ 4.964/m²
6994CP De Steeg
€ 1.295.000 k.k.
€ 5.860/m²
6994AK De Steeg
€ 675.000 k.k.
€ 3.461/m²
6994BD De Steeg
€ 375.000 k.k.
€ 2.757/m²
6994AN De Steeg
€ 450.000 k.k.
€ 0/m²
6994BJ De Steeg
€ 875.000 k.k.
€ 2.581/m²
6994AX De Steeg
€ 549.000 k.k.
€ 5.659/m²
6994AX De Steeg
€ 509.000 k.k.
€ 5.302/m²
Get free quotes from real estate agents with local market knowledge. Compare more than 38 real estate agents in De Steeg.
Selling a home in De Steeg? Compare all real estate agents in De Steeg or view the top 10 real estate agents in De Steeg for extra context for your choice.
Real estate agents make sharper offers when they know you're comparing — ask for quotes for sale or purchase.
Practical answers about housing supply, sales and comparing real estate agents in De Steeg.
The costs of a real estate agent in De Steeg depend on commission, setup costs, property presentation and the chosen service. Compare the 38 real estate agents in De Steeg via the real estate agent page and request multiple quotes to compare rates and approach well.
Within our selection, we are currently showing 12 houses in De Steeg. View also the sold houses in De Steeg to compare the current offering with recent transactions.
Take into account not only price and living area but also maintenance, energy label, location, outdoor space and sales status. This way you compare houses in De Steeg on more than just the asking price.
A local real estate agent knows the neighborhoods, recent transactions and demand in De Steeg. By comparing 38 real estate agents in the region you get a better insight into prices, sales strategy and expected yield; the top 10 in De Steeg provides a useful starting point.
Yes, when making a sales plan, a valuation in De Steeg is wise. You gain insight into a realistic asking price and can then compare offers from real estate agents specifically.
View current location data on residents, WOZ development, housing stock, energy consumption, business activity and safety in De Steeg. In 2026 were there 1.089 residents. The average WOZ value in 2025 is EUR 433.814.
These figures help to better assess and compare the housing stock in De Steeg with recent sold homes. Orient yourself then on suitable top real estate agents in De Steeg for sales advice in this region.
Residents
1.089
Last year: 2026
Average WOZ
EUR 433.814
Last year: 2025
Average income per person.
EUR 33.838
Source: AllNumbers
Crimes (current year)
27
Total registered
| Year | Residents |
|---|---|
| 2021 | 1.090 |
| 2022 | 1.085 |
| 2023 | 1.090 |
| 2024 | 1.080 |
| 2025 | 1.085 |
| 2026 | 1.089 |
| Year | Average WOZ |
|---|---|
| 2021 | EUR 293.827 |
| 2022 | EUR 325.418 |
| 2023 | EUR 391.495 |
| 2024 | EUR 419.118 |
| 2025 | EUR 433.814 |
Hoger
350
Praktisch
160
Middelbaar
260
Europa
50
Nederland
950
Buiten Europa
80
Label G
157
Label C
102
Label D
74
Label F
50
Label B
40
Label A
37
Label E
23
Label A++++
5
Label A+++
4
Label A+
2
Label A++
1
Label A+++++
0
| Year | Gas (m3) | Electricity (kWh) |
|---|---|---|
| 2020 | 1.643 | 3.250 |
| 2021 | 1.846 | 3.343 |
| 2022 | 1.441 | 3.175 |
| 2023 | 1.181 | 2.890 |
| 2024 | 1.178 | 3.029 |
Hoekwoning
Gas: 1.059 • Electricity: 2.312
Huurwoning
Gas: 964 • Electricity: 2.077
Koopwoning
Gas: 1.277 • Electricity: 3.326
Appartement
Gas: 608 • Electricity: 2.174
Tussenwoning
Gas: 912 • Electricity: 2.072
Vrijstaande woning
Gas: 1.518 • Electricity: 3.990
Twee-onder-één-kap woning
Gas: 1.166 • Electricity: 2.635
Total number of company establishments: 210
| Period | Crimes |
|---|---|
| jan 2026 | 3 |
| jul 2025 | 2 |
| jun 2025 | 1 |
| mei 2025 | 1 |
| mrt 2025 | 0 |
| mrt 2026 | 0 |
| nov 2024 | 2 |
| nov 2025 | 2 |
| okt 2024 | 0 |
| okt 2025 | 3 |
| sep 2024 | 1 |
| sep 2025 | 5 |
These figures give an indicative picture of safety trends in the living environment of De Steeg.
Short answers based on current local statistics, handy for a quick comparison of the living environment.
De Steeg telt in 2026 ongeveer 1.089 inwoners.
De gemiddelde WOZ-waarde in De Steeg is in 2025 circa € 433.814.
Het gemiddelde inkomen per inwoner in De Steeg ligt rond € 33.838 per jaar.
Voor het huidige jaar gaat het om ongeveer 27 geregistreerde misdrijven. Gebruik deze cijfers als indicatie en vergelijk trends per periode.
In De Steeg komt vooral "Twee-onder-één-kap woningen" veel voor, met ongeveer 172 woningen.