- Available
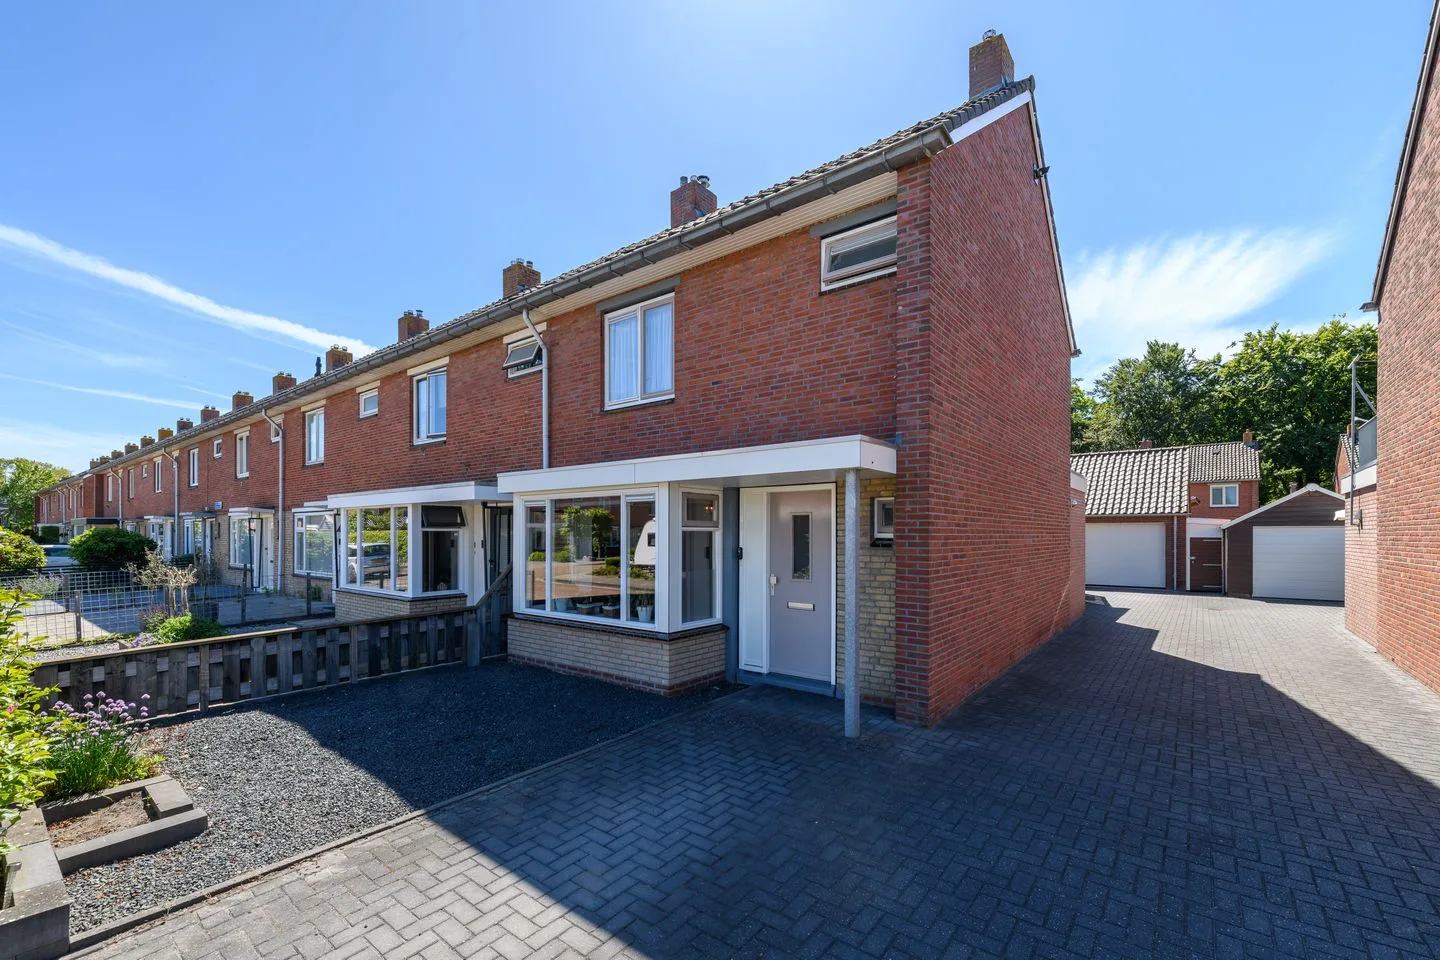
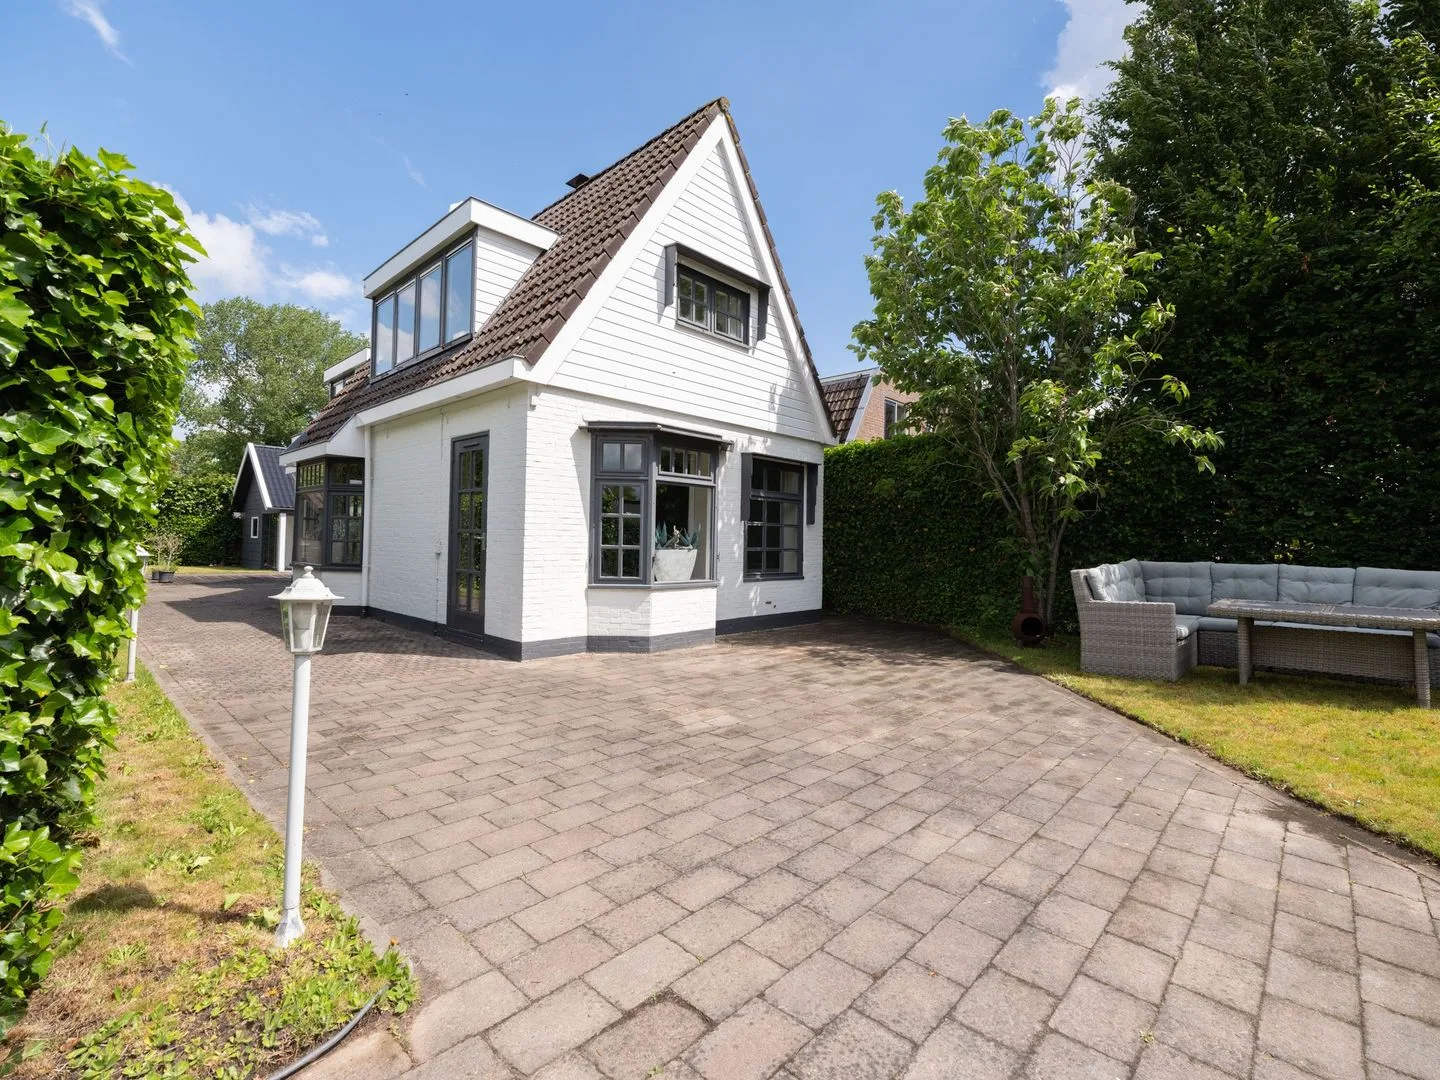
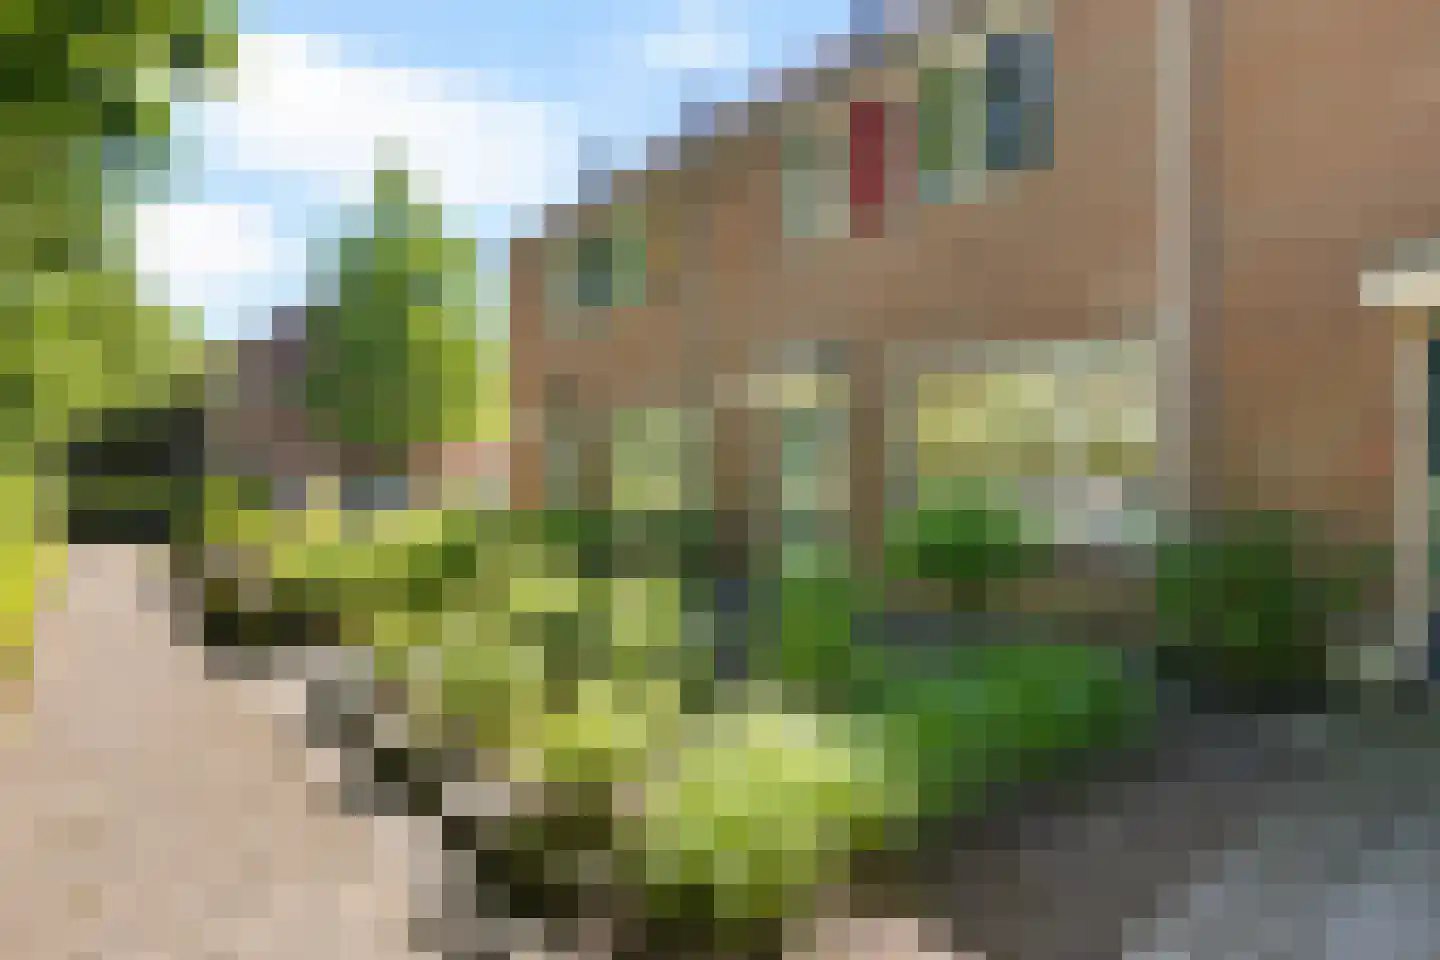
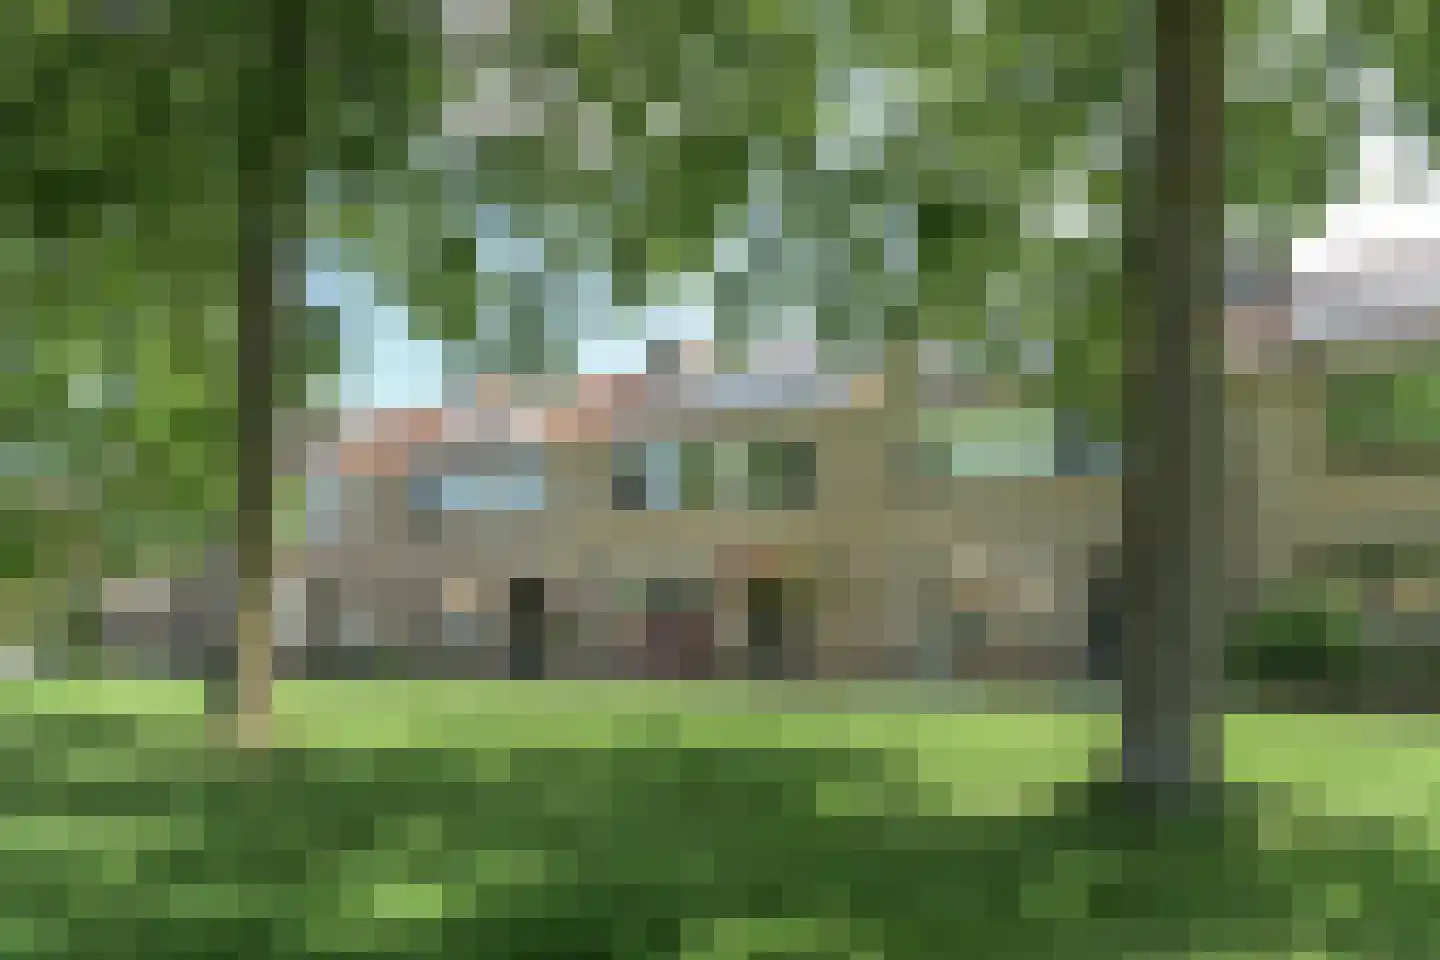
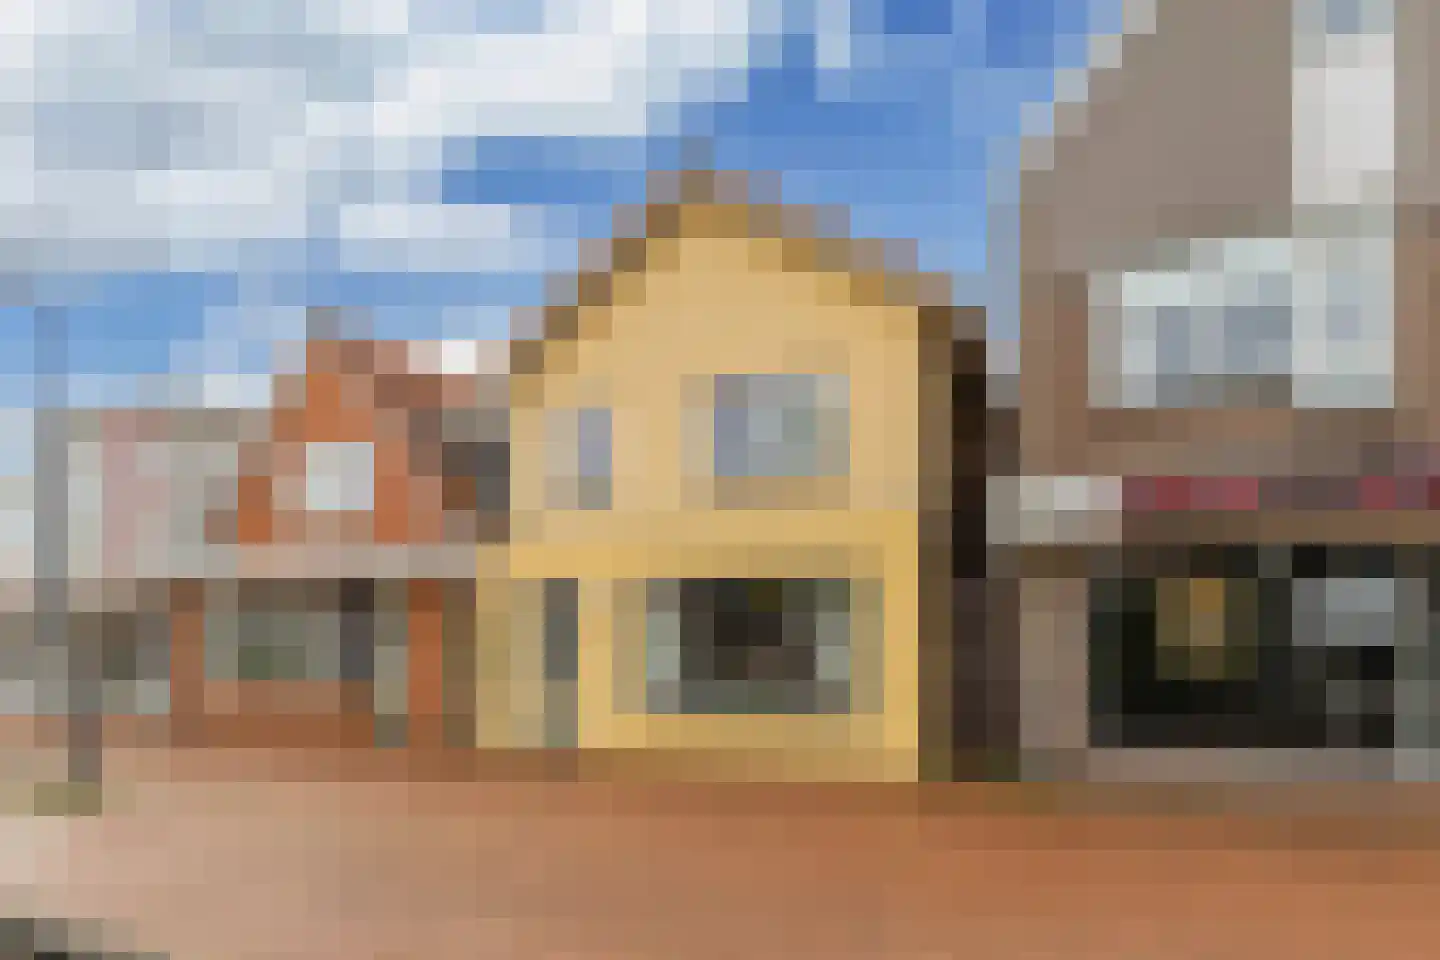
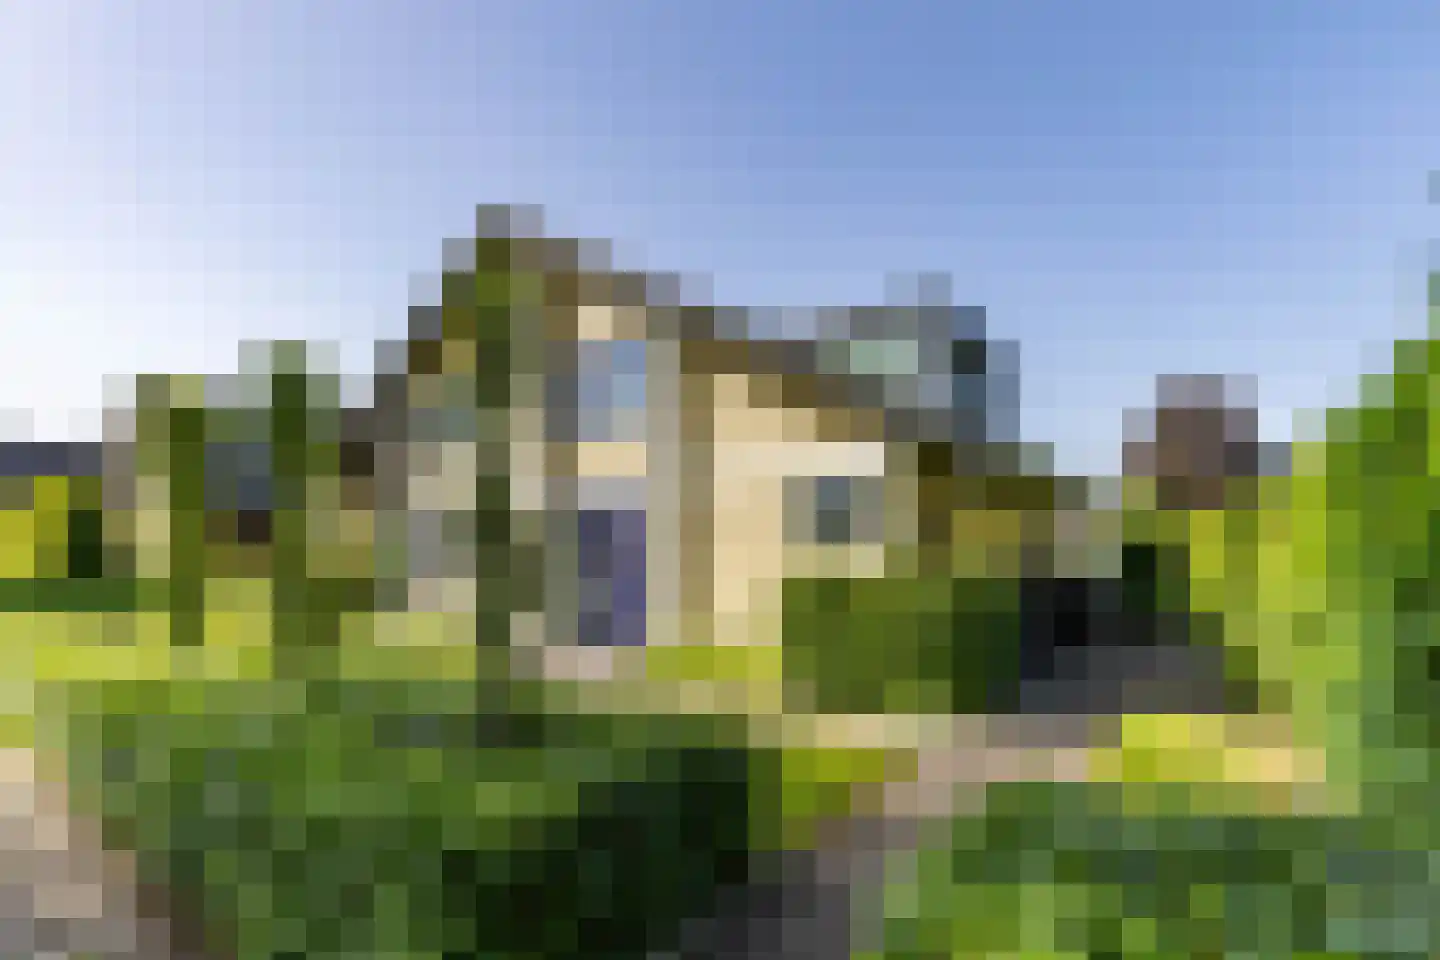
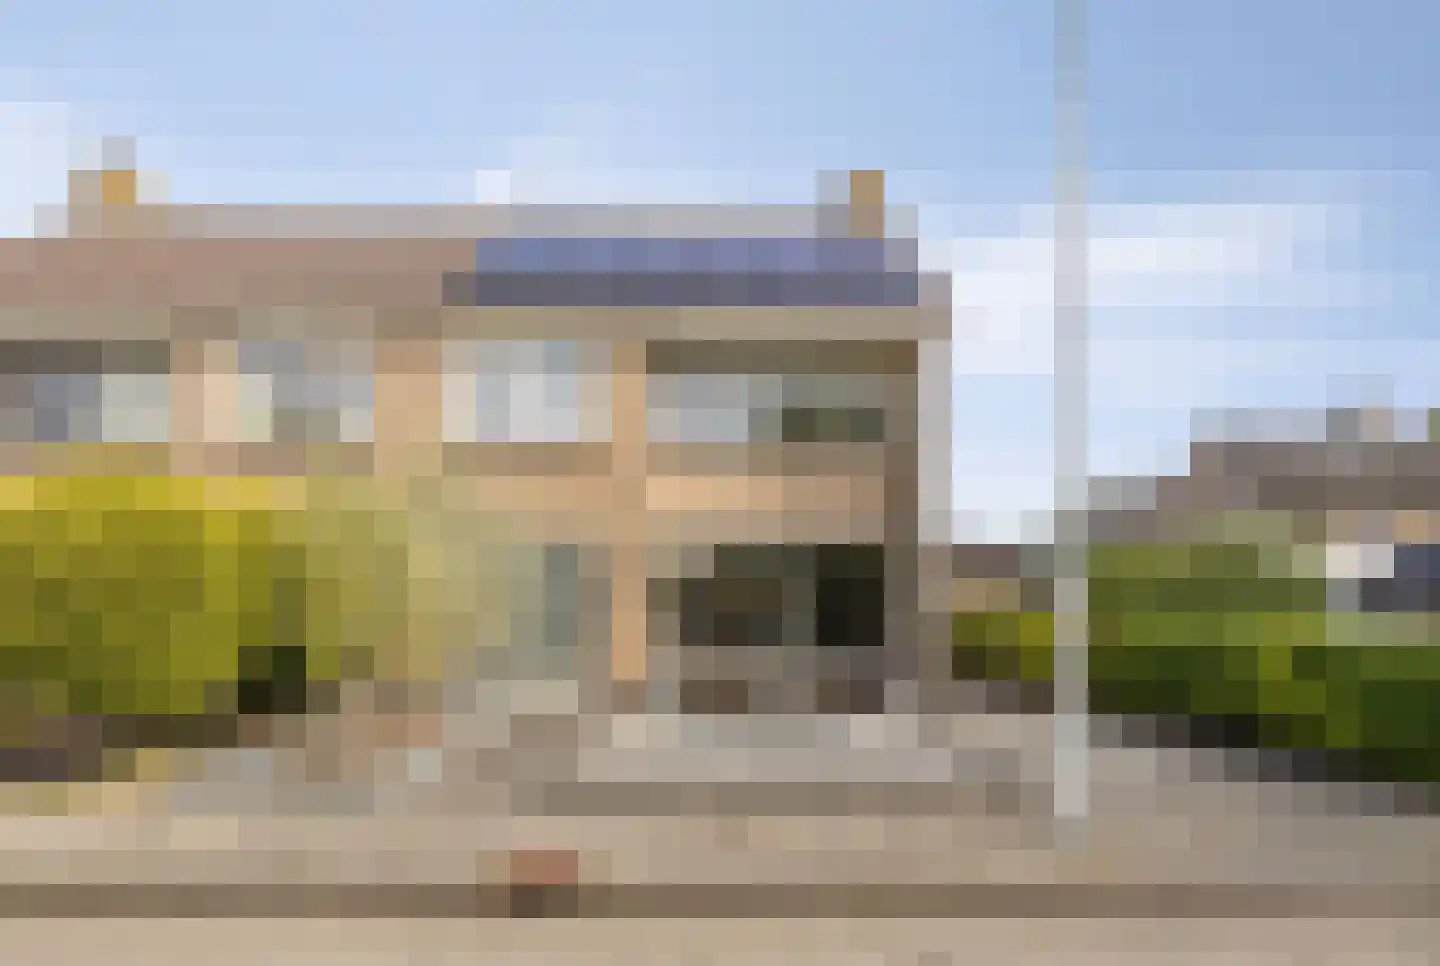
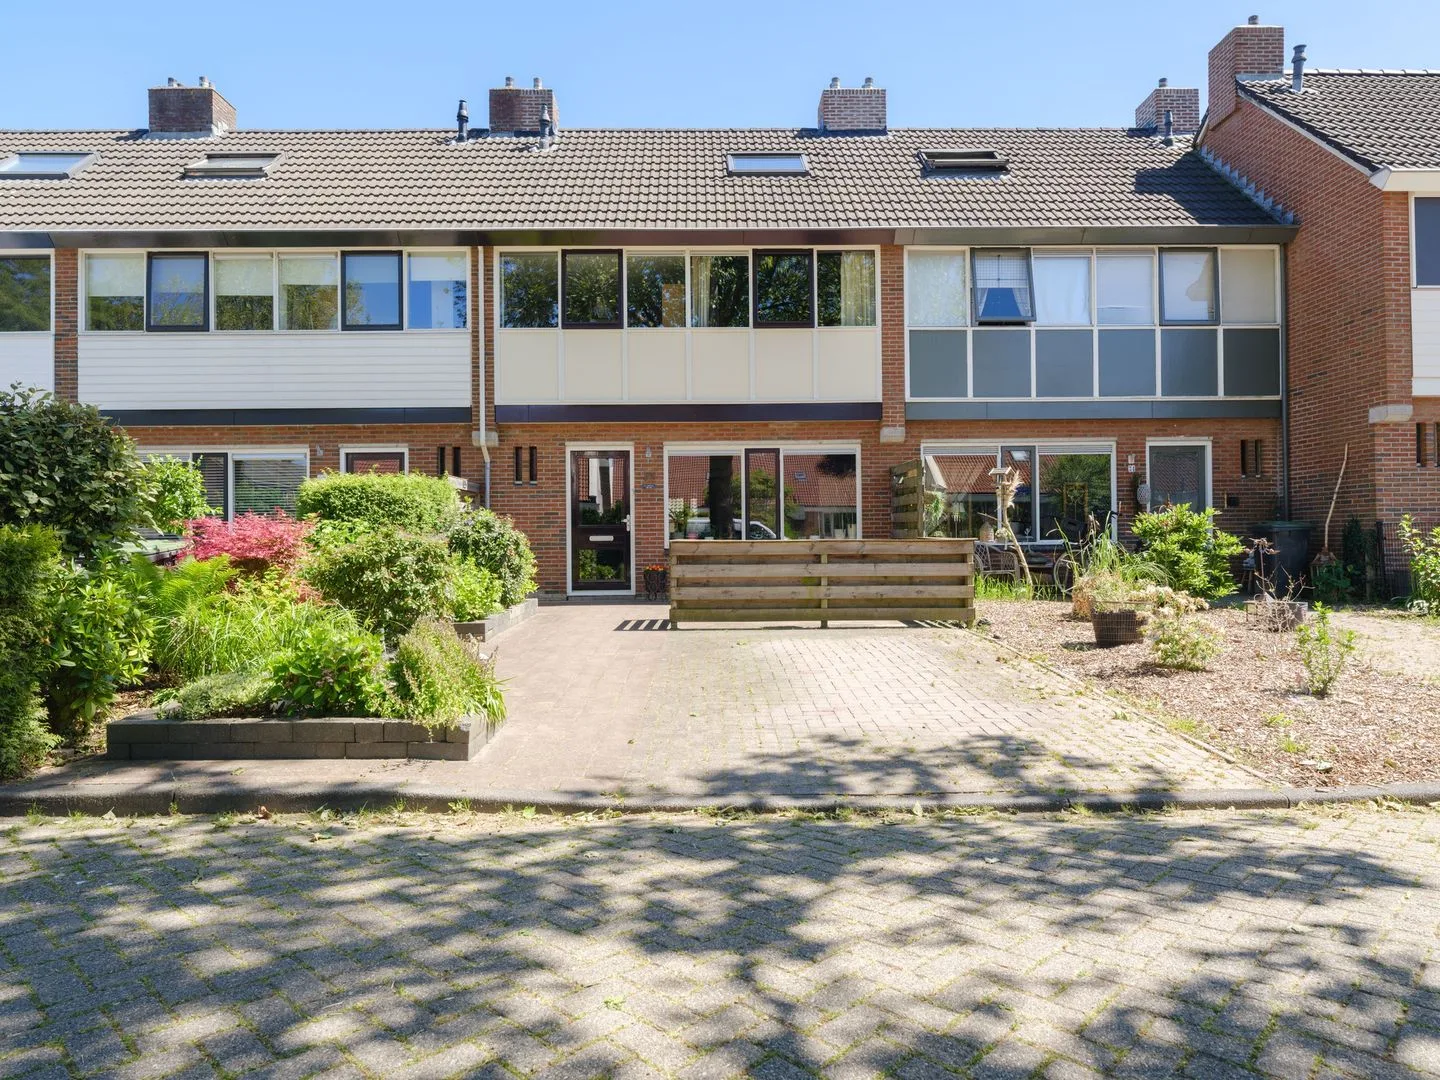
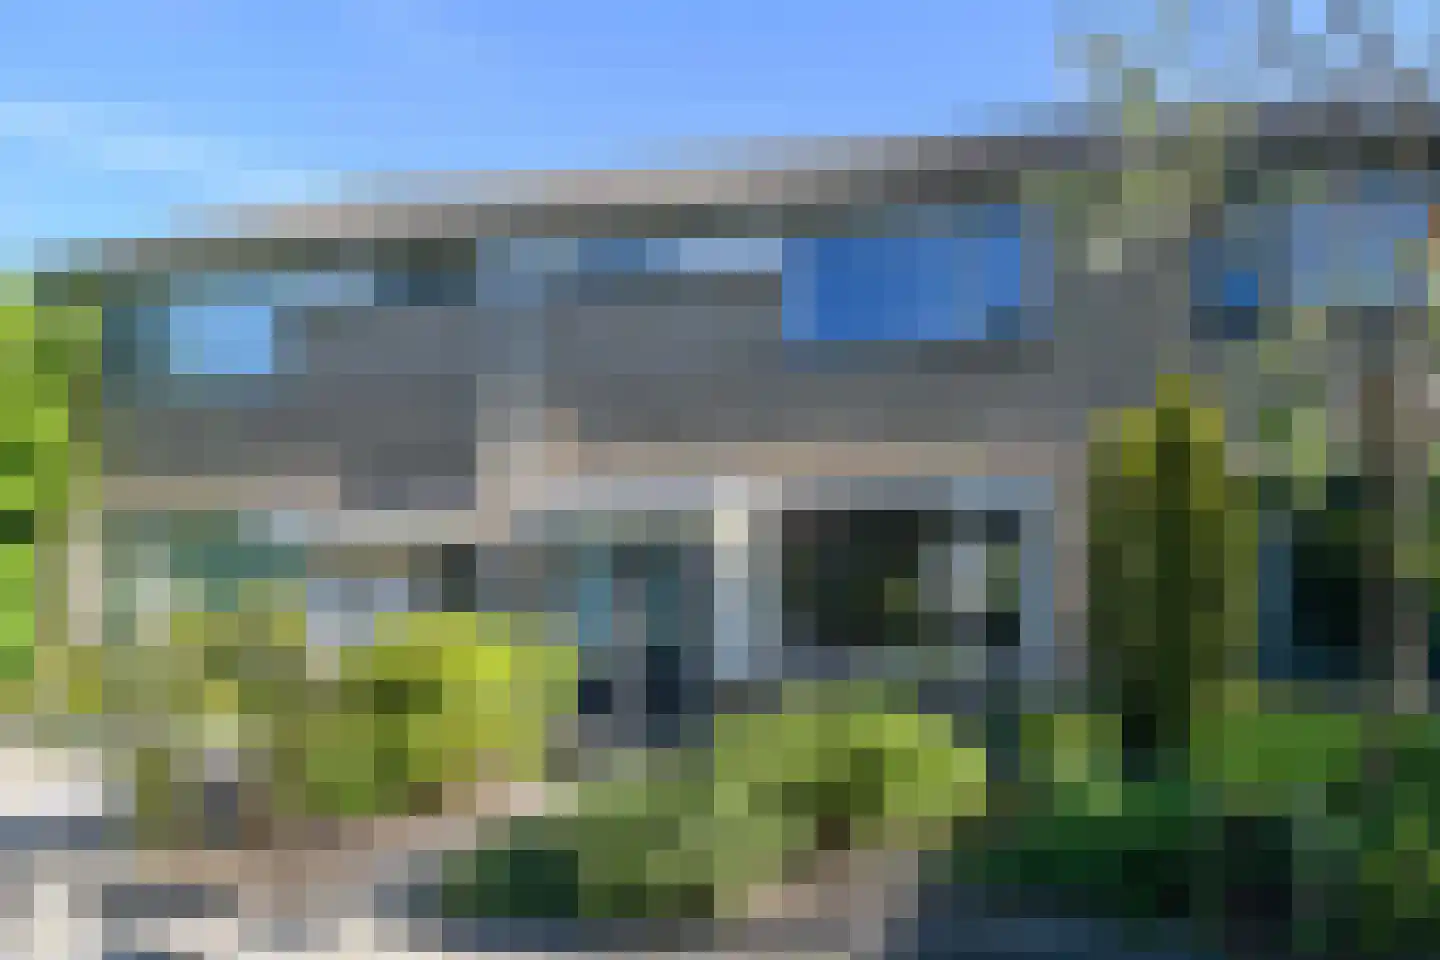
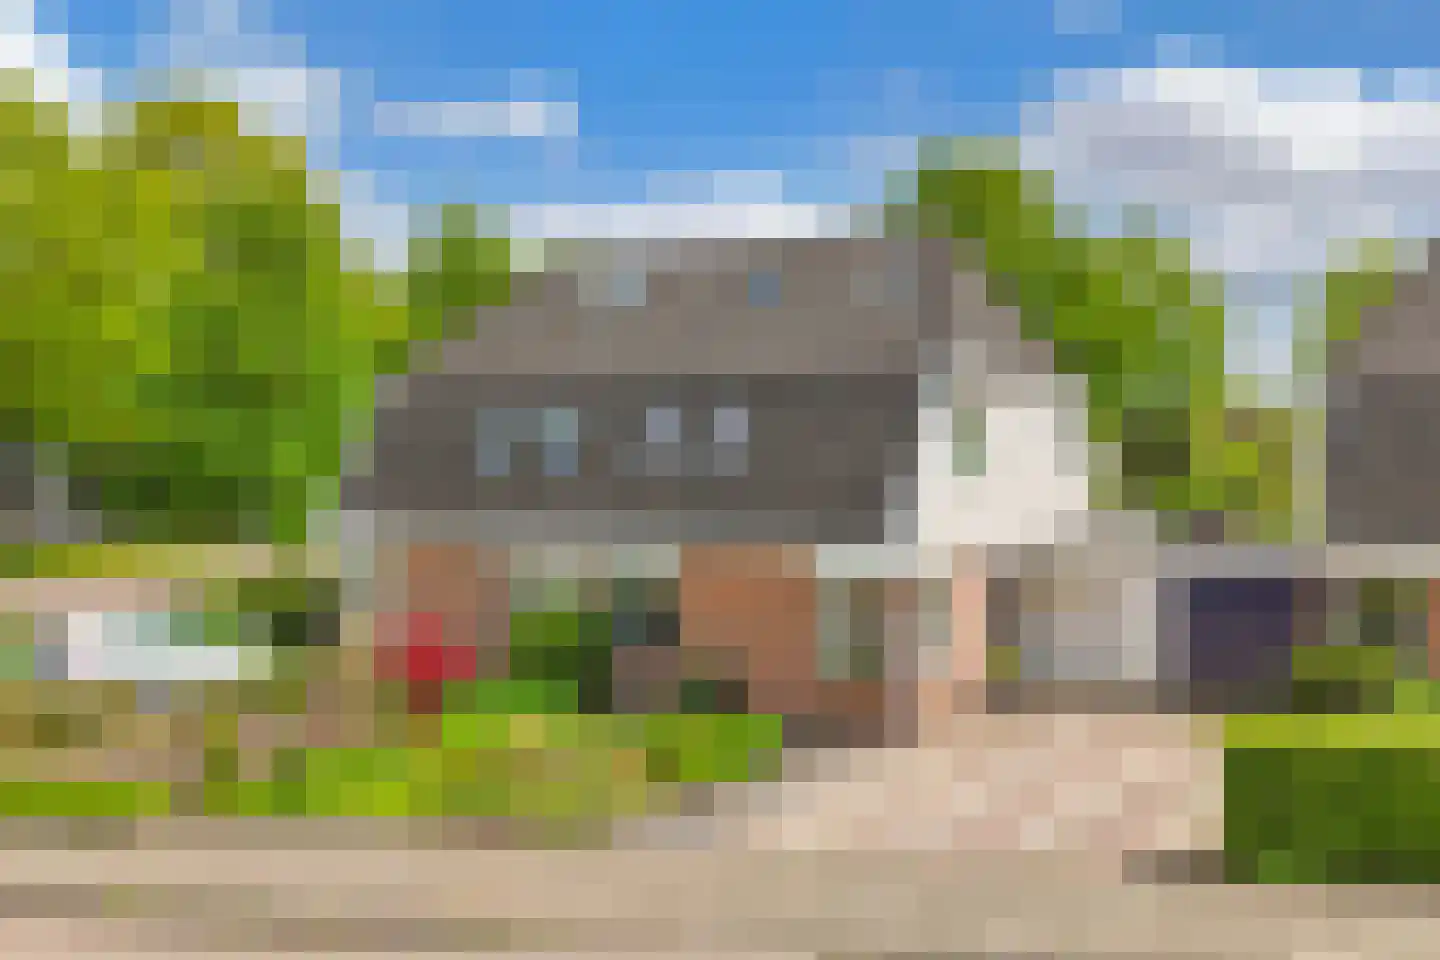
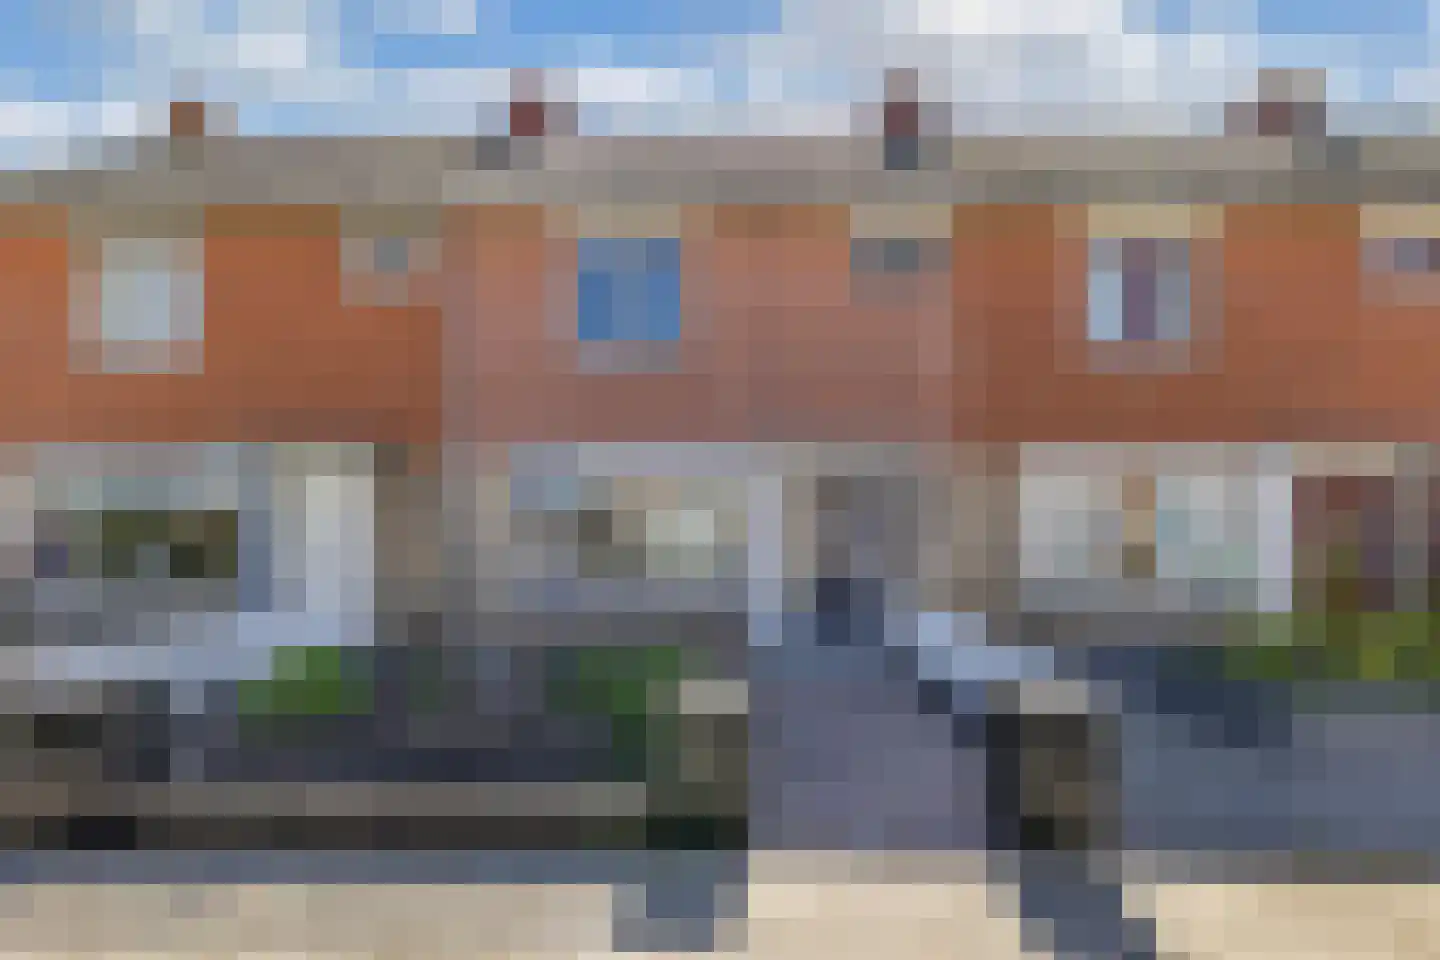
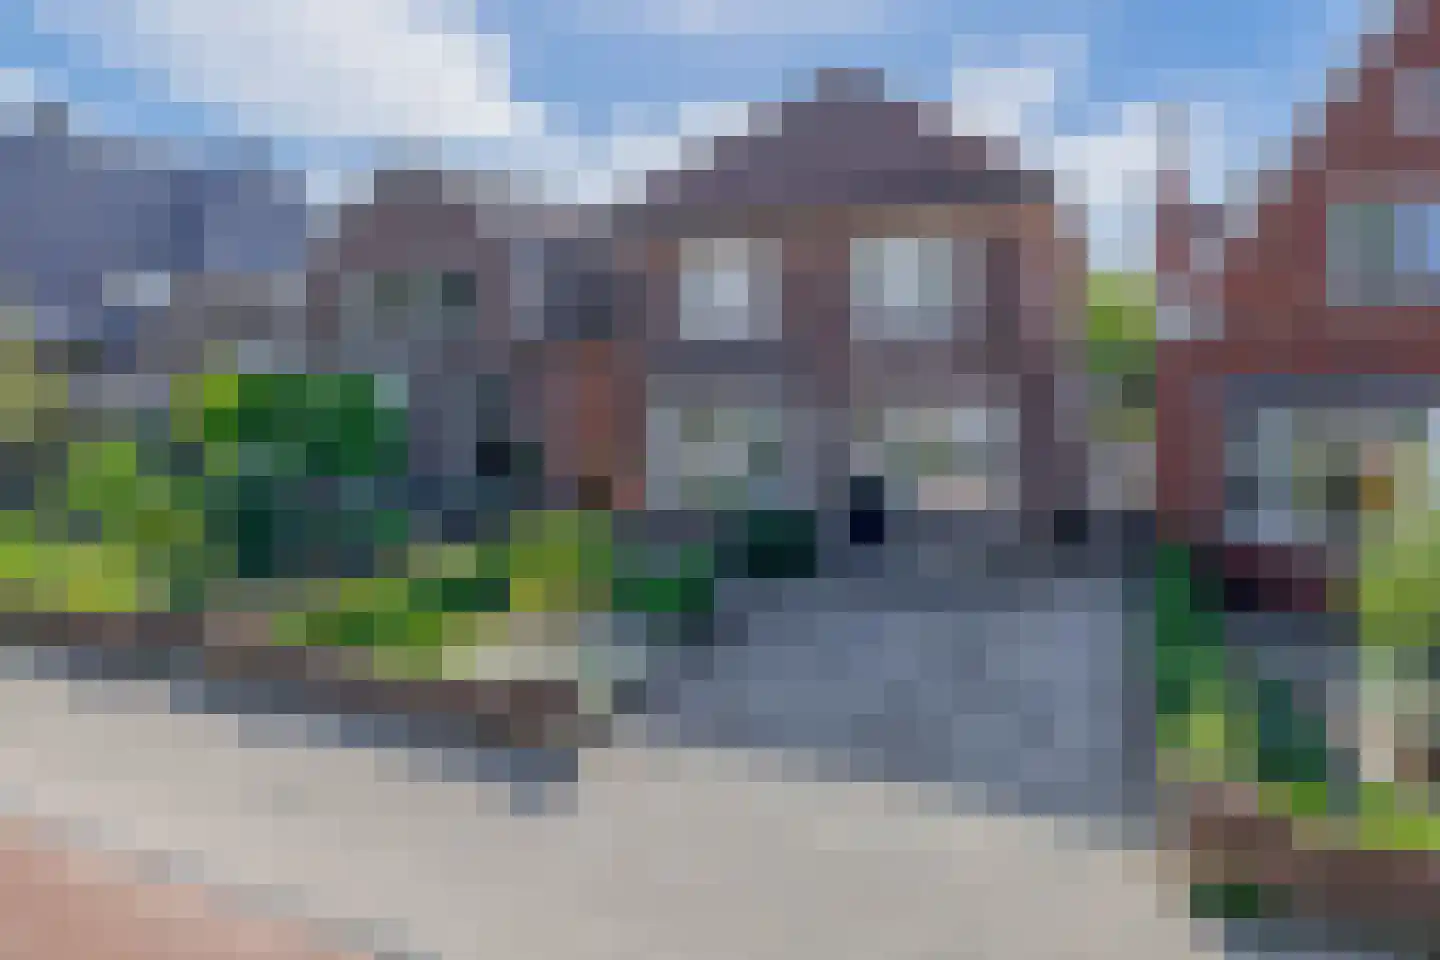
Burgemeester Wuiteweg 112
9203KN Drachten
€ 319.000 k.k.
€ 1.888/m²
- Living area
- 169 m²
- Land area
- 357 m²
- Bedrooms
- 5
Searching in 624 houses in Drachten
Type to search. Use arrow down and arrow up to navigate through results and press Enter to open.
Hidden search suggestions.
View current properties in Drachten or search targeted on street, postal code and property characteristics.
View the current housing stock in Drachten and quickly filter by price, living area, rooms and more. There are currently 624 houses in this place within our selection. View also 457 sold houses in Drachten for extra insight into the local housing market.
9203KN Drachten
€ 319.000 k.k.
€ 1.888/m²
9201XZ Drachten
€ 349.000 k.k.
€ 4.058/m²
9201EG Drachten
€ 329.000 k.k.
€ 3.739/m²
9202TM Drachten
€ 550.000 k.k.
€ 4.400/m²
9203VB Drachten
€ 335.000 k.k.
€ 3.221/m²
9201GE Drachten
€ 285.000 k.k.
€ 3.608/m²
9202BA Drachten
€ 250.000 k.k.
€ 2.525/m²
9201SC Drachten
€ 350.000 k.k.
€ 3.571/m²
9201CC Drachten
€ 250.000 k.k.
€ 2.212/m²
9207CJ Drachten
€ 298.000 k.k.
€ 2.569/m²
9202JB Drachten
€ 275.000 k.k.
€ 2.594/m²
9203AT Drachten
€ 439.500 k.k.
€ 2.747/m²
9204KX Drachten
€ 700.000 k.k.
€ 4.242/m²
9203HP Drachten
€ 375.000 k.k.
€ 3.750/m²
9203JC Drachten
€ 945.000 k.k.
€ 3.841/m²
9204WH Drachten
€ 435.000 k.k.
€ 3.085/m²
9205BC Drachten
€ 275.000 k.k.
€ 2.236/m²
9203DD Drachten
€ 645.000 k.k.
€ 3.909/m²
9205CX Drachten
€ 439.000 k.k.
€ 3.403/m²
9207BV Drachten
€ 300.000 k.k.
€ 2.609/m²
9205CA Drachten
€ 315.000 k.k.
€ 2.351/m²
9203EE Drachten
€ 219.000 k.k.
€ 3.129/m²
9203VB Drachten
€ 335.000 k.k.
€ 3.221/m²
9203NM Drachten
€ 305.000 k.k.
€ 2.652/m²
9204HN Drachten
€ 410.000 k.k.
€ 3.037/m²
9207DG Drachten
€ 425.000 k.k.
€ 3.346/m²
9203ZC Drachten
€ 297.500 k.k.
€ 3.542/m²
9206AZ Drachten
€ 850.000 k.k.
€ 2.515/m²
Get free quotes from real estate agents with local market knowledge. Compare more than 29 real estate agents in Drachten.
Selling a home in Drachten? View the sales-oriented guide sell a house in Drachten, compare all real estate agents in Drachten or view the top 10 real estate agents in Drachten for extra context to your choice.
Real estate agents make sharper offers when they know you're comparing — ask for quotes for sale or purchase.
Practical answers about housing supply, sales and comparing real estate agents in Drachten.
The costs of a real estate agent in Drachten depend on commission, setup costs, property presentation and the chosen service. Compare the 29 real estate agents in Drachten via the real estate agent page and request multiple quotes to compare rates and approach well.
Within our selection, we are currently showing 624 houses in Drachten. View also the sold houses in Drachten to compare the current offering with recent transactions.
Take into account not only price and living area but also maintenance, energy label, location, outdoor space and sales status. This way you compare houses in Drachten on more than just the asking price.
A local real estate agent knows the neighborhoods, recent transactions and demand in Drachten. By comparing 29 real estate agents in the region you get a better insight into prices, sales strategy and expected yield; the top 10 in Drachten provides a useful starting point.
Yes, when making a sales plan, a valuation in Drachten is wise. You gain insight into a realistic asking price and can then compare offers from real estate agents specifically.
View current location data on residents, WOZ development, housing stock, energy consumption, business activity and safety in Drachten. In 2026 were there 45.942 residents. The average WOZ value in 2025 is EUR 268.385.
These figures help to better assess and compare the housing stock in Drachten with recent sold homes. Orient yourself then on suitable top real estate agents in Drachten for sales advice in this region.
Residents
45.942
Last year: 2026
Average WOZ
EUR 268.385
Last year: 2025
Average income per person.
EUR 26.669
Source: AllNumbers
Crimes (current year)
1.930
Total registered
| Year | Residents |
|---|---|
| 2021 | 45.172 |
| 2022 | 45.036 |
| 2023 | 45.297 |
| 2024 | 45.505 |
| 2025 | 46.030 |
| 2026 | 45.942 |
| Year | Average WOZ |
|---|---|
| 2021 | EUR 196.093 |
| 2022 | EUR 217.007 |
| 2023 | EUR 255.736 |
| 2024 | EUR 263.833 |
| 2025 | EUR 268.385 |
Hoger
8.370
Praktisch
9.250
Middelbaar
15.340
Europa
2.375
Nederland
37.925
Buiten Europa
5.710
Label C
6.778
Label A
6.449
Label B
3.927
Label D
2.253
Label E
1.088
Label G
801
Label F
687
Label A+
505
Label A+++
437
Label A++++
174
Label A++
167
Label A+++++
13
| Year | Gas (m3) | Electricity (kWh) |
|---|---|---|
| 2020 | 1.214 | 2.417 |
| 2021 | 1.347 | 2.448 |
| 2022 | 1.060 | 2.288 |
| 2023 | 903 | 2.189 |
| 2024 | 883 | 2.260 |
Hoekwoning
Gas: 1.004 • Electricity: 2.255
Huurwoning
Gas: 780 • Electricity: 1.719
Koopwoning
Gas: 1.000 • Electricity: 2.557
Appartement
Gas: 666 • Electricity: 1.569
Tussenwoning
Gas: 904 • Electricity: 2.063
Vrijstaande woning
Gas: 1.250 • Electricity: 3.331
Twee-onder-één-kap woning
Gas: 975 • Electricity: 2.604
Total number of company establishments: 4.885
| Period | Crimes |
|---|---|
| jan 2026 | 171 |
| jul 2025 | 129 |
| jun 2025 | 146 |
| mei 2025 | 150 |
| mrt 2025 | 140 |
| mrt 2026 | 210 |
| nov 2024 | 159 |
| nov 2025 | 181 |
| okt 2024 | 219 |
| okt 2025 | 207 |
| sep 2024 | 183 |
| sep 2025 | 174 |
These figures give an indicative picture of safety trends in the living environment of Drachten.
Short answers based on current local statistics, handy for a quick comparison of the living environment.
Drachten telt in 2026 ongeveer 45.942 inwoners.
De gemiddelde WOZ-waarde in Drachten is in 2025 circa € 268.385.
Het gemiddelde inkomen per inwoner in Drachten ligt rond € 26.669 per jaar.
Voor het huidige jaar gaat het om ongeveer 1.930 geregistreerde misdrijven. Gebruik deze cijfers als indicatie en vergelijk trends per periode.
In Drachten komt vooral "Tussenwoningen" veel voor, met ongeveer 7.619 woningen.