Residents
249.873
Last year: 2026
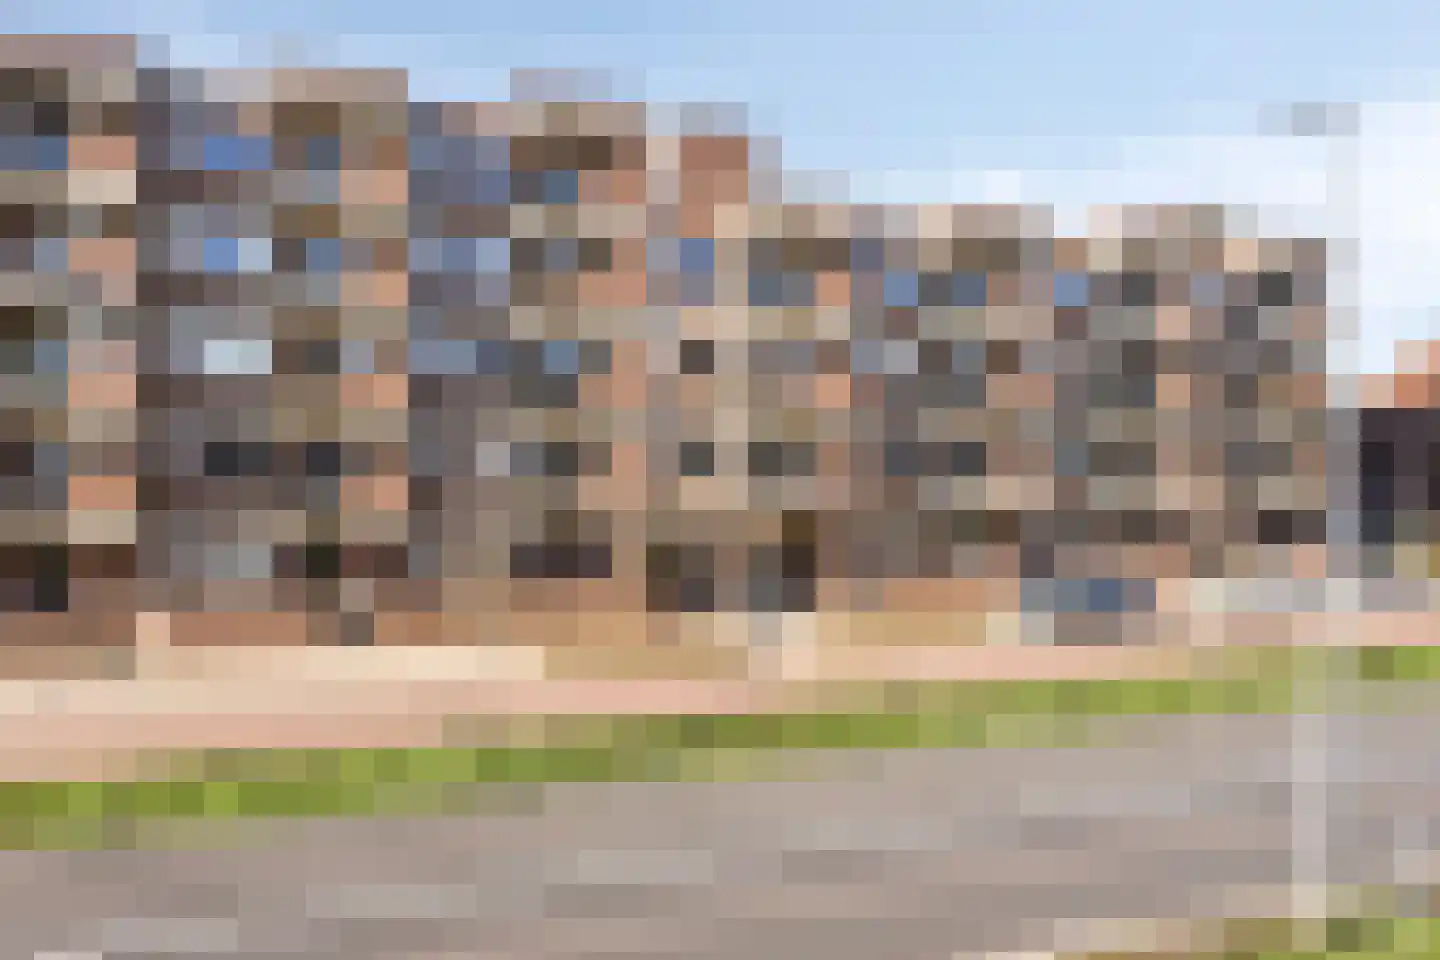
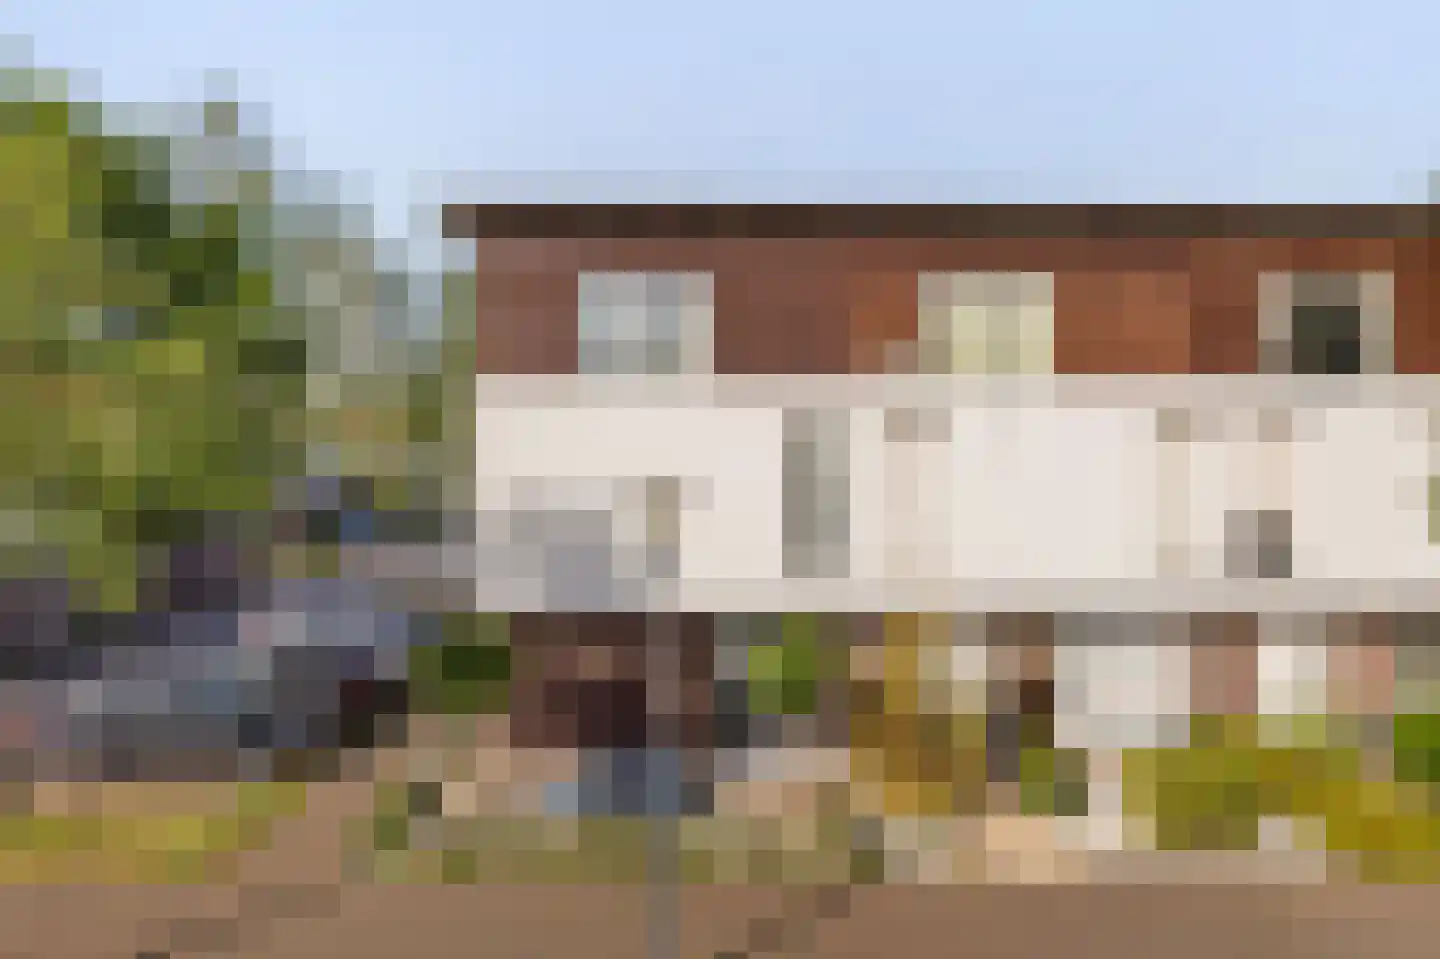
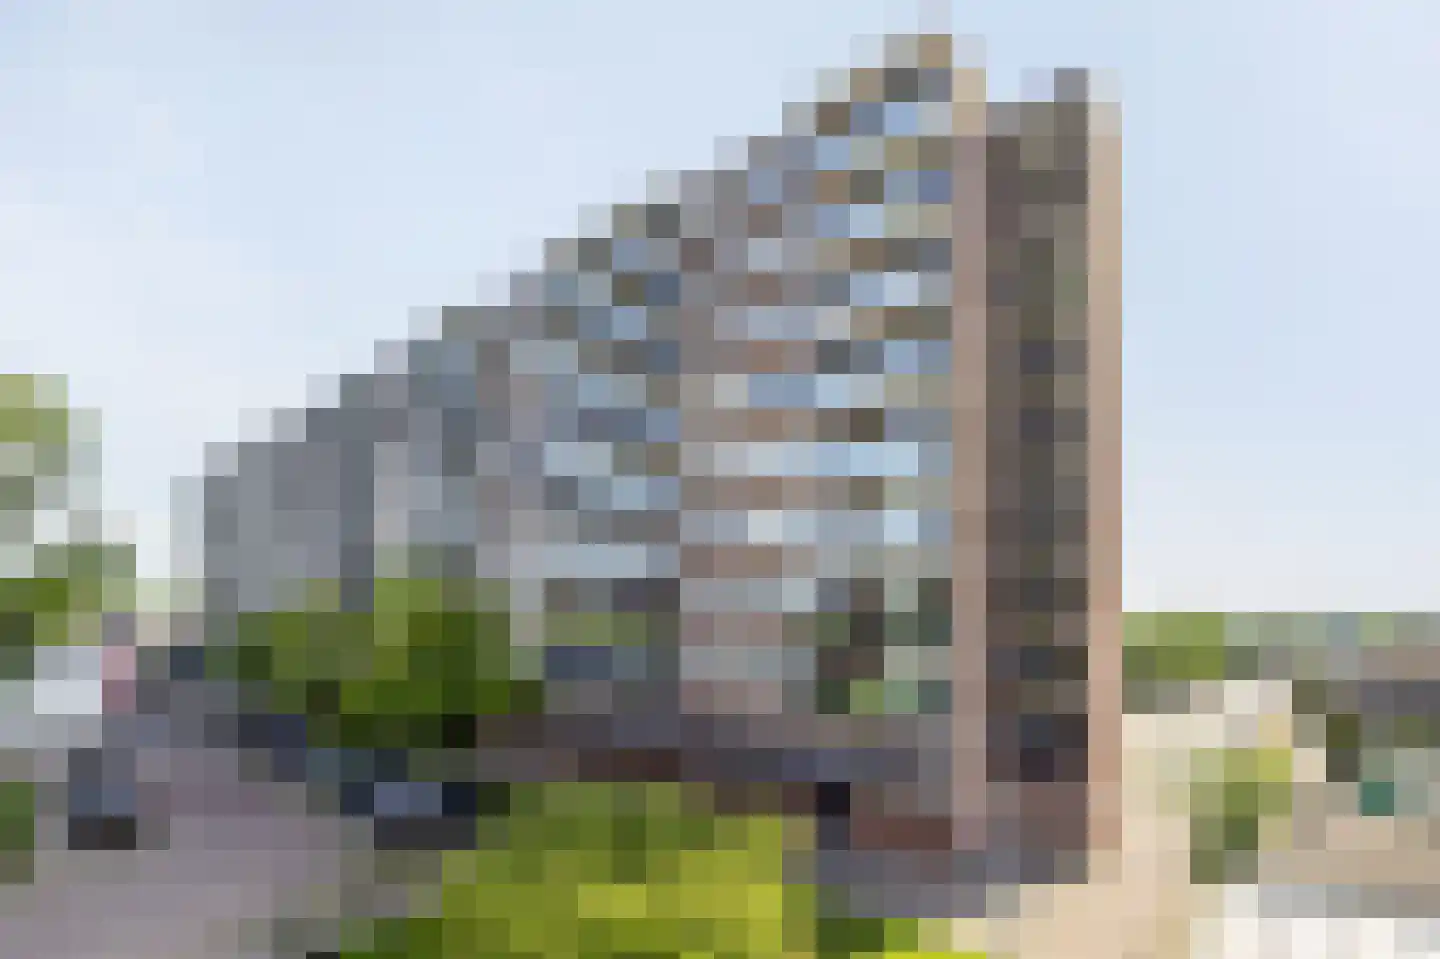
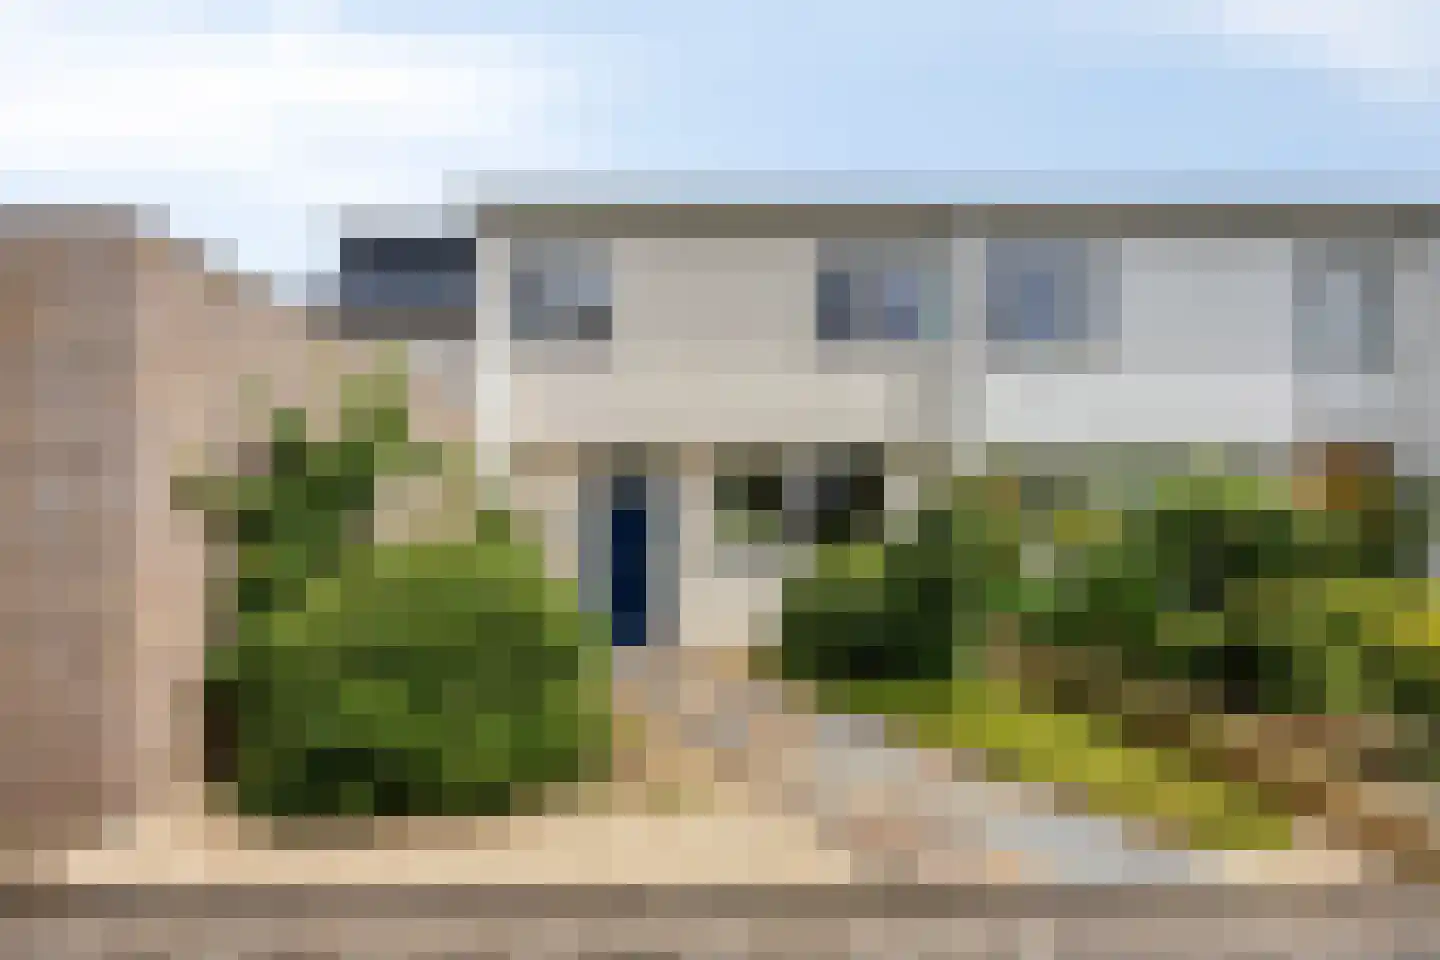
5612HC Eindhoven • Noord-Brabant
€ 349.500 k.k.
Cost of copper (estimated): € 8.840
2% transfer tax (€ 6.990) + notary (€ 1.150) + valuation (€ 700)
Total incl. VAT: € 358.340
Purchase price /m²: € 4.993
Boschdijk 207 in Eindhoven biedt starters het ideale appartement voor comfortabele leefomstandigheden en makkelijke toegang tot de stad, met openbaar vervoer, scholen en winkels dichtbij. Dit vierkamerappartement van eind jaren tachtig heeft een woonkamer met open keuken en twee slaapkamers, waarvan één toegang biedt tot een balkon. Het apparaat is geplaatst op de vierde verdieping met eigen parkeerplek, wasmachineberging in het appartement en extra bergplaatsen in de kelder. De VVE-bijdrage bedraagt €269,98 per maand, er geldt een asbestclausule en ouderdomsclausule en wordt verkocht door een beleggingsmaatschappij.
€ 349.500
Cost of copper (estimated): € 8.840
2% transfer tax (€ 6.990) + notary (€ 1.150) + valuation (€ 700)
Total purchase (incl. p.p.): € 358.340
3,02%
Yearly
€ 17.475
Direct available
Estimated mortgage
Indicative gross monthly cost
Based on annuity and 30 year term
Indicative net monthly cost
iDisclaimer: this mortgage calculation is a simplified indication based on general assumptions. No rights can be derived from the results shown. Calculated with 10-annual interest (met NHG), automatically determined based on the price limit € 470.000. Source: 10-jaars rente uit mortgage_rates (08-06-2026 03:45).
Douche en wastafel
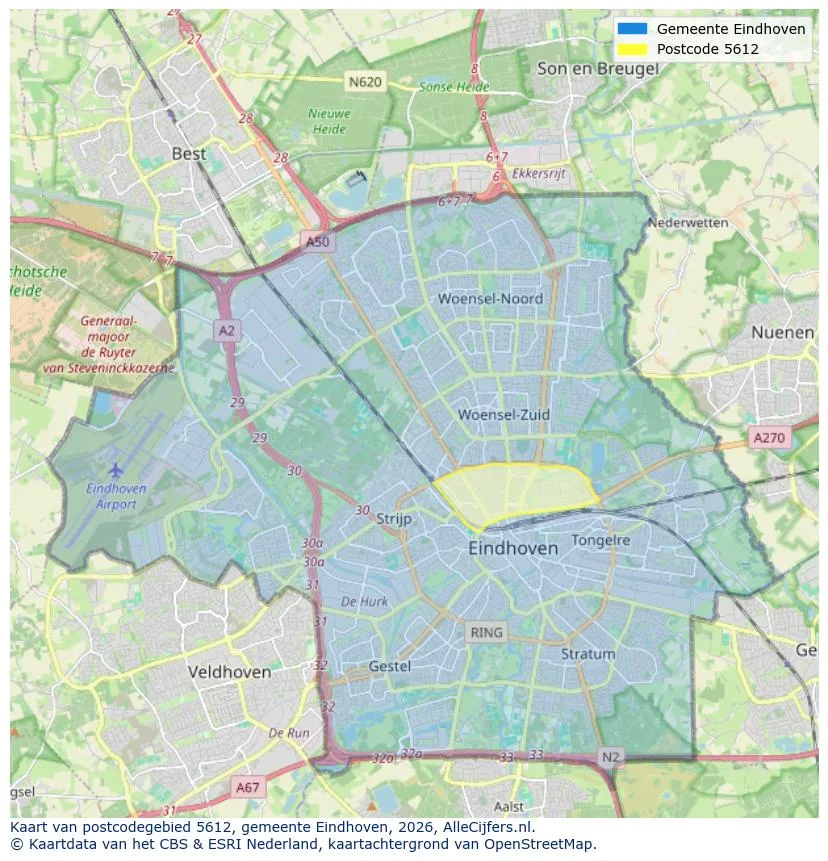
Discover where agents are active in Eindhoven
View current location data on residents, WOZ development, housing stock, energy consumption, business activity and safety in Eindhoven. In 2026 were there 249.873 residents. The average WOZ value in 2025 is EUR 391.000.
Residents
249.873
Last year: 2026
Average WOZ
EUR 391.000
Last year: 2025
Average income per person.
EUR 36.400
Source: AllNumbers
Crimes (current year)
18.880
Total registered
| Year | Residents |
|---|---|
| 2022 | 238.326 |
| 2023 | 243.730 |
| 2024 | 246.417 |
| 2025 | 249.035 |
| 2026 | 249.873 |
| Year | Average WOZ |
|---|---|
| 2021 | EUR 287.000 |
| 2022 | EUR 314.000 |
| 2023 | EUR 360.000 |
| 2024 | EUR 363.000 |
| 2025 | EUR 391.000 |
Hoger
43
Praktisch
24
Middelbaar
34
Europa
36.936
Nederland
134.959
Buiten Europa
77.140
Label A
34.103
Label C
29.742
Label B
19.304
Label D
11.177
Label E
9.327
Label F
6.306
Label A+
5.788
Label G
4.088
Label A++
3.731
Label A+++
2.635
Label A++++
578
Label A+++++
42
| Year | Gas (m3) | Electricity (kWh) |
|---|---|---|
| 2020 | 1.040 | 2.540 |
| 2021 | 1.140 | 2.570 |
| 2022 | 900 | 2.400 |
| 2023 | 770 | 2.270 |
| 2024 | 750 | 2.310 |
Hoekwoning
Gas: 970 • Electricity: 2.650
Huurwoning
Gas: 670 • Electricity: 1.900
Koopwoning
Gas: 890 • Electricity: 2.740
Appartement
Gas: 550 • Electricity: 1.710
Tussenwoning
Gas: 830 • Electricity: 2.450
Vrijstaande woning
Gas: 1.400 • Electricity: 4.320
Twee-onder-één-kap woning
Gas: 1.210 • Electricity: 3.250
Total number of company establishments: 33.545
| Period | Crimes |
|---|---|
| jan 2025 | 1.526 |
| jan 2026 | 1.357 |
| jul 2025 | 1.556 |
| jun 2025 | 1.564 |
| mei 2025 | 1.610 |
| mrt 2025 | 1.666 |
| nov 2024 | 1.768 |
| nov 2025 | 1.541 |
| okt 2024 | 1.807 |
| okt 2025 | 1.706 |
| sep 2024 | 1.612 |
| sep 2025 | 1.579 |
These figures give an indicative picture of safety trends in the living environment of Eindhoven.
Short answers based on current local statistics, handy for a quick comparison of the living environment.
Eindhoven telt in 2026 ongeveer 249.873 inwoners.
De gemiddelde WOZ-waarde in Eindhoven is in 2025 circa € 391.000.
Het gemiddelde inkomen per inwoner in Eindhoven ligt rond € 36.400 per jaar.
Voor het huidige jaar gaat het om ongeveer 18.880 geregistreerde misdrijven. Gebruik deze cijfers als indicatie en vergelijk trends per periode.
In Eindhoven komt vooral "Appartementen" veel voor, met ongeveer 58.911 woningen.
View more homes in this location.

5611XD Eindhoven
€ 2.010 p/m
€ 21/m²
5611RM Eindhoven
€ 795.000 k.k.
€ 3.340/m²
5644LB Eindhoven
€ 325.000 k.k.
€ 6.132/m²
5658AD Eindhoven
€ 550.000 k.k.
€ 4.583/m²
5628AH Eindhoven
€ 350.000 k.k.
€ 4.023/m²

5611GG Eindhoven
€ 1.720 p/m
€ 32/m²
5653JL Eindhoven
€ 525.000 k.k.
€ 3.646/m²

5612BH Eindhoven
€ 550.000 k.k.
€ 3.438/m²
