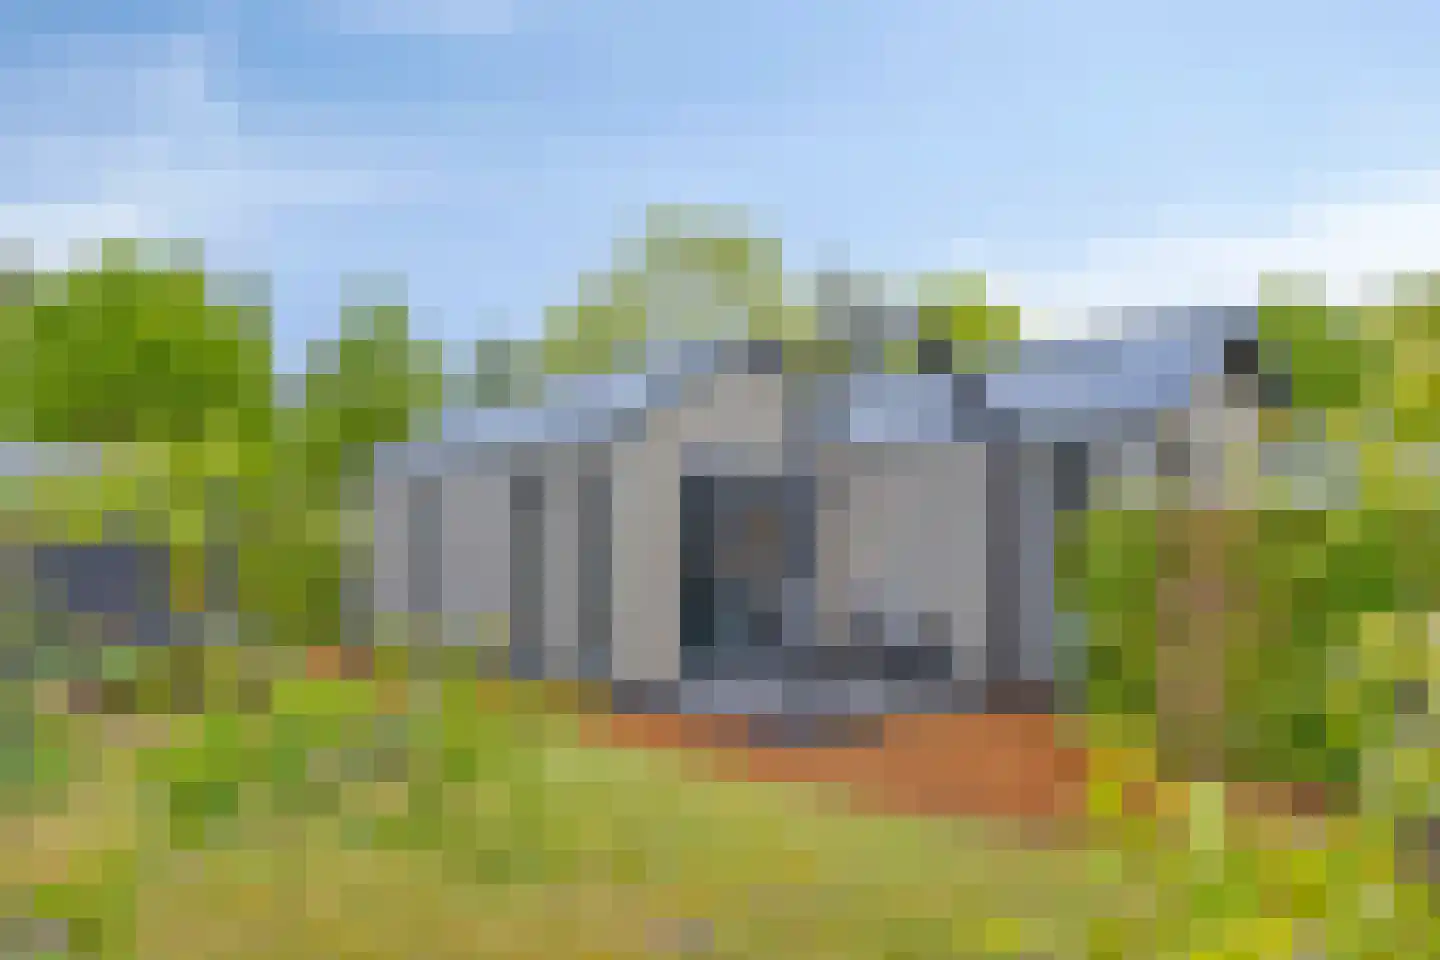
- Available
Sint Jorisweg 62
8161HB Epe
€ 495.000 k.k.
€ 6.037/m²
- Living area
- 82 m²
- Land area
- —
- Bedrooms
- 2
Searching in 192 houses in Epe
Type to search. Use arrow down and arrow up to navigate through results and press Enter to open.
Hidden search suggestions.
View current properties in Epe or search targeted on street, postal code and property characteristics.
View the current housing stock in Epe and quickly filter by price, living area, rooms and more. There are currently 192 houses in this place within our selection. View also 128 sold houses in Epe for extra insight into the local housing market.
8161HB Epe
€ 495.000 k.k.
€ 6.037/m²
8162XW Epe
€ 398.000 k.k.
€ 2.884/m²
8162PG Epe
€ 899.000 k.k.
€ 7.309/m²
8162AD Epe
€ 695.000 k.k.
€ 2.970/m²
8161CB Epe
€ 950.000 k.k.
€ 5.398/m²
8161HL Epe
€ 470.000 k.k.
€ 3.730/m²
8162PT Epe
€ 125.000 k.k.
8162PH Epe
€ 125.000 k.k.
8162VD Epe
€ 695.000 k.k.
€ 7.473/m²
8161CW Epe
€ 789.000 k.k.
€ 3.430/m²
8162RK Epe
€ 1.495.000 k.k.
€ 4.153/m²
8162EW Epe
€ 775.000 k.k.
€ 5.308/m²
8161BC Epe
€ 265.000 k.k.
€ 4.492/m²
8161ZR Epe
€ 515.000 k.k.
€ 4.120/m²
8162NX Epe
€ 1.650.000 k.k.
8162DR Epe
€ 932 p/m
€ 17/m²
8162PH Epe
€ 122.500 k.k.
8162PV Epe
€ 89.000 k.k.
8162PV Epe
€ 219.000 k.k.
8162CT Epe
€ 1.175.000 k.k.
€ 6.994/m²
8161CP Epe
€ 2.000.000 k.k.
8162SB Epe
€ 1.895.000 k.k.
8162PV Epe
€ 219.500 k.k.
8161CW Epe
€ 635.000 k.k.
8162PH Epe
€ 99.000 k.k.
8162ND Epe
€ 1.100.000 k.k.
€ 8.661/m²
8161VK Epe
€ 635.000 k.k.
€ 4.150/m²
8161CW Epe
€ 449.000 k.k.
€ 4.828/m²
Get free quotes from real estate agents with local market knowledge. Compare more than 15 real estate agents in Epe.
Selling a home in Epe? View the sales-oriented guide sell a house in Epe, compare all real estate agents in Epe or view the top 10 real estate agents in Epe for extra context to your choice.
Real estate agents make sharper offers when they know you're comparing — ask for quotes for sale or purchase.
Practical answers about housing supply, sales and comparing real estate agents in Epe.
The costs of a real estate agent in Epe depend on commission, setup costs, property presentation and the chosen service. Compare the 15 real estate agents in Epe via the real estate agent page and request multiple quotes to compare rates and approach well.
Within our selection, we are currently showing 192 houses in Epe. View also the sold houses in Epe to compare the current offering with recent transactions.
Take into account not only price and living area but also maintenance, energy label, location, outdoor space and sales status. This way you compare houses in Epe on more than just the asking price.
A local real estate agent knows the neighborhoods, recent transactions and demand in Epe. By comparing 15 real estate agents in the region you get a better insight into prices, sales strategy and expected yield; the top 10 in Epe provides a useful starting point.
Yes, when making a sales plan, a valuation in Epe is wise. You gain insight into a realistic asking price and can then compare offers from real estate agents specifically.
View current location data on residents, WOZ development, housing stock, energy consumption, business activity and safety in Epe. In 2026 were there 16.056 residents. The average WOZ value in 2025 is EUR 468.000.
These figures help to better assess and compare the housing stock in Epe with recent sold homes. Orient yourself then on suitable top real estate agents in Epe for sales advice in this region.
Residents
16.056
Last year: 2026
Average WOZ
EUR 468.000
Last year: 2025
Average income per person.
EUR 34.600
Source: AllNumbers
Crimes (current year)
422
Total registered
| Year | Residents |
|---|---|
| 2021 | 15.685 |
| 2022 | 15.680 |
| 2023 | 15.670 |
| 2024 | 15.700 |
| 2025 | 16.005 |
| 2026 | 16.056 |
| Year | Average WOZ |
|---|---|
| 2021 | EUR 334.000 |
| 2022 | EUR 366.000 |
| 2023 | EUR 448.000 |
| 2024 | EUR 462.000 |
| 2025 | EUR 468.000 |
Hoger
3.180
Praktisch
3.440
Middelbaar
4.780
Europa
860
Nederland
13.610
Buiten Europa
1.535
Label C
2.033
Label A
1.790
Label B
1.088
Label D
970
Label G
789
Label E
574
Label F
562
Label A+++
207
Label A+
96
Label A++
71
Label A++++
19
Label A+++++
8
| Year | Gas (m3) | Electricity (kWh) |
|---|---|---|
| 2020 | 1.520 | 3.090 |
| 2021 | 1.670 | 3.160 |
| 2022 | 1.310 | 2.960 |
| 2023 | 1.080 | 2.800 |
| 2024 | 1.040 | 2.900 |
Hoekwoning
Gas: 990 • Electricity: 2.480
Huurwoning
Gas: 800 • Electricity: 2.000
Koopwoning
Gas: 1.230 • Electricity: 3.240
Appartement
Gas: 660 • Electricity: 1.940
Tussenwoning
Gas: 870 • Electricity: 2.330
Vrijstaande woning
Gas: 1.580 • Electricity: 3.940
Twee-onder-één-kap woning
Gas: 1.190 • Electricity: 2.950
Total number of company establishments: 2.080
| Period | Crimes |
|---|---|
| jan 2026 | 30 |
| jul 2025 | 59 |
| jun 2025 | 40 |
| mei 2025 | 37 |
| mrt 2025 | 42 |
| mrt 2026 | 46 |
| nov 2024 | 33 |
| nov 2025 | 26 |
| okt 2024 | 42 |
| okt 2025 | 26 |
| sep 2024 | 40 |
| sep 2025 | 26 |
These figures give an indicative picture of safety trends in the living environment of Epe.
Short answers based on current local statistics, handy for a quick comparison of the living environment.
Epe telt in 2026 ongeveer 16.056 inwoners.
De gemiddelde WOZ-waarde in Epe is in 2025 circa € 468.000.
Het gemiddelde inkomen per inwoner in Epe ligt rond € 34.600 per jaar.
Voor het huidige jaar gaat het om ongeveer 422 geregistreerde misdrijven. Gebruik deze cijfers als indicatie en vergelijk trends per periode.
In Epe komt vooral "Vrijstaande woningen" veel voor, met ongeveer 2.304 woningen.