
Residents
31.305
Last year: 2025
8442NA Heerenveen • Fryslân
€ 239.000 k.k.
Cost of copper (estimated): € 6.630
2% transfer tax (€ 4.780) + notary (€ 1.150) + valuation (€ 700)
Total incl. VAT: € 245.630
Purchase price /m²: € 3.793
For this property, no detailed description is available yet.
€ 239.000
Cost of copper (estimated): € 6.630
2% transfer tax (€ 4.780) + notary (€ 1.150) + valuation (€ 700)
Total purchase (incl. p.p.): € 245.630
2,78%
Yearly
€ 11.950
Direct available
Estimated mortgage
Indicative gross monthly cost
Based on annuity and 30 year term
Indicative net monthly cost
iDisclaimer: this mortgage calculation is a simplified indication based on general assumptions. No rights can be derived from the results shown. Calculated with 10-annual interest (met NHG), automatically determined based on the price limit € 470.000. Source: 10-jaars rente uit mortgage_rates (04-05-2026 03:45).
Douche en wastafel
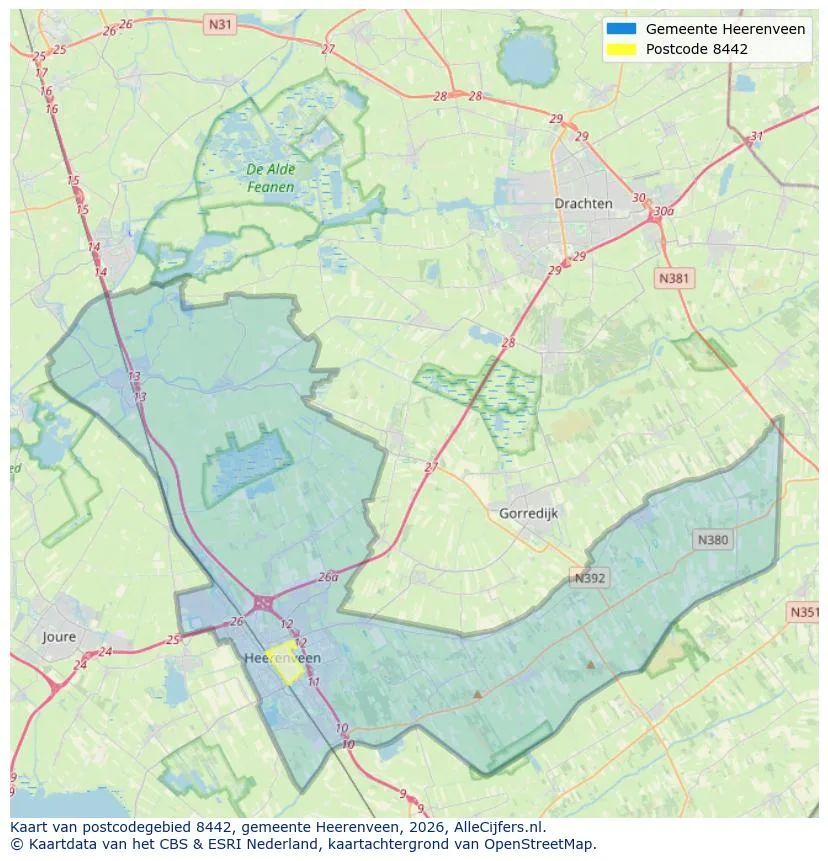
Explore Heerenveen and the surrounding areas
View current location data on residents, WOZ development, housing stock, energy consumption, business activity and safety in Heerenveen. In 2025 were there 31.305 residents. The average WOZ value in 2025 is EUR 304.000.
Residents
31.305
Last year: 2025
Average WOZ
EUR 304.000
Last year: 2025
Average income per person.
EUR 32.000
Source: AllNumbers
Crimes (current year)
1.450
Total registered
| Year | Residents |
|---|---|
| 2021 | 29.795 |
| 2022 | 30.220 |
| 2023 | 30.680 |
| 2024 | 31.070 |
| 2025 | 31.305 |
| Year | Average WOZ |
|---|---|
| 2021 | EUR 221.000 |
| 2022 | EUR 244.000 |
| 2023 | EUR 287.000 |
| 2024 | EUR 297.000 |
| 2025 | EUR 304.000 |
Hoger
7.110
Praktisch
5.760
Middelbaar
9.910
Europa
1.940
Nederland
24.930
Buiten Europa
4.430
Label A
5.659
Label C
3.786
Label B
2.964
Label D
1.085
Label G
921
Label E
868
Label F
434
Label A+++
420
Label A+
404
Label A++
206
Label A++++
89
Label A+++++
21
| Year | Gas (m3) | Electricity (kWh) |
|---|---|---|
| 2020 | 1.130 | 2.430 |
| 2021 | 1.250 | 2.480 |
| 2022 | 980 | 2.340 |
| 2023 | 820 | 2.240 |
| 2024 | 790 | 2.330 |
Hoekwoning
Gas: 890 • Electricity: 2.320
Huurwoning
Gas: 670 • Electricity: 1.740
Koopwoning
Gas: 950 • Electricity: 2.720
Appartement
Gas: 600 • Electricity: 1.560
Tussenwoning
Gas: 780 • Electricity: 2.200
Vrijstaande woning
Gas: 1.190 • Electricity: 3.540
Twee-onder-één-kap woning
Gas: 960 • Electricity: 2.580
Total number of company establishments: 4.245
| Period | Crimes |
|---|---|
| jan 2025 | 124 |
| jan 2026 | 88 |
| jul 2025 | 104 |
| jun 2025 | 113 |
| mei 2025 | 107 |
| mrt 2025 | 157 |
| nov 2024 | 122 |
| nov 2025 | 133 |
| okt 2024 | 116 |
| okt 2025 | 142 |
| sep 2024 | 70 |
| sep 2025 | 112 |
These figures give an indicative picture of safety trends in the living environment of Heerenveen.
Short answers based on current local statistics, handy for a quick comparison of the living environment.
Heerenveen telt in 2025 ongeveer 31.305 inwoners.
De gemiddelde WOZ-waarde in Heerenveen is in 2025 circa € 304.000.
Het gemiddelde inkomen per inwoner in Heerenveen ligt rond € 32.000 per jaar.
Voor het huidige jaar gaat het om ongeveer 1.450 geregistreerde misdrijven. Gebruik deze cijfers als indicatie en vergelijk trends per periode.
In Heerenveen komt vooral "Appartementen" veel voor, met ongeveer 5.421 woningen.
View more homes in this location.

8446LB Heerenveen
€ 359.000 k.k.

8442EG Heerenveen
€ 349.000 k.k.

8441CA Heerenveen
€ 325.000 k.k.

8441GB Heerenveen
€ 285.000 k.k.

8448RM Heerenveen
€ 550.000 k.k.
8442DS Heerenveen
€ 395.000 k.k.

8441ER Heerenveen
€ 350.000 k.k.

8441DN Heerenveen
€ 349.000 k.k.
