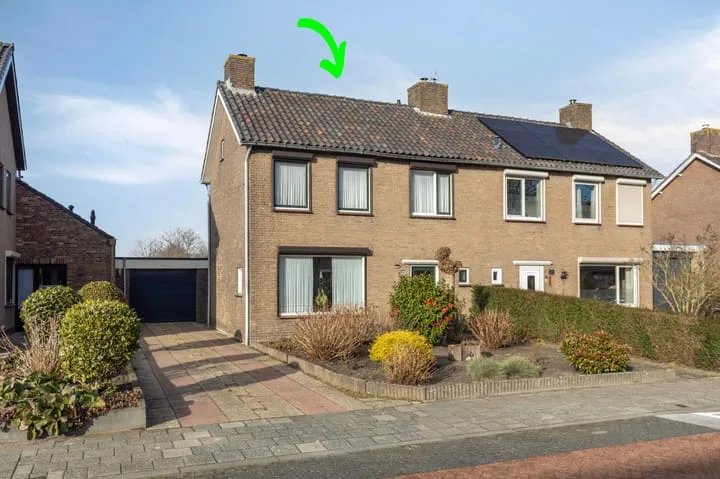
Houses sold in Heerle

View 8 sold houses in Heerle

Connected to: Vastgoed Nederland NVM Makelaars

On this page you will find recently sold homes in Heerle. Use this overview to better estimate selling prices, popular neighborhoods, and the local housing supply before you choose a real estate agent. Also view the current housing supply with 16 houses in Heerle.

Selection

Search and filter homes

Set your preferences and discover homes that suit you.

Total supply 242.717
Filters

Set price, area and other characteristics. Adjust a filter or click on Show homes. Location changes directly above.

Reset filters

You search for

  • Place Heerle
  • Status Sold

Huis verkopen in Heerle? Vergelijk verkoopmakelaars

Bekijk recente verkopen en ontvang gratis offertes van lokale makelaars. Vergelijk meer dan 55 makelaars in Heerle.

Free request a quote

  • Quotes in Heerle
  • Non-binding
  • Personal
  • Gratis tarieven vergelijken

Zelf je woning verkopen in Heerle? Vergelijk verkoopmakelaars in Heerle of bekijk de beste verkoopmakelaars in Heerle als referentie bij jouw keuze.

Vergelijk meerdere offertes

Makelaars maken scherpere voorstellen als ze weten dat je vergelijkt — vraag offertes aan voor verkoop of aankoop.

Frequently asked questions about sold homes in Heerle

Short answers about housing prices, sold homes and comparing real estate agents in Heerle.

Residential and neighborhood statistics in Heerle

View current location data on residents, WOZ development, housing stock, energy consumption, business activity and safety in Heerle. In 2025 were there 1.855 residents. The average WOZ value in 2025 is EUR 428.000.

These figures help to better assess and compare the housing stock in Heerle with recent sold homes. Orient yourself then on suitable top real estate agents in Heerle for sales advice in this region.

Residents

1.855

Last year: 2025

Average WOZ

EUR 428.000

Last year: 2025

Average income per person.

EUR 34.200

Source: AllNumbers

Crimes (current year)

51

Total registered

Demographics and WOZ development

Inhabitants per year

Inhabitants per year in Heerle
Year Residents
2021 1.825
2022 1.860
2023 1.885
2024 1.860
2025 1.855

Annual WOZ value

WOZ value per year in Heerle
Year Average WOZ
2021 EUR 320.000
2022 EUR 338.000
2023 EUR 379.000
2024 EUR 402.000
2025 EUR 428.000

Composition of residents

Age build-up

65+: 495 0-15: 255 15-25: 155 25-45: 355 45-65: 600

Education level

Hoger

360

Praktisch

340

Middelbaar

690

Origin of residents (2025)

Europa

140

Nederland

1.625

Buiten Europa

95

Housing stock and construction periods

Types of homes

Hoekwoningen 89
Appartementen 19
Tussenwoningen 132
Vrijstaande woningen 392
Twee-onder-één-kap woningen 132

Construction period of buildings

Voor 1700 0
1700 tot 1900 36
1900 tot 1925 67
1925 tot 1950 72
1950 tot 1970 189
1970 tot 1980 123
1980 tot 1990 151
1990 tot 2000 114
2000 tot 2010 19
2010 tot 2020 62
2020 en later 16

Energy and sustainability

Energy label distribution

Label C

167

Label B

151

Label G

118

Label A

96

Label D

95

Label F

63

Label E

35

Label A++

9

Label A+

5

Label A+++

2

Label A++++

0

Label A+++++

0

Average energy consumption per year

Average energy consumption per year in Heerle
Year Gas (m3) Electricity (kWh)
2020 1.510 3.480
2021 1.690 3.530
2022 1.290 3.390
2023 1.090 3.290
2024 1.060 3.450

Consumption per house type

Hoekwoning

Gas: 900 • Electricity: 2.600

Huurwoning

Gas: 930 • Electricity: 2.310

Koopwoning

Gas: 1.110 • Electricity: 3.430

Appartement

Gas: 390 • Electricity: 2.060

Tussenwoning

Gas: 810 • Electricity: 2.350

Vrijstaande woning

Gas: 1.270 • Electricity: 3.960

Twee-onder-één-kap woning

Gas: 1.040 • Electricity: 2.890

Business activity in Heerle (2025)

Handel en HORECA 40
Nijverheid en energie 50
Zakelijke dienstverlening 65
Overheid, onderwijs en zorg 35
Landbouw, bosbouw en visserij 35
Vervoer, informatie en communicatie 10
Financiele diensten en onroerendgoed 15
Cultuur, recreatie en overige diensten 25

Total number of company establishments: 270

Recent crime statistics

Recent crime statistics in Heerle
Period Crimes
jan 2026 8
jul 2025 6
jun 2025 3
mei 2025 7
mrt 2025 6
mrt 2026 7
nov 2024 1
nov 2025 2
okt 2024 1
okt 2025 2
sep 2024 2
sep 2025 4

These figures give an indicative picture of safety trends in the living environment of Heerle.

Frequently asked questions about living in Heerle

Short answers based on current local statistics, handy for a quick comparison of the living environment.

Hoeveel inwoners heeft Heerle?

Heerle telt in 2025 ongeveer 1.855 inwoners.

Wat is de gemiddelde WOZ-waarde in Heerle?

De gemiddelde WOZ-waarde in Heerle is in 2025 circa € 428.000.

Wat is het gemiddelde inkomen per inwoner in Heerle?

Het gemiddelde inkomen per inwoner in Heerle ligt rond € 34.200 per jaar.

Hoe veilig is wonen in Heerle?

Voor het huidige jaar gaat het om ongeveer 51 geregistreerde misdrijven. Gebruik deze cijfers als indicatie en vergelijk trends per periode.

Welke woningtypen komen het meest voor in Heerle?

In Heerle komt vooral "Vrijstaande woningen" veel voor, met ongeveer 392 woningen.

Receive free, non-binding quotes

Compare multiple real estate agents and choose the best match.