
Residents
10.125
Last year: 2025
3828HA Hoogland • Utrecht

For this property, no detailed description is available yet.
€ 350.000
Cost of copper (estimated): € 8.850
2% transfer tax (€ 7.000) + notary (€ 1.150) + valuation (€ 700)
Total purchase (incl. p.p.): € 358.850
2,78%
Yearly
€ 17.500
Direct available
Estimated mortgage
Indicative gross monthly cost
Based on annuity and 30 year term
Indicative net monthly cost
iDisclaimer: this mortgage calculation is a simplified indication based on general assumptions. No rights can be derived from the results shown. Calculated with 10-annual interest (met NHG), automatically determined based on the price limit € 470.000. Source: 10-jaars rente uit mortgage_rates (01-05-2026 03:45).
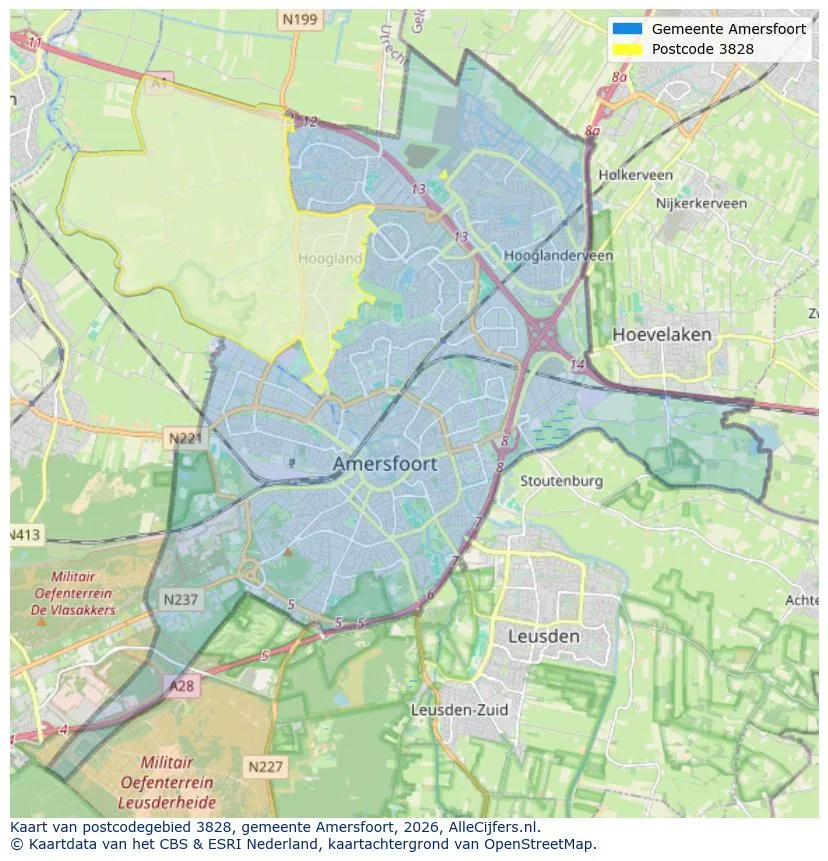
Spatial overview of the work area in Hoogland
View current location data on residents, WOZ development, housing stock, energy consumption, business activity and safety in Hoogland. In 2025 were there 10.125 residents. The average WOZ value in 2025 is EUR 487.520.
Residents
10.125
Last year: 2025
Average WOZ
EUR 487.520
Last year: 2025
Average income per person.
EUR 35.598
Source: AllNumbers
Crimes (current year)
239
Total registered
| Year | Residents |
|---|---|
| 2021 | 10.305 |
| 2022 | 10.245 |
| 2023 | 10.180 |
| 2024 | 10.140 |
| 2025 | 10.125 |
| Year | Average WOZ |
|---|---|
| 2021 | EUR 365.923 |
| 2022 | EUR 404.109 |
| 2023 | EUR 471.727 |
| 2024 | EUR 465.173 |
| 2025 | EUR 487.520 |
Hoger
2.770
Praktisch
1.490
Middelbaar
3.140
Europa
455
Nederland
8.755
Buiten Europa
915
Label C
1.919
Label B
921
Label A
669
Label D
449
Label E
152
Label F
135
Label G
119
Label A+
48
Label A+++
19
Label A++
15
Label A++++
9
Label A+++++
0
| Year | Gas (m3) | Electricity (kWh) |
|---|---|---|
| 2020 | 1.222 | 3.078 |
| 2021 | 1.393 | 3.169 |
| 2022 | 1.084 | 2.925 |
| 2023 | 906 | 2.739 |
| 2024 | 877 | 2.800 |
Hoekwoning
Gas: 938 • Electricity: 2.709
Huurwoning
Gas: 721 • Electricity: 1.995
Koopwoning
Gas: 955 • Electricity: 2.907
Appartement
Gas: 621 • Electricity: 1.929
Tussenwoning
Gas: 814 • Electricity: 2.460
Vrijstaande woning
Gas: 1.405 • Electricity: 4.142
Twee-onder-één-kap woning
Gas: 1.153 • Electricity: 3.206
Total number of company establishments: 1.370
| Period | Crimes |
|---|---|
| jan 2025 | 12 |
| jan 2026 | 21 |
| jul 2025 | 20 |
| jun 2025 | 15 |
| mei 2025 | 15 |
| mrt 2025 | 20 |
| nov 2024 | 20 |
| nov 2025 | 17 |
| okt 2024 | 17 |
| okt 2025 | 24 |
| sep 2024 | 7 |
| sep 2025 | 29 |
These figures give an indicative picture of safety trends in the living environment of Hoogland.
Short answers based on current local statistics, handy for a quick comparison of the living environment.
Hoogland telt in 2025 ongeveer 10.125 inwoners.
De gemiddelde WOZ-waarde in Hoogland is in 2025 circa € 487.520.
Het gemiddelde inkomen per inwoner in Hoogland ligt rond € 35.598 per jaar.
Voor het huidige jaar gaat het om ongeveer 239 geregistreerde misdrijven. Gebruik deze cijfers als indicatie en vergelijk trends per periode.
In Hoogland komt vooral "Tussenwoningen" veel voor, met ongeveer 2.116 woningen.
View more homes in this location.

3828VM Hoogland
€ 798.000 k.k.

3828CX Hoogland
€ 315.000 k.k.

3828CJ Hoogland
€ 550.000 k.k.

3828HZ Hoogland
€ 295.000 k.k.

3828DG Hoogland
€ 525.000 k.k.

3828EZ Hoogland
€ 565.000 k.k.

3828ES Hoogland
€ 600.000 k.k.

3828BH Hoogland
€ 895.000 k.k.
€ 6.439/m²
