- Sold
Schoterlandseweg 101
8411XZ Jubbega
€ 425.000 k.k.
€ 4.670/m²
F
Save as favorite
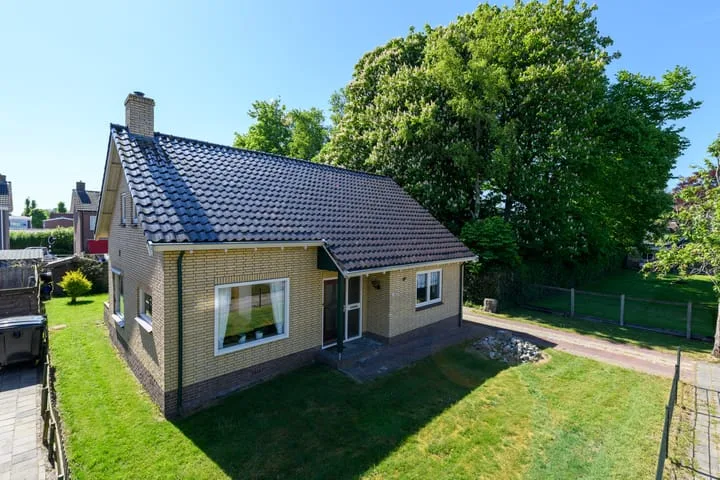
- Living area
- 91 m²
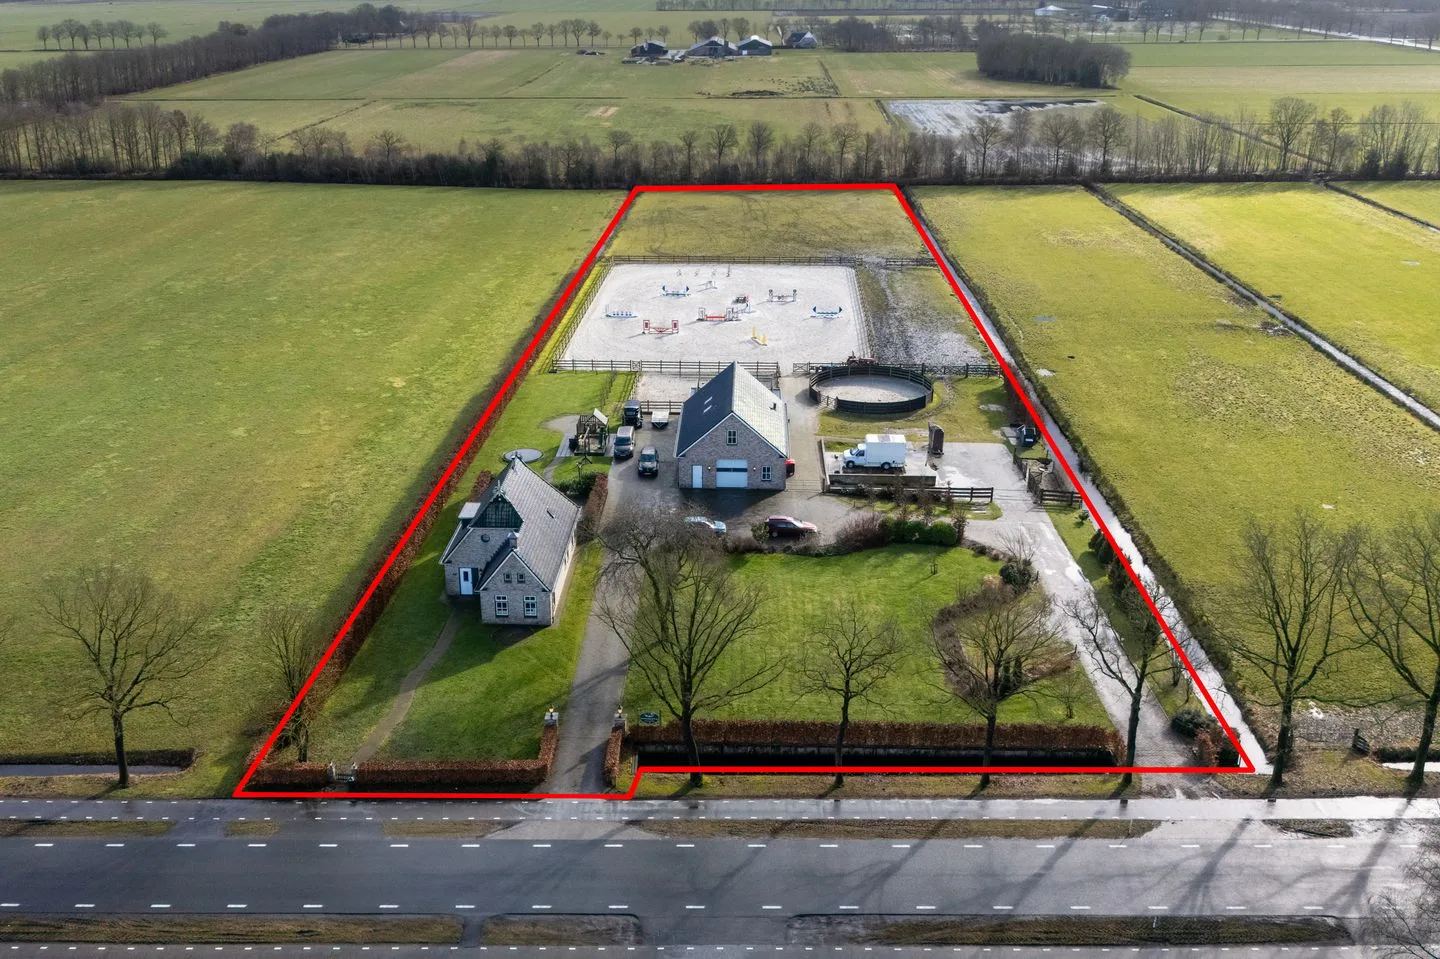
- Land area
- 5040 m²
- Bedrooms
- 3