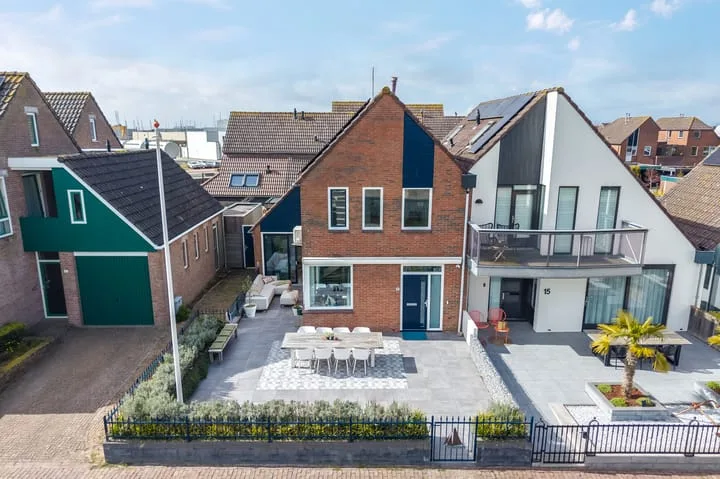
- Sold
Polle 9
8531DR Lemmer
€ 466.500
€ 4.712/m²
- Living area
- 99 m²
- Land area
- —
- Bedrooms
- 2
View 124 sold houses in Lemmer
Type to search. Use arrow down and arrow up to navigate through results and press Enter to open.
Hidden search suggestions.
Compare sold homes in Lemmer or view the current offering in this location directly.
On this page you will find recently sold homes in Lemmer. Use this overview to better estimate selling prices, popular neighborhoods, and the local housing supply before you choose a real estate agent. Also view the current housing supply with 178 houses in Lemmer.
8531DR Lemmer
€ 466.500
€ 4.712/m²
8531KZ Lemmer
€ 367.500 k.k.
€ 4.129/m²
8531LV Lemmer
€ 349.500 k.k.
€ 3.066/m²
8531EX Lemmer
€ 298.500 k.k.
€ 3.827/m²
8531HG Lemmer
€ 625.000 k.k.
€ 3.742/m²
8531RV Lemmer
€ 415.000 k.k.
€ 4.611/m²
8532AV Lemmer
€ 475.000 k.k.
€ 4.612/m²
8531AR Lemmer
€ 315.000 k.k.
€ 2.500/m²
8531NP Lemmer
€ 319.500 k.k.
€ 2.878/m²
8531RX Lemmer
€ 395.000 k.k.
€ 4.158/m²
8531BJ Lemmer
€ 279.000 k.k.
€ 2.098/m²
8531DB Lemmer
€ 297.500 k.k.
€ 2.399/m²
8531RD Lemmer
€ 427.500 k.k.
€ 3.685/m²
8532AN Lemmer
€ 549.500 k.k.
€ 4.696/m²
8531CD Lemmer
€ 365.000 k.k.
€ 3.882/m²
8531RP Lemmer
€ 438.500 k.k.
€ 3.684/m²
8531PJ Lemmer
€ 1.295.000 k.k.
€ 5.510/m²
8531LR Lemmer
€ 345.000 k.k.
€ 2.396/m²
8531ZB Lemmer
€ 529.000 k.k.
€ 3.186/m²
8532AB Lemmer
€ 529.500 k.k.
€ 4.857/m²
8532BM Lemmer
€ 459.500 k.k.
€ 3.282/m²
8531LP Lemmer
€ 289.000 k.k.
€ 2.557/m²
8531DC Lemmer
€ 297.500 k.k.
€ 2.609/m²
8531SB Lemmer
€ 548.500 k.k.
€ 3.656/m²
8531LC Lemmer
€ 269.000 k.k.
€ 2.744/m²
8531GB Lemmer
€ 285.000 k.k.
€ 3.202/m²
8531RW Lemmer
€ 385.000 k.k.
€ 4.277/m²
8532BG Lemmer
€ 638.000 k.k.
€ 3.752/m²
View recent sales and receive free quotes from local real estate agents. Compare more than 17 real estate agents in Lemmer.
Sold recently in Lemmer? Read the sales-oriented guide sell your home in Lemmer, compare sales agents in Lemmer or view the top sales agents in Lemmer for reference in your choice.
Real estate agents make sharper offers when they know you're comparing — ask for quotes for sale or purchase.
Short answers about housing prices, sold homes and comparing real estate agents in Lemmer.
The costs of a real estate agent in Lemmer vary per office, property type and sales approach. In Lemmer you can compare 17 real estate agents; therefore also look at the real estate agents in Lemmer to better compare fees, presentation and local experience.
On this page we currently show 124 sold houses in Lemmer from our selection. This helps you to better assess recent transactions and the local housing market.
Houses sold in Lemmer give insight into asking prices, house types and neighborhoods where recent transactions have taken place. Compare this also with the current housing stock in Lemmer to better understand the market.
You can use sold homes as a first market indication, but a local real estate agent can better take into account finishing, location, maintenance and current demand in Lemmer. Plan the next step via the guide selling a house in Lemmer.
Compare the 17 real estate agents in Lemmer on local sales experience, reviews, expected yield, commission and marketing approach. View real estate agents in Lemmer or the top 10 agents in Lemmer to quickly discover strong offices.
View current location data on residents, WOZ development, housing stock, energy consumption, business activity and safety in Lemmer. In 2025 were there 10.340 residents. The average WOZ value in 2025 is EUR 342.000.
These figures help to better assess and compare the housing stock in Lemmer with recent sold homes. Orient yourself then on suitable top real estate agents in Lemmer for sales advice in this region.
Residents
10.340
Last year: 2025
Average WOZ
EUR 342.000
Last year: 2025
Average income per person.
EUR 32.300
Source: AllNumbers
Crimes (current year)
308
Total registered
| Year | Residents |
|---|---|
| 2021 | 10.375 |
| 2022 | 10.395 |
| 2023 | 10.370 |
| 2024 | 10.355 |
| 2025 | 10.340 |
| Year | Average WOZ |
|---|---|
| 2021 | EUR 245.000 |
| 2022 | EUR 273.000 |
| 2023 | EUR 309.000 |
| 2024 | EUR 323.000 |
| 2025 | EUR 342.000 |
Hoger
1.890
Praktisch
2.210
Middelbaar
3.420
Europa
720
Nederland
8.800
Buiten Europa
815
Label A
1.605
Label B
1.433
Label C
1.389
Label D
425
Label G
259
Label E
154
Label F
123
Label A+++
120
Label A+
64
Label A++++
53
Label A++
50
Label A+++++
2
| Year | Gas (m3) | Electricity (kWh) |
|---|---|---|
| 2020 | 1.250 | 2.760 |
| 2021 | 1.390 | 2.830 |
| 2022 | 1.080 | 2.610 |
| 2023 | 900 | 2.540 |
| 2024 | 860 | 2.670 |
Hoekwoning
Gas: 860 • Electricity: 2.250
Huurwoning
Gas: 820 • Electricity: 1.840
Koopwoning
Gas: 940 • Electricity: 2.930
Appartement
Gas: 730 • Electricity: 1.790
Tussenwoning
Gas: 810 • Electricity: 2.080
Vrijstaande woning
Gas: 1.170 • Electricity: 3.560
Twee-onder-één-kap woning
Gas: 860 • Electricity: 2.750
Total number of company establishments: 1.545
| Period | Crimes |
|---|---|
| jan 2025 | 24 |
| jan 2026 | 16 |
| jul 2025 | 26 |
| jun 2025 | 28 |
| mei 2025 | 28 |
| mrt 2025 | 24 |
| nov 2024 | 21 |
| nov 2025 | 15 |
| okt 2024 | 22 |
| okt 2025 | 30 |
| sep 2024 | 28 |
| sep 2025 | 14 |
These figures give an indicative picture of safety trends in the living environment of Lemmer.
Short answers based on current local statistics, handy for a quick comparison of the living environment.
Lemmer telt in 2025 ongeveer 10.340 inwoners.
De gemiddelde WOZ-waarde in Lemmer is in 2025 circa € 342.000.
Het gemiddelde inkomen per inwoner in Lemmer ligt rond € 32.300 per jaar.
Voor het huidige jaar gaat het om ongeveer 308 geregistreerde misdrijven. Gebruik deze cijfers als indicatie en vergelijk trends per periode.
In Lemmer komt vooral "Tussenwoningen" veel voor, met ongeveer 1.402 woningen.