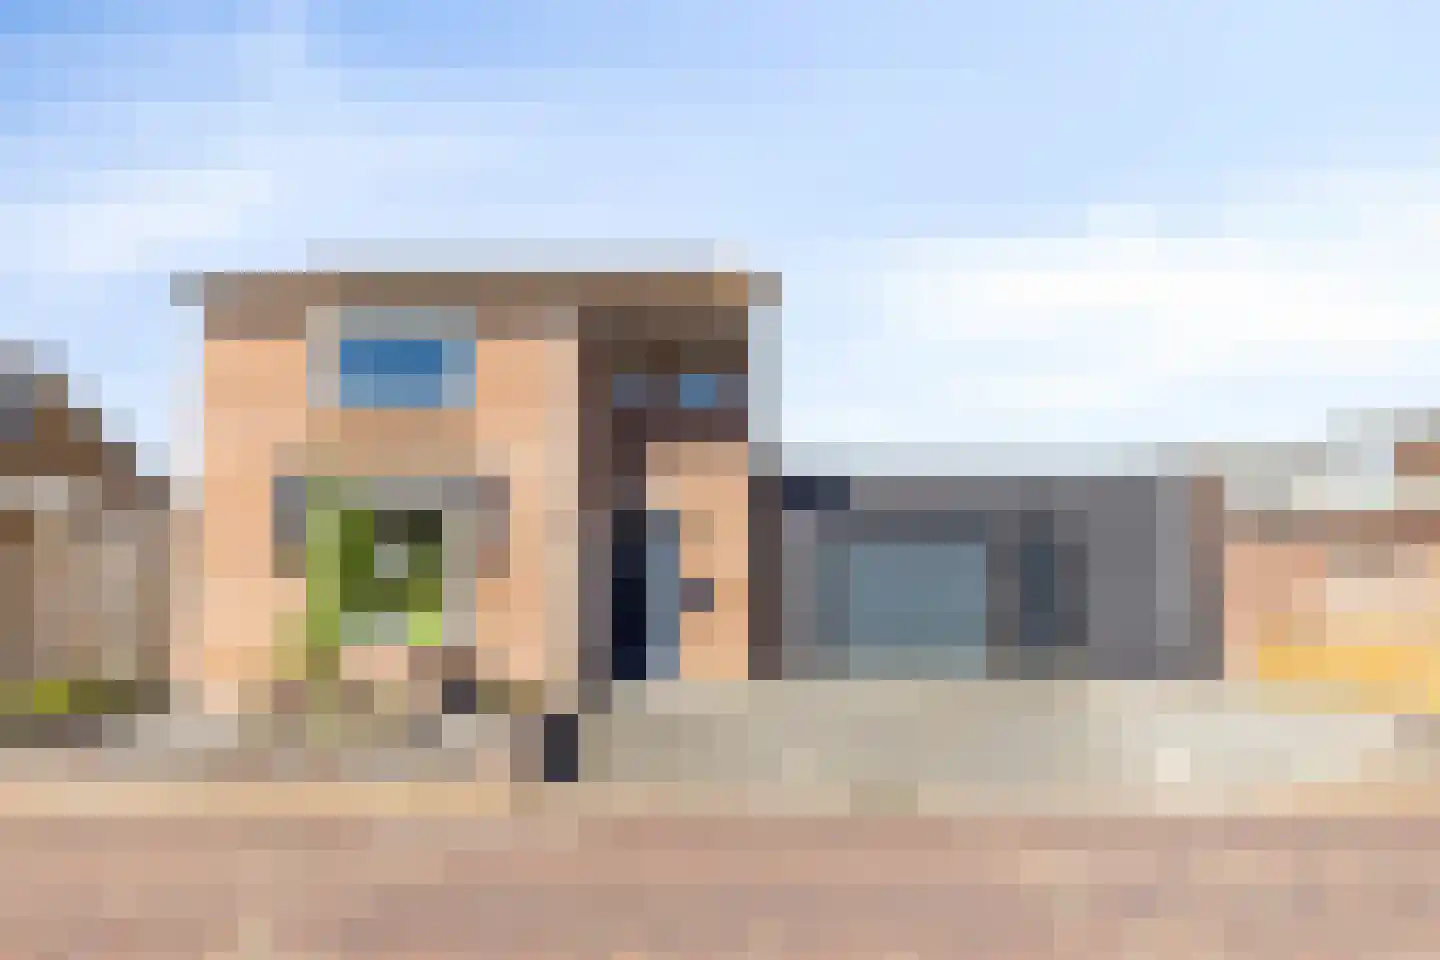
- Available
Klaverstraat 5
4456CB Lewedorp
€ 549.000 k.k.
€ 3.542/m²
- Living area
- 155 m²
- Land area
- 314 m²
- Bedrooms
- 4
Searching in 21 houses in Lewedorp
Type to search. Use arrow down and arrow up to navigate through results and press Enter to open.
Hidden search suggestions.
View current properties in Lewedorp or search targeted on street, postal code and property characteristics.
View the current housing stock in Lewedorp and quickly filter by price, living area, rooms and more. There are currently 21 houses in this place within our selection. View also 16 sold houses in Lewedorp for extra insight into the local housing market.
4456CB Lewedorp
€ 549.000 k.k.
€ 3.542/m²
4456AM Lewedorp
€ 425.000 k.k.
€ 3.269/m²
4456AH Lewedorp
€ 295.000 k.k.
4456BM Lewedorp
€ 349.000 k.k.
€ 2.837/m²
4456BR Lewedorp
€ 395.000 k.k.
€ 3.110/m²
4456RN Lewedorp
€ 598.000 k.k.
€ 4.095/m²
4456AL Lewedorp
€ 349.000 k.k.
€ 3.793/m²
4456AZ Lewedorp
€ 275.000 k.k.
€ 1.846/m²
4456AK Lewedorp
€ 239.000 k.k.
€ 3.064/m²
4456AL Lewedorp
€ 359.000 k.k.
€ 2.659/m²
4456BT Lewedorp
€ 369.000 k.k.
€ 3.653/m²
4456BM Lewedorp
€ 399.000 k.k.
€ 2.933/m²
4456BT Lewedorp
€ 389.000 k.k.
€ 3.635/m²
4456CB Lewedorp
€ 509.000 k.k.
€ 2.892/m²
4456CE Lewedorp
€ 899.000 k.k.
€ 4.994/m²
4456CB Lewedorp
€ 675.000 k.k.
€ 4.891/m²
4456CC Lewedorp
€ 639.000 k.k.
€ 3.276/m²
4456BD Lewedorp
€ 419.500 k.k.
€ 0/m²
4456BN Lewedorp
€ 450.000 k.k.
€ 0/m²
4456BR Lewedorp
€ 469.000 k.k.
€ 0/m²
4456BT Lewedorp
€ 575.000 k.k.
€ 4.492/m²
Get free quotes from real estate agents with local market knowledge. Compare more than 36 real estate agents in Lewedorp.
Selling a home in Lewedorp? Compare all real estate agents in Lewedorp or view the top 10 real estate agents in Lewedorp for extra context for your choice.
Real estate agents make sharper offers when they know you're comparing — ask for quotes for sale or purchase.
Practical answers about housing supply, sales and comparing real estate agents in Lewedorp.
The costs of a real estate agent in Lewedorp depend on commission, setup costs, property presentation and the chosen service. Compare the 36 real estate agents in Lewedorp via the real estate agent page and request multiple quotes to compare rates and approach well.
Within our selection, we are currently showing 21 houses in Lewedorp. View also the sold houses in Lewedorp to compare the current offering with recent transactions.
Take into account not only price and living area but also maintenance, energy label, location, outdoor space and sales status. This way you compare houses in Lewedorp on more than just the asking price.
A local real estate agent knows the neighborhoods, recent transactions and demand in Lewedorp. By comparing 36 real estate agents in the region you get a better insight into prices, sales strategy and expected yield; the top 10 in Lewedorp provides a useful starting point.
Yes, when making a sales plan, a valuation in Lewedorp is wise. You gain insight into a realistic asking price and can then compare offers from real estate agents specifically.
View current location data on residents, WOZ development, housing stock, energy consumption, business activity and safety in Lewedorp. In 2025 were there 1.835 residents. The average WOZ value in 2025 is EUR 330.000.
These figures help to better assess and compare the housing stock in Lewedorp with recent sold homes. Orient yourself then on suitable top real estate agents in Lewedorp for sales advice in this region.
Residents
1.835
Last year: 2025
Average WOZ
EUR 330.000
Last year: 2025
Average income per person.
EUR 32.000
Source: AllNumbers
Crimes (current year)
21
Total registered
| Year | Residents |
|---|---|
| 2021 | 1.735 |
| 2022 | 1.775 |
| 2023 | 1.825 |
| 2024 | 1.810 |
| 2025 | 1.835 |
| Year | Average WOZ |
|---|---|
| 2021 | EUR 238.000 |
| 2022 | EUR 261.000 |
| 2023 | EUR 288.000 |
| 2024 | EUR 306.000 |
| 2025 | EUR 330.000 |
Hoger
350
Praktisch
350
Middelbaar
670
Europa
105
Nederland
1.585
Buiten Europa
150
Label C
196
Label A
123
Label G
111
Label B
108
Label D
105
Label E
60
Label F
60
Label A++++
12
Label A++
8
Label A+
6
Label A+++
4
Label A+++++
0
| Year | Gas (m3) | Electricity (kWh) |
|---|---|---|
| 2020 | 1.260 | 2.770 |
| 2021 | 1.420 | 3.030 |
| 2022 | 1.080 | 2.850 |
| 2023 | 930 | 2.750 |
| 2024 | 890 | 2.880 |
Hoekwoning
Gas: 780 • Electricity: 2.050
Huurwoning
Gas: 770 • Electricity: 1.790
Koopwoning
Gas: 980 • Electricity: 3.020
Appartement
Gas: 740 • Electricity: 1.560
Tussenwoning
Gas: 630 • Electricity: 2.050
Vrijstaande woning
Gas: 1.140 • Electricity: 3.390
Twee-onder-één-kap woning
Gas: 880 • Electricity: 2.690
Total number of company establishments: 235
| Period | Crimes |
|---|---|
| jan 2026 | 2 |
| jul 2025 | 1 |
| jun 2025 | 1 |
| mei 2025 | 1 |
| mrt 2025 | 3 |
| mrt 2026 | 0 |
| nov 2024 | 2 |
| nov 2025 | 5 |
| okt 2024 | 3 |
| okt 2025 | 1 |
| sep 2024 | 1 |
| sep 2025 | 2 |
These figures give an indicative picture of safety trends in the living environment of Lewedorp.
Short answers based on current local statistics, handy for a quick comparison of the living environment.
Lewedorp telt in 2025 ongeveer 1.835 inwoners.
De gemiddelde WOZ-waarde in Lewedorp is in 2025 circa € 330.000.
Het gemiddelde inkomen per inwoner in Lewedorp ligt rond € 32.000 per jaar.
Voor het huidige jaar gaat het om ongeveer 21 geregistreerde misdrijven. Gebruik deze cijfers als indicatie en vergelijk trends per periode.
In Lewedorp komt vooral "Vrijstaande woningen" veel voor, met ongeveer 352 woningen.