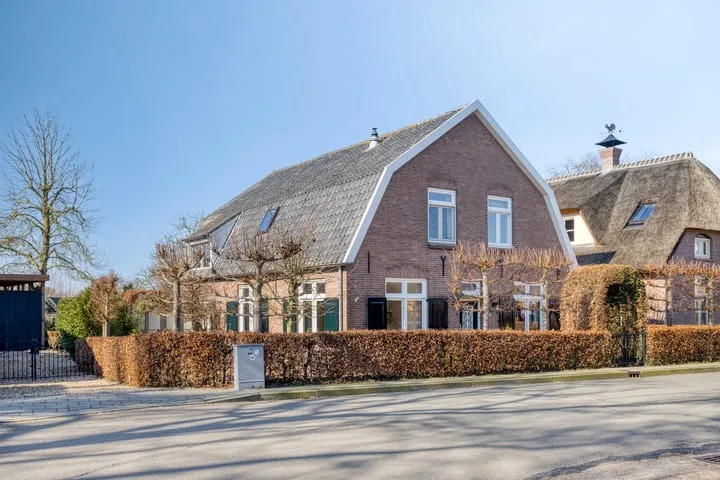
Houses sold in Maasbommel

View 15 sold houses in Maasbommel

Connected to: Vastgoed Nederland NVM Makelaars

On this page you will find recently sold homes in Maasbommel. Use this overview to better estimate selling prices, popular neighborhoods, and the local housing supply before you choose a real estate agent. Also view the current housing supply with 25 houses in Maasbommel.

Selection

Search and filter homes

Set your preferences and discover homes that suit you.

Total supply 242.722
Filters

Set price, area and other characteristics. Adjust a filter or click on Show homes. Location changes directly above.

Reset filters

You search for

  • Place Maasbommel
  • Status Sold

Huis verkopen in Maasbommel? Vergelijk verkoopmakelaars

Bekijk recente verkopen en ontvang gratis offertes van lokale makelaars. Vergelijk meer dan 34 makelaars in Maasbommel.

Free request a quote

  • Quotes in Maasbommel
  • Non-binding
  • Personal
  • Gratis tarieven vergelijken

Zelf je woning verkopen in Maasbommel? Vergelijk verkoopmakelaars in Maasbommel of bekijk de beste verkoopmakelaars in Maasbommel als referentie bij jouw keuze.

Vergelijk meerdere offertes

Makelaars maken scherpere voorstellen als ze weten dat je vergelijkt — vraag offertes aan voor verkoop of aankoop.

Frequently asked questions about sold homes in Maasbommel

Short answers about housing prices, sold homes and comparing real estate agents in Maasbommel.

Residential and neighborhood statistics in Maasbommel

View current location data on residents, WOZ development, housing stock, energy consumption, business activity and safety in Maasbommel. In 2026 were there 1.436 residents. The average WOZ value in 2025 is EUR 435.000.

These figures help to better assess and compare the housing stock in Maasbommel with recent sold homes. Orient yourself then on suitable top real estate agents in Maasbommel for sales advice in this region.

Residents

1.436

Last year: 2026

Average WOZ

EUR 435.000

Last year: 2025

Average income per person.

EUR 34.300

Source: AllNumbers

Crimes (current year)

35

Total registered

Demographics and WOZ development

Inhabitants per year

Inhabitants per year in Maasbommel
Year Residents
2021 1.345
2022 1.360
2023 1.385
2024 1.430
2025 1.440
2026 1.436

Annual WOZ value

WOZ value per year in Maasbommel
Year Average WOZ
2021 EUR 311.000
2022 EUR 331.000
2023 EUR 397.000
2024 EUR 408.000
2025 EUR 435.000

Composition of residents

Age build-up

65+: 340 0-15: 180 15-25: 120 25-45: 350 45-65: 450

Education level

Hoger

330

Praktisch

220

Middelbaar

580

Origin of residents (2025)

Europa

85

Nederland

1.275

Buiten Europa

80

Housing stock and construction periods

Types of homes

Hoekwoningen 76
Appartementen 28
Tussenwoningen 74
Vrijstaande woningen 321
Twee-onder-één-kap woningen 112

Construction period of buildings

Voor 1700 1
1700 tot 1900 39
1900 tot 1925 27
1925 tot 1950 89
1950 tot 1970 96
1970 tot 1980 132
1980 tot 1990 34
1990 tot 2000 139
2000 tot 2010 28
2010 tot 2020 35
2020 en later 103

Energy and sustainability

Energy label distribution

Label A

126

Label B

124

Label C

85

Label G

83

Label D

61

Label A+++

52

Label F

45

Label E

18

Label A++

8

Label A+

4

Label A++++

4

Label A+++++

0

Average energy consumption per year

Average energy consumption per year in Maasbommel
Year Gas (m3) Electricity (kWh)
2020 1.660 3.750
2021 1.820 3.780
2022 1.380 3.560
2023 1.070 3.440
2024 1.030 3.580

Consumption per house type

Hoekwoning

Gas: 740 • Electricity: 2.930

Huurwoning

Gas: 800 • Electricity: 2.150

Koopwoning

Gas: 1.160 • Electricity: 3.840

Appartement

Gas: 950 • Electricity: 2.390

Tussenwoning

Gas: 660 • Electricity: 2.480

Vrijstaande woning

Gas: 1.270 • Electricity: 4.000

Twee-onder-één-kap woning

Gas: 920 • Electricity: 2.940

Business activity in Maasbommel (2025)

Handel en HORECA 35
Nijverheid en energie 55
Zakelijke dienstverlening 55
Overheid, onderwijs en zorg 40
Landbouw, bosbouw en visserij 25
Vervoer, informatie en communicatie 0
Financiele diensten en onroerendgoed 10
Cultuur, recreatie en overige diensten 20

Total number of company establishments: 250

Recent crime statistics

Recent crime statistics in Maasbommel
Period Crimes
jan 2026 1
jul 2025 3
jun 2025 1
mei 2025 3
mrt 2025 3
mrt 2026 3
nov 2024 0
nov 2025 4
okt 2024 1
okt 2025 3
sep 2024 1
sep 2025 3

These figures give an indicative picture of safety trends in the living environment of Maasbommel.

Frequently asked questions about living in Maasbommel

Short answers based on current local statistics, handy for a quick comparison of the living environment.

Hoeveel inwoners heeft Maasbommel?

Maasbommel telt in 2026 ongeveer 1.436 inwoners.

Wat is de gemiddelde WOZ-waarde in Maasbommel?

De gemiddelde WOZ-waarde in Maasbommel is in 2025 circa € 435.000.

Wat is het gemiddelde inkomen per inwoner in Maasbommel?

Het gemiddelde inkomen per inwoner in Maasbommel ligt rond € 34.300 per jaar.

Hoe veilig is wonen in Maasbommel?

Voor het huidige jaar gaat het om ongeveer 35 geregistreerde misdrijven. Gebruik deze cijfers als indicatie en vergelijk trends per periode.

Welke woningtypen komen het meest voor in Maasbommel?

In Maasbommel komt vooral "Vrijstaande woningen" veel voor, met ongeveer 321 woningen.

Receive free, non-binding quotes

Compare multiple real estate agents and choose the best match.