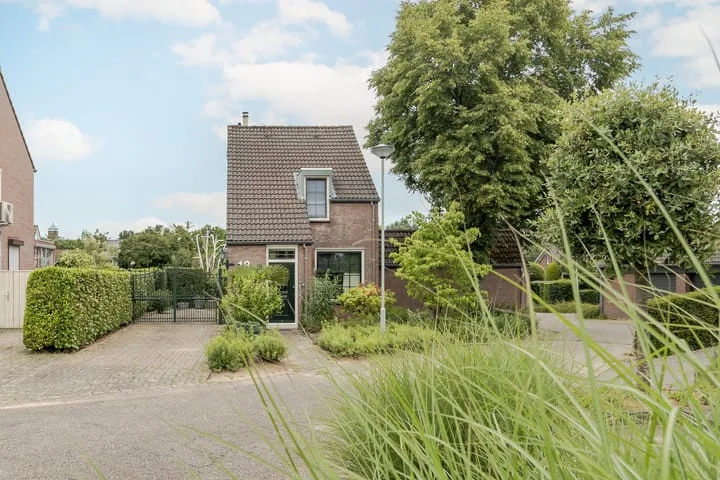
- Sold
St.Servaaslaan 39
6074BM Melick
€ 360.000 k.k.
€ 3.214/m²
- Living area
- 112 m²
- Land area
- 337 m²
- Bedrooms
- 3
View 38 sold houses in Melick
Type to search. Use arrow down and arrow up to navigate through results and press Enter to open.
Hidden search suggestions.
Compare sold homes in Melick or view the current offering in this location directly.
On this page you will find recently sold homes in Melick. Use this overview to better estimate selling prices, popular neighborhoods, and the local housing supply before you choose a real estate agent. Also view the current housing supply with 46 houses in Melick.
6074BM Melick
€ 360.000 k.k.
€ 3.214/m²
6074HN Melick
€ 349.500 k.k.
€ 2.730/m²
6074CK Melick
€ 447.000 k.k.
€ 3.438/m²
6074GG Melick
€ 347.500 k.k.
€ 3.278/m²
6074BH Melick
€ 250.000 k.k.
€ 2.777/m²
6074CK Melick
€ 400.000 k.k.
€ 4.040/m²
6074HG Melick
€ 450.000 k.k.
€ 3.125/m²
6074GG Melick
€ 239.000 k.k.
€ 3.463/m²
6074BZ Melick
Price upon request
6074EM Melick
€ 425.000 k.k.
€ 2.575/m²
6074CA Melick
€ 415.000 k.k.
€ 3.458/m²
6074HV Melick
€ 700.000 k.k.
€ 2.517/m²
6074DN Melick
€ 625.000 k.k.
€ 2.551/m²
6074BS Melick
€ 325.000 k.k.
€ 0/m²
6074EA Melick
€ 365.000 k.k.
€ 0/m²
6074GB Melick
€ 475.000 k.k.
€ 0/m²
6074CJ Melick
€ 399.500 k.k.
€ 0/m²
6074HN Melick
€ 275.000 k.k.
€ 3.313/m²
6074DH Melick
€ 325.000 k.k.
€ 4.166/m²
6074CG Melick
€ 359.000 k.k.
€ 3.176/m²
6074AE Melick
€ 455.000 k.k.
€ 4.252/m²
6074EW Melick
€ 435.000 k.k.
€ 3.595/m²
6074DG Melick
€ 275.000 k.k.
€ 3.273/m²
6074ET Melick
€ 395.000 k.k.
€ 3.526/m²
6074EB Melick
€ 385.000 k.k.
€ 3.850/m²
6074BZ Melick
€ 299.500 k.k.
€ 2.475/m²
6074HN Melick
€ 485.000 k.k.
€ 3.514/m²
6074CB Melick
€ 375.000 k.k.
€ 2.952/m²
Get free quotes from realtors with local market knowledge in Melick.
Selling a home in Melick? Compare real estate agents who know the local housing market. Also check out all real estate agents in Melick or the top 10 real estate agents in Melick for extra context for your choice.
By comparing brokers and requesting quotes
Short answers about housing prices, sold homes and comparing real estate agents in Melick.
The costs of a real estate agent in Melick vary per office, property type and sales approach. Therefore, compare multiple quotes and also look at the real estate agents in Melick to better compare rates, presentation and local experience.
On this page we currently show 38 sold houses in Melick from our selection. This helps you to better assess recent transactions and the local housing market.
Verkochte woningen in Melick geven inzicht in vraagprijzen, woningtypes en buurten waar recent transacties hebben plaatsgevonden. Vergelijk dit ook met het actuele woningaanbod in Melick om de markt beter te duiden.
Je kunt verkochte woningen gebruiken als eerste marktindicatie, maar een lokale makelaar kan beter rekening houden met afwerking, ligging, onderhoud en actuele vraag in Melick.
Vergelijk makelaars in Melick op lokale verkoopervaring, reviews, verwachte opbrengst, courtage en marketingaanpak. De top 10 makelaars in Melick helpt om snel sterke kantoren te ontdekken.
View current location data on residents, WOZ development, housing stock, energy consumption, business activity and safety in Melick. In 2026 were there 3.711 residents. The average WOZ value in 2025 is EUR 328.000.
These figures help to better assess and compare the housing stock in Melick with recent sold homes. Orient yourself then on suitable top real estate agents in Melick for sales advice in this region.
Residents
3.711
Last year: 2026
Average WOZ
EUR 328.000
Last year: 2025
Average income per person.
EUR 34.200
Source: AllNumbers
Crimes (current year)
122
Total registered
| Year | Residents |
|---|---|
| 2021 | 3.640 |
| 2022 | 3.625 |
| 2023 | 3.670 |
| 2024 | 3.705 |
| 2025 | 3.715 |
| 2026 | 3.711 |
| Year | Average WOZ |
|---|---|
| 2021 | EUR 248.000 |
| 2022 | EUR 264.000 |
| 2023 | EUR 311.000 |
| 2024 | EUR 310.000 |
| 2025 | EUR 328.000 |
Hoger
920
Praktisch
560
Middelbaar
1.210
Europa
455
Nederland
2.950
Buiten Europa
310
Label C
523
Label D
301
Label A
291
Label B
257
Label F
137
Label G
84
Label E
59
Label A+++
36
Label A++
32
Label A+
13
Label A++++
5
Label A+++++
0
| Year | Gas (m3) | Electricity (kWh) |
|---|---|---|
| 2020 | 1.430 | 3.130 |
| 2021 | 1.620 | 3.160 |
| 2022 | 1.270 | 2.950 |
| 2023 | 1.010 | 2.870 |
| 2024 | 960 | 2.940 |
Hoekwoning
Gas: 890 • Electricity: 2.700
Huurwoning
Gas: 720 • Electricity: 2.010
Koopwoning
Gas: 1.110 • Electricity: 3.150
Appartement
Gas: 610 • Electricity: 1.790
Tussenwoning
Gas: 860 • Electricity: 2.660
Vrijstaande woning
Gas: 1.340 • Electricity: 3.520
Twee-onder-één-kap woning
Gas: 970 • Electricity: 2.800
Total number of company establishments: 330
| Period | Crimes |
|---|---|
| jan 2026 | 6 |
| jul 2025 | 6 |
| jun 2025 | 9 |
| mei 2025 | 17 |
| mrt 2025 | 13 |
| mrt 2026 | 13 |
| nov 2024 | 8 |
| nov 2025 | 1 |
| okt 2024 | 15 |
| okt 2025 | 8 |
| sep 2024 | 5 |
| sep 2025 | 12 |
These figures give an indicative picture of safety trends in the living environment of Melick.
Short answers based on current local statistics, handy for a quick comparison of the living environment.
Melick telt in 2026 ongeveer 3.711 inwoners.
De gemiddelde WOZ-waarde in Melick is in 2025 circa € 328.000.
Het gemiddelde inkomen per inwoner in Melick ligt rond € 34.200 per jaar.
Voor het huidige jaar gaat het om ongeveer 122 geregistreerde misdrijven. Gebruik deze cijfers als indicatie en vergelijk trends per periode.
In Melick komt vooral "Vrijstaande woningen" veel voor, met ongeveer 517 woningen.