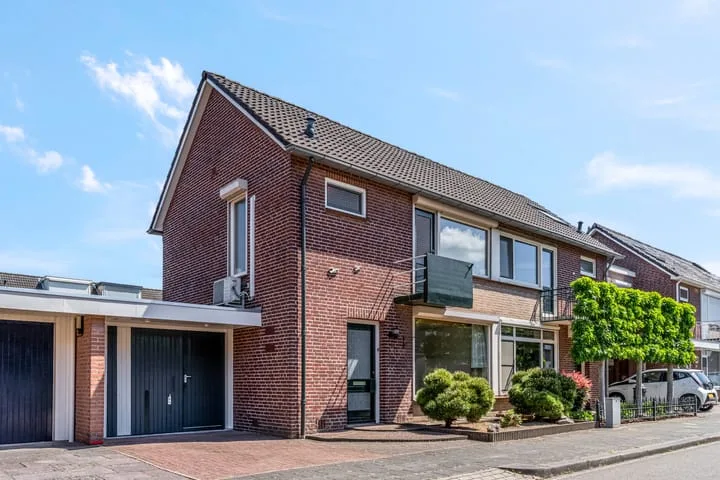
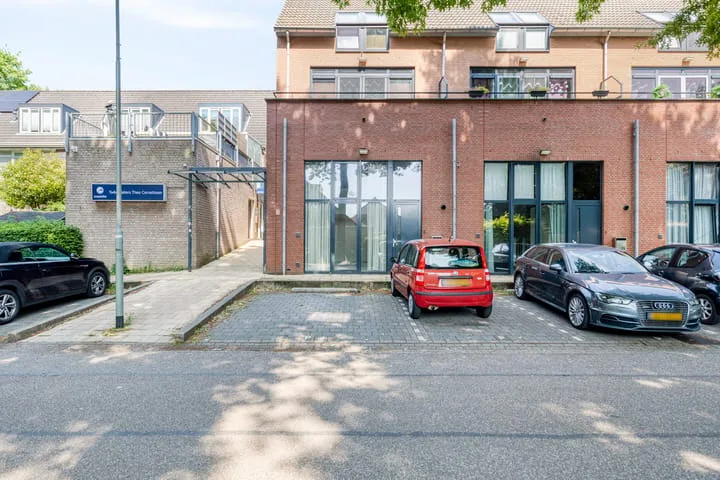
- Sold
Prinsenweg 11 k
6584AZ Molenhoek
€ 289.000 k.k.
€ 4.070/m²
- Living area
- 71 m²
- Land area
- —
- Bedrooms
- 1
View 33 sold houses in Molenhoek
Type to search. Use arrow down and arrow up to navigate through results and press Enter to open.
Hidden search suggestions.
Compare sold homes in Molenhoek or view the current offering in this location directly.
On this page you will find recently sold homes in Molenhoek. Use this overview to better estimate selling prices, popular neighborhoods, and the local housing supply before you choose a real estate agent. Also view the current housing supply with 45 houses in Molenhoek.
6584AZ Molenhoek
€ 289.000 k.k.
€ 4.070/m²
6584BC Molenhoek
€ 447.500 k.k.
€ 3.416/m²
6584BV Molenhoek
€ 495.000 k.k.
€ 3.413/m²
6584AM Molenhoek
€ 395.000 k.k.
€ 3.726/m²
6584CW Molenhoek
€ 495.000 k.k.
€ 3.510/m²
Bekijk recente verkopen en ontvang gratis offertes van lokale verkoopmakelaars in Molenhoek.
Zelf je woning verkopen in Molenhoek? Vergelijk verkoopmakelaars in Molenhoek of bekijk de beste verkoopmakelaars in Molenhoek als referentie bij jouw keuze.
Makelaars maken scherpere voorstellen als ze weten dat je vergelijkt — vraag offertes aan voor verkoop of aankoop.
Short answers about housing prices, sold homes and comparing real estate agents in Molenhoek.
The costs of a real estate agent in Molenhoek vary per office, property type and sales approach. Therefore, compare multiple quotes and also look at the real estate agents in Molenhoek to better compare rates, presentation and local experience.
On this page we currently show 33 sold houses in Molenhoek from our selection. This helps you to better assess recent transactions and the local housing market.
Houses sold in Molenhoek give insight into asking prices, house types and neighborhoods where recent transactions have taken place. Compare this also with the current housing stock in Molenhoek to better understand the market.
You can use sold homes as a first market indication, but a local real estate agent can better take into account finishing, location, maintenance and current demand in Molenhoek.
Vergelijk makelaars in Molenhoek op lokale verkoopervaring, reviews, verwachte opbrengst, courtage en marketingaanpak. Bekijk verkoopmakelaars in Molenhoek of de top 10 makelaars in Molenhoek om snel sterke kantoren te ontdekken.
View current location data on residents, WOZ development, housing stock, energy consumption, business activity and safety in Molenhoek. In 2026 were there 3.771 residents. The average WOZ value in 2025 is EUR 449.000.
These figures help to better assess and compare the housing stock in Molenhoek with recent sold homes. Orient yourself then on suitable top real estate agents in Molenhoek for sales advice in this region.
Residents
3.771
Last year: 2026
Average WOZ
EUR 449.000
Last year: 2025
Average income per person.
EUR 39.100
Source: AllNumbers
Crimes (current year)
113
Total registered
| Year | Residents |
|---|---|
| 2021 | 3.690 |
| 2022 | 3.735 |
| 2023 | 3.740 |
| 2024 | 3.725 |
| 2025 | 3.725 |
| 2026 | 3.771 |
| Year | Average WOZ |
|---|---|
| 2021 | EUR 324.000 |
| 2022 | EUR 347.000 |
| 2023 | EUR 419.000 |
| 2024 | EUR 422.000 |
| 2025 | EUR 449.000 |
Hoger
1.350
Praktisch
440
Middelbaar
1.000
Europa
275
Nederland
3.130
Buiten Europa
325
Label C
565
Label B
363
Label A
345
Label D
204
Label A++++
64
Label F
60
Label G
28
Label A+++
26
Label E
23
Label A+
6
Label A++
4
Label A+++++
0
| Year | Gas (m3) | Electricity (kWh) |
|---|---|---|
| 2020 | 1.460 | 3.120 |
| 2021 | 1.660 | 3.210 |
| 2022 | 1.300 | 2.930 |
| 2023 | 1.070 | 2.800 |
| 2024 | 1.000 | 2.840 |
Hoekwoning
Gas: 1.050 • Electricity: 2.640
Huurwoning
Gas: 810 • Electricity: 2.010
Koopwoning
Gas: 1.140 • Electricity: 3.040
Appartement
Gas: 710 • Electricity: 1.790
Tussenwoning
Gas: 900 • Electricity: 2.410
Vrijstaande woning
Gas: 1.450 • Electricity: 4.080
Twee-onder-één-kap woning
Gas: 1.190 • Electricity: 2.800
Total number of company establishments: 505
| Period | Crimes |
|---|---|
| jan 2026 | 6 |
| jul 2025 | 5 |
| jun 2025 | 5 |
| mei 2025 | 8 |
| mrt 2025 | 12 |
| mrt 2026 | 7 |
| nov 2024 | 7 |
| nov 2025 | 5 |
| okt 2024 | 10 |
| okt 2025 | 14 |
| sep 2024 | 12 |
| sep 2025 | 12 |
These figures give an indicative picture of safety trends in the living environment of Molenhoek.
Short answers based on current local statistics, handy for a quick comparison of the living environment.
Molenhoek telt in 2026 ongeveer 3.771 inwoners.
De gemiddelde WOZ-waarde in Molenhoek is in 2025 circa € 449.000.
Het gemiddelde inkomen per inwoner in Molenhoek ligt rond € 39.100 per jaar.
Voor het huidige jaar gaat het om ongeveer 113 geregistreerde misdrijven. Gebruik deze cijfers als indicatie en vergelijk trends per periode.
In Molenhoek komt vooral "Tussenwoningen" veel voor, met ongeveer 599 woningen.