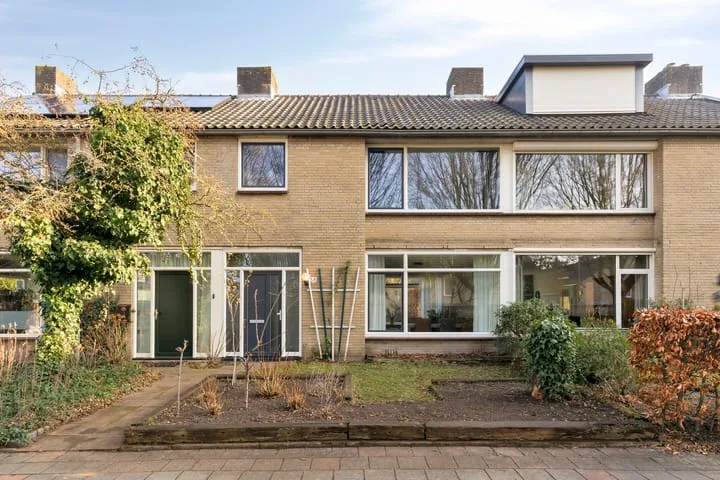
- Available
Stiftstraat 20
6584AL Molenhoek
€ 639.000 k.k.
€ 4.438/m²
- Living area
- 144 m²
- Land area
- 473 m²
- Bedrooms
- 4
Searching in 45 houses in Molenhoek
Type to search. Use arrow down and arrow up to navigate through results and press Enter to open.
Hidden search suggestions.
View current properties in Molenhoek or search targeted on street, postal code and property characteristics.
View the current housing stock in Molenhoek and quickly filter by price, living area, rooms and more. There are currently 45 houses in this place within our selection. View also 34 sold houses in Molenhoek for extra insight into the local housing market.
6584AL Molenhoek
€ 639.000 k.k.
€ 4.438/m²
6584CG Molenhoek
€ 550.000 k.k.
€ 3.107/m²
6584AJ Molenhoek
€ 775.000 k.k.
€ 4.429/m²
6584AL Molenhoek
€ 498.000 k.k.
6584AB Molenhoek
€ 1.475.000 k.k.
€ 4.390/m²
6584CM Molenhoek
€ 295.000 k.k.
€ 3.782/m²
6584CJ Molenhoek
€ 550.000 k.k.
€ 3.901/m²
6584AP Molenhoek
€ 795.000 k.k.
6584BN Molenhoek
€ 395.000 k.k.
€ 3.038/m²
6584CZ Molenhoek
€ 615.000 k.k.
€ 3.968/m²
6584AA Molenhoek
€ 265.000 k.k.
€ 5.761/m²
6584AZ Molenhoek
€ 295.000 k.k.
€ 3.882/m²
6584CL Molenhoek
€ 398.000 k.k.
€ 3.790/m²
6584AM Molenhoek
€ 380.000 k.k.
€ 4.130/m²
6584AJ Molenhoek
€ 545.000 k.k.
€ 4.257/m²
6584AS Molenhoek
€ 699.000 k.k.
€ 4.112/m²
6584AS Molenhoek
€ 625.000 k.k.
€ 4.111/m²
6584CR Molenhoek
€ 565.000 k.k.
€ 3.951/m²
6584AZ Molenhoek
€ 350.000 k.k.
€ 3.398/m²
6584CR Molenhoek
€ 538.000 k.k.
€ 3.898/m²
6584BA Molenhoek
€ 350.000 k.k.
€ 4.320/m²
6584BV Molenhoek
€ 529.000 k.k.
€ 3.457/m²
6584BM Molenhoek
€ 395.000 k.k.
€ 2.904/m²
6584CK Molenhoek
€ 925.000 k.k.
€ 3.987/m²
6584CH Molenhoek
€ 425.000 k.k.
€ 3.971/m²
6584BP Molenhoek
€ 385.000 k.k.
€ 3.701/m²
6584BT Molenhoek
€ 525.000 k.k.
€ 3.776/m²
6584AZ Molenhoek
€ 365.000 k.k.
€ 3.476/m²
Get free quotes from real estate agents with local market knowledge. Compare more than 69 real estate agents in Molenhoek.
Selling a home in Molenhoek? Compare all real estate agents in Molenhoek or view the top 10 real estate agents in Molenhoek for extra context for your choice.
Real estate agents make sharper offers when they know you're comparing — ask for quotes for sale or purchase.
Practical answers about housing supply, sales and comparing real estate agents in Molenhoek.
The costs of a real estate agent in Molenhoek depend on commission, setup costs, property presentation and the chosen service. Compare the 69 real estate agents in Molenhoek via the real estate agent page and request multiple quotes to compare rates and approach well.
Within our selection, we are currently showing 45 houses in Molenhoek. View also the sold houses in Molenhoek to compare the current offering with recent transactions.
Take into account not only price and living area but also maintenance, energy label, location, outdoor space and sales status. This way you compare houses in Molenhoek on more than just the asking price.
A local real estate agent knows the neighborhoods, recent transactions and demand in Molenhoek. By comparing 69 real estate agents in the region you get a better insight into prices, sales strategy and expected yield; the top 10 in Molenhoek provides a useful starting point.
Yes, when making a sales plan, a valuation in Molenhoek is wise. You gain insight into a realistic asking price and can then compare offers from real estate agents specifically.
View current location data on residents, WOZ development, housing stock, energy consumption, business activity and safety in Molenhoek. In 2026 were there 3.771 residents. The average WOZ value in 2025 is EUR 449.000.
These figures help to better assess and compare the housing stock in Molenhoek with recent sold homes. Orient yourself then on suitable top real estate agents in Molenhoek for sales advice in this region.
Residents
3.771
Last year: 2026
Average WOZ
EUR 449.000
Last year: 2025
Average income per person.
EUR 39.100
Source: AllNumbers
Crimes (current year)
113
Total registered
| Year | Residents |
|---|---|
| 2021 | 3.690 |
| 2022 | 3.735 |
| 2023 | 3.740 |
| 2024 | 3.725 |
| 2025 | 3.725 |
| 2026 | 3.771 |
| Year | Average WOZ |
|---|---|
| 2021 | EUR 324.000 |
| 2022 | EUR 347.000 |
| 2023 | EUR 419.000 |
| 2024 | EUR 422.000 |
| 2025 | EUR 449.000 |
Hoger
1.350
Praktisch
440
Middelbaar
1.000
Europa
275
Nederland
3.130
Buiten Europa
325
Label C
565
Label B
363
Label A
345
Label D
204
Label A++++
64
Label F
60
Label G
28
Label A+++
26
Label E
23
Label A+
6
Label A++
4
Label A+++++
0
| Year | Gas (m3) | Electricity (kWh) |
|---|---|---|
| 2020 | 1.460 | 3.120 |
| 2021 | 1.660 | 3.210 |
| 2022 | 1.300 | 2.930 |
| 2023 | 1.070 | 2.800 |
| 2024 | 1.000 | 2.840 |
Hoekwoning
Gas: 1.050 • Electricity: 2.640
Huurwoning
Gas: 810 • Electricity: 2.010
Koopwoning
Gas: 1.140 • Electricity: 3.040
Appartement
Gas: 710 • Electricity: 1.790
Tussenwoning
Gas: 900 • Electricity: 2.410
Vrijstaande woning
Gas: 1.450 • Electricity: 4.080
Twee-onder-één-kap woning
Gas: 1.190 • Electricity: 2.800
Total number of company establishments: 505
| Period | Crimes |
|---|---|
| jan 2026 | 6 |
| jul 2025 | 5 |
| jun 2025 | 5 |
| mei 2025 | 8 |
| mrt 2025 | 12 |
| mrt 2026 | 7 |
| nov 2024 | 7 |
| nov 2025 | 5 |
| okt 2024 | 10 |
| okt 2025 | 14 |
| sep 2024 | 12 |
| sep 2025 | 12 |
These figures give an indicative picture of safety trends in the living environment of Molenhoek.
Short answers based on current local statistics, handy for a quick comparison of the living environment.
Molenhoek telt in 2026 ongeveer 3.771 inwoners.
De gemiddelde WOZ-waarde in Molenhoek is in 2025 circa € 449.000.
Het gemiddelde inkomen per inwoner in Molenhoek ligt rond € 39.100 per jaar.
Voor het huidige jaar gaat het om ongeveer 113 geregistreerde misdrijven. Gebruik deze cijfers als indicatie en vergelijk trends per periode.
In Molenhoek komt vooral "Tussenwoningen" veel voor, met ongeveer 599 woningen.