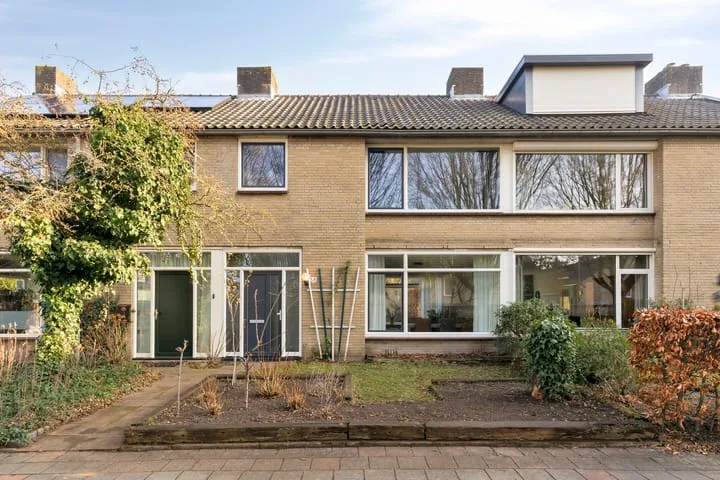
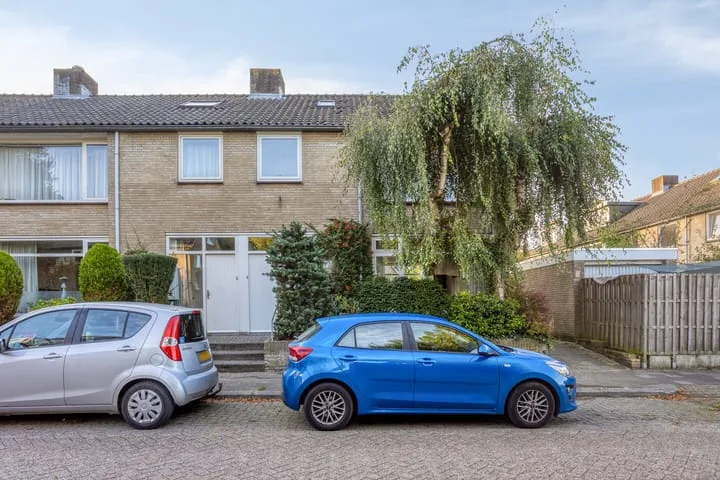
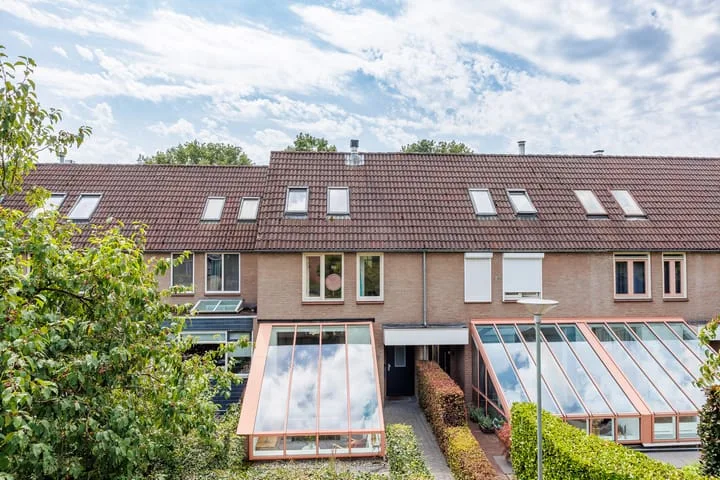
Houses sold in Molenhoek

View 33 sold houses in Molenhoek

Connected to: Vastgoed Nederland NVM Makelaars

On this page you will find recently sold homes in Molenhoek. Use this overview to better estimate selling prices, popular neighborhoods, and the local housing supply before you choose a real estate agent. Also view the current housing supply with 45 houses in Molenhoek.

Selection

Search and filter homes

Set your preferences and discover homes that suit you.

Total supply 241.423
Filters

Set price, area and other characteristics. Adjust a filter or click on Show homes. Location changes directly above.

Reset filters

You search for

  • Place Molenhoek
  • Status Sold

Huis verkopen in Molenhoek? Vergelijk verkoopmakelaars

Bekijk recente verkopen en ontvang gratis offertes van lokale verkoopmakelaars in Molenhoek.

Free request a quote

  • Quotes in Molenhoek
  • Non-binding
  • Personal
  • Gratis tarieven vergelijken

Zelf je woning verkopen in Molenhoek? Vergelijk verkoopmakelaars in Molenhoek of bekijk de beste verkoopmakelaars in Molenhoek als referentie bij jouw keuze.

Vergelijk meerdere offertes

Makelaars maken scherpere voorstellen als ze weten dat je vergelijkt — vraag offertes aan voor verkoop of aankoop.

Frequently asked questions about sold homes in Molenhoek

Short answers about housing prices, sold homes and comparing real estate agents in Molenhoek.

Residential and neighborhood statistics in Molenhoek

View current location data on residents, WOZ development, housing stock, energy consumption, business activity and safety in Molenhoek. In 2026 were there 3.771 residents. The average WOZ value in 2025 is EUR 449.000.

These figures help to better assess and compare the housing stock in Molenhoek with recent sold homes. Orient yourself then on suitable top real estate agents in Molenhoek for sales advice in this region.

Residents

3.771

Last year: 2026

Average WOZ

EUR 449.000

Last year: 2025

Average income per person.

EUR 39.100

Source: AllNumbers

Crimes (current year)

113

Total registered

Demographics and WOZ development

Inhabitants per year

Inhabitants per year in Molenhoek
Year Residents
2021 3.690
2022 3.735
2023 3.740
2024 3.725
2025 3.725
2026 3.771

Annual WOZ value

WOZ value per year in Molenhoek
Year Average WOZ
2021 EUR 324.000
2022 EUR 347.000
2023 EUR 419.000
2024 EUR 422.000
2025 EUR 449.000

Composition of residents

Age build-up

65+: 1.090 0-15: 485 15-25: 395 25-45: 755 45-65: 1.055

Education level

Hoger

1.350

Praktisch

440

Middelbaar

1.000

Origin of residents (2025)

Europa

275

Nederland

3.130

Buiten Europa

325

Housing stock and construction periods

Types of homes

Hoekwoningen 327
Appartementen 292
Tussenwoningen 599
Vrijstaande woningen 383
Twee-onder-één-kap woningen 212

Construction period of buildings

Voor 1700 0
1700 tot 1900 3
1900 tot 1925 19
1925 tot 1950 42
1950 tot 1970 398
1970 tot 1980 378
1980 tot 1990 446
1990 tot 2000 125
2000 tot 2010 116
2010 tot 2020 78
2020 en later 124

Energy and sustainability

Energy label distribution

Label C

565

Label B

363

Label A

345

Label D

204

Label A++++

64

Label F

60

Label G

28

Label A+++

26

Label E

23

Label A+

6

Label A++

4

Label A+++++

0

Average energy consumption per year

Average energy consumption per year in Molenhoek
Year Gas (m3) Electricity (kWh)
2020 1.460 3.120
2021 1.660 3.210
2022 1.300 2.930
2023 1.070 2.800
2024 1.000 2.840

Consumption per house type

Hoekwoning

Gas: 1.050 • Electricity: 2.640

Huurwoning

Gas: 810 • Electricity: 2.010

Koopwoning

Gas: 1.140 • Electricity: 3.040

Appartement

Gas: 710 • Electricity: 1.790

Tussenwoning

Gas: 900 • Electricity: 2.410

Vrijstaande woning

Gas: 1.450 • Electricity: 4.080

Twee-onder-één-kap woning

Gas: 1.190 • Electricity: 2.800

Business activity in Molenhoek (2025)

Handel en HORECA 60
Nijverheid en energie 55
Zakelijke dienstverlening 150
Overheid, onderwijs en zorg 120
Landbouw, bosbouw en visserij 5
Vervoer, informatie en communicatie 30
Financiele diensten en onroerendgoed 35
Cultuur, recreatie en overige diensten 45

Total number of company establishments: 505

Recent crime statistics

Recent crime statistics in Molenhoek
Period Crimes
jan 2026 6
jul 2025 5
jun 2025 5
mei 2025 8
mrt 2025 12
mrt 2026 7
nov 2024 7
nov 2025 5
okt 2024 10
okt 2025 14
sep 2024 12
sep 2025 12

These figures give an indicative picture of safety trends in the living environment of Molenhoek.

Frequently asked questions about living in Molenhoek

Short answers based on current local statistics, handy for a quick comparison of the living environment.

Hoeveel inwoners heeft Molenhoek?

Molenhoek telt in 2026 ongeveer 3.771 inwoners.

Wat is de gemiddelde WOZ-waarde in Molenhoek?

De gemiddelde WOZ-waarde in Molenhoek is in 2025 circa € 449.000.

Wat is het gemiddelde inkomen per inwoner in Molenhoek?

Het gemiddelde inkomen per inwoner in Molenhoek ligt rond € 39.100 per jaar.

Hoe veilig is wonen in Molenhoek?

Voor het huidige jaar gaat het om ongeveer 113 geregistreerde misdrijven. Gebruik deze cijfers als indicatie en vergelijk trends per periode.

Welke woningtypen komen het meest voor in Molenhoek?

In Molenhoek komt vooral "Tussenwoningen" veel voor, met ongeveer 599 woningen.

Gratis vrijblijvende offertes ontvangen

Vergelijk meerdere makelaars en kies de beste match.