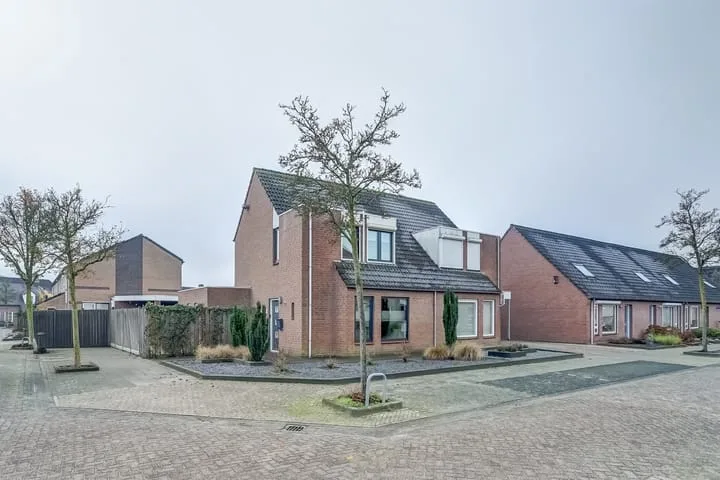
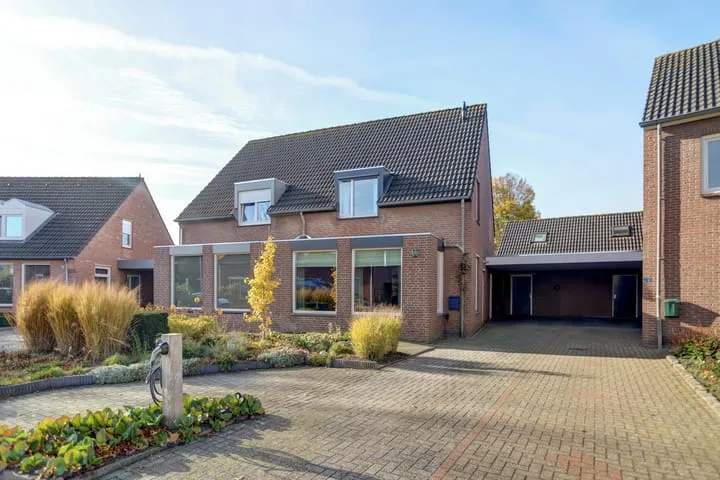
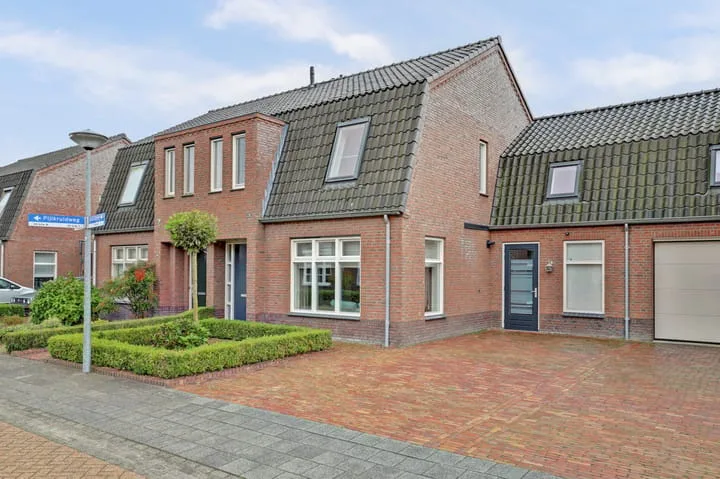
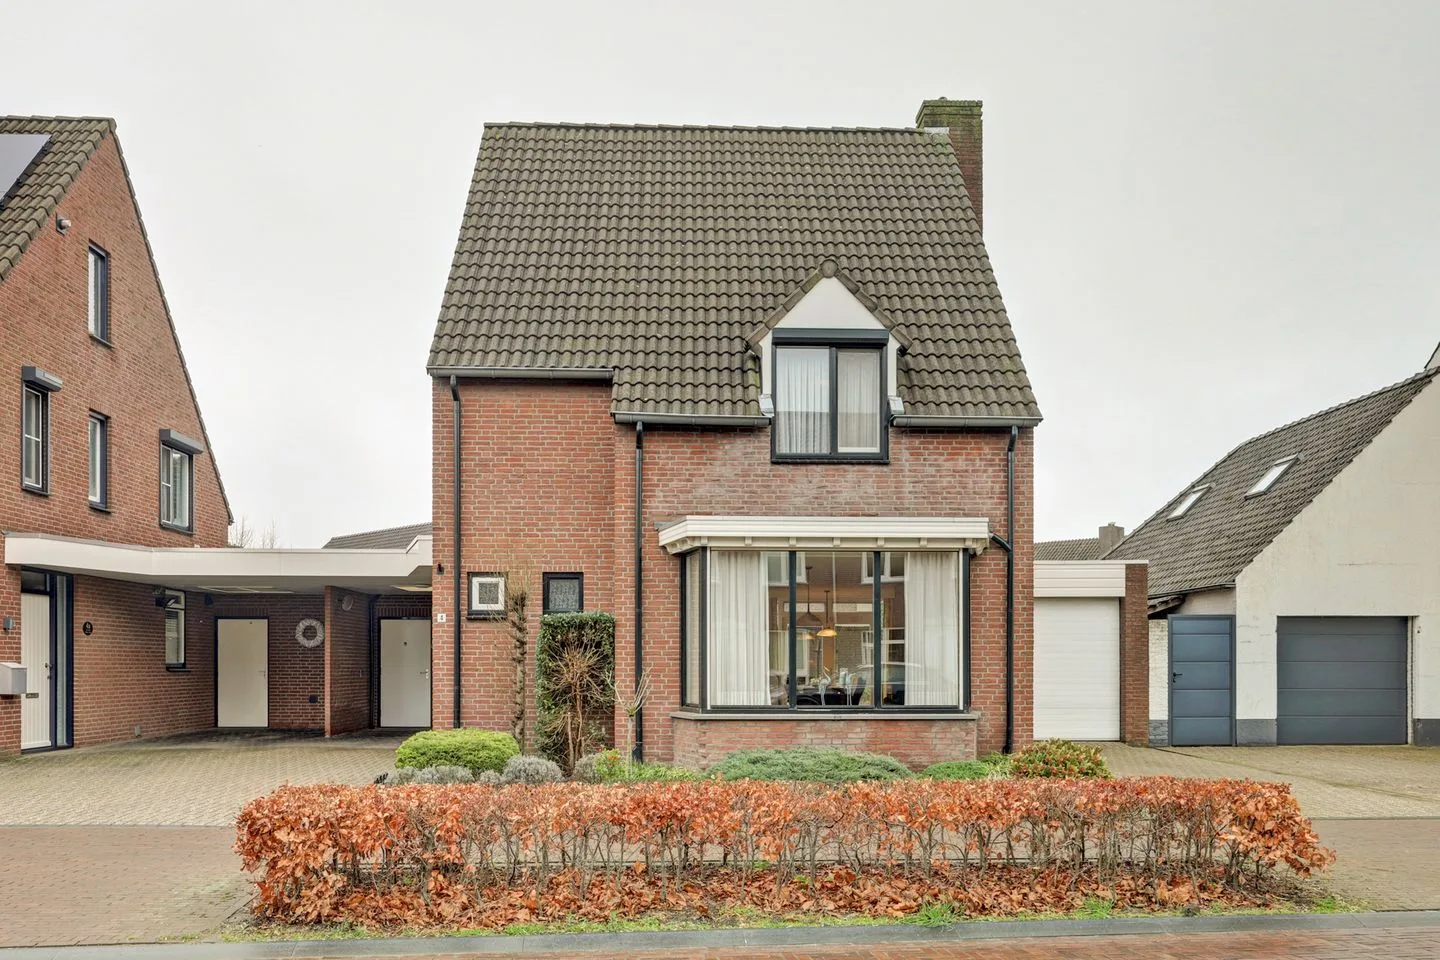
- Sold
Dorpsstraat 4
5758AR Neerkant
€ 429.000 k.k.
€ 2.466/m²
- Living area
- 174 m²
- Land area
- 288 m²
- Bedrooms
- 4
View 11 sold houses in Neerkant
Type to search. Use arrow down and arrow up to navigate through results and press Enter to open.
Hidden search suggestions.
Compare sold homes in Neerkant or view the current offering in this location directly.
On this page you will find recently sold homes in Neerkant. Use this overview to better estimate selling prices, popular neighborhoods, and the local housing supply before you choose a real estate agent. Also view the current housing supply with 12 houses in Neerkant.
5758AR Neerkant
€ 429.000 k.k.
€ 2.466/m²
5758AK Neerkant
€ 398.000 k.k.
€ 3.553/m²
5758AE Neerkant
€ 449.000 k.k.
€ 3.870/m²
5758CA Neerkant
Price upon request
5758BK Neerkant
€ 435.000 k.k.
€ 3.129/m²
5758CC Neerkant
€ 489.000 k.k.
€ 3.114/m²
5758PV Neerkant
€ 629.000 k.k.
€ 4.368/m²
5758CA Neerkant
€ 349.004 k.k.
€ 2.982/m²
5758AD Neerkant
€ 649.000 k.k.
€ 2.977/m²
5758CE Neerkant
€ 390.000 k.k.
€ 3.120/m²
5758PS Neerkant
€ 639.000 k.k.
€ 3.057/m²
View recent sales and receive free quotes from local real estate agents. Compare more than 17 real estate agents in Neerkant.
Selling your own home in Neerkant? Compare real estate agents in Neerkant or view the best real estate agents in Neerkant as a reference for your choice.
Real estate agents make sharper offers when they know you're comparing — ask for quotes for sale or purchase.
Short answers about housing prices, sold homes and comparing real estate agents in Neerkant.
The costs of a real estate agent in Neerkant vary per office, property type and sales approach. In Neerkant you can compare 17 real estate agents; therefore also look at the real estate agents in Neerkant to better compare fees, presentation and local experience.
On this page we currently show 11 sold houses in Neerkant from our selection. This helps you to better assess recent transactions and the local housing market.
Houses sold in Neerkant give insight into asking prices, house types and neighborhoods where recent transactions have taken place. Compare this also with the current housing stock in Neerkant to better understand the market.
You can use sold homes as a first market indication, but a local real estate agent can better take into account finishing, location, maintenance and current demand in Neerkant.
Compare the 17 real estate agents in Neerkant on local sales experience, reviews, expected yield, commission and marketing approach. View real estate agents in Neerkant or the top 10 agents in Neerkant to quickly discover strong offices.
View current location data on residents, WOZ development, housing stock, energy consumption, business activity and safety in Neerkant. In 2025 were there 1.850 residents. The average WOZ value in 2025 is EUR 421.000.
These figures help to better assess and compare the housing stock in Neerkant with recent sold homes. Orient yourself then on suitable top real estate agents in Neerkant for sales advice in this region.
Residents
1.850
Last year: 2025
Average WOZ
EUR 421.000
Last year: 2025
Average income per person.
EUR 31.500
Source: AllNumbers
Crimes (current year)
30
Total registered
| Year | Residents |
|---|---|
| 2021 | 1.900 |
| 2022 | 1.900 |
| 2023 | 1.890 |
| 2024 | 1.865 |
| 2025 | 1.850 |
| Year | Average WOZ |
|---|---|
| 2021 | EUR 294.000 |
| 2022 | EUR 334.000 |
| 2023 | EUR 388.000 |
| 2024 | EUR 402.000 |
| 2025 | EUR 421.000 |
Hoger
310
Praktisch
470
Middelbaar
640
Europa
100
Nederland
1.700
Buiten Europa
45
Label C
182
Label A
135
Label B
131
Label F
113
Label D
82
Label G
48
Label E
26
Label A+
8
Label A+++
4
Label A++
3
Label A++++
1
Label A+++++
0
| Year | Gas (m3) | Electricity (kWh) |
|---|---|---|
| 2020 | 1.620 | 3.820 |
| 2021 | 1.810 | 3.880 |
| 2022 | 1.400 | 3.620 |
| 2023 | 1.140 | 3.440 |
| 2024 | 1.120 | 3.540 |
Hoekwoning
Gas: 920 • Electricity: 2.200
Huurwoning
Gas: 920 • Electricity: 2.370
Koopwoning
Gas: 1.200 • Electricity: 3.740
Appartement
Gas: 900 • Electricity: 2.520
Tussenwoning
Gas: 800 • Electricity: 2.250
Vrijstaande woning
Gas: 1.360 • Electricity: 4.170
Twee-onder-één-kap woning
Gas: 980 • Electricity: 3.100
Total number of company establishments: 280
| Period | Crimes |
|---|---|
| jan 2025 | 0 |
| jan 2026 | 1 |
| jul 2025 | 2 |
| jun 2025 | 4 |
| mei 2025 | 2 |
| mrt 2025 | 1 |
| nov 2024 | 1 |
| nov 2025 | 7 |
| okt 2024 | 2 |
| okt 2025 | 0 |
| sep 2024 | 3 |
| sep 2025 | 5 |
These figures give an indicative picture of safety trends in the living environment of Neerkant.
Short answers based on current local statistics, handy for a quick comparison of the living environment.
Neerkant telt in 2025 ongeveer 1.850 inwoners.
De gemiddelde WOZ-waarde in Neerkant is in 2025 circa € 421.000.
Het gemiddelde inkomen per inwoner in Neerkant ligt rond € 31.500 per jaar.
Voor het huidige jaar gaat het om ongeveer 30 geregistreerde misdrijven. Gebruik deze cijfers als indicatie en vergelijk trends per periode.
In Neerkant komt vooral "Vrijstaande woningen" veel voor, met ongeveer 407 woningen.