
Residents
1.050
Last year: 2025
€ 385.000 k.k.
Cost of copper (estimated): € 9.550
2% transfer tax (€ 7.700) + notary (€ 1.150) + valuation (€ 700)
Total incl. VAT: € 394.550
Purchase price /m²: € 3.701
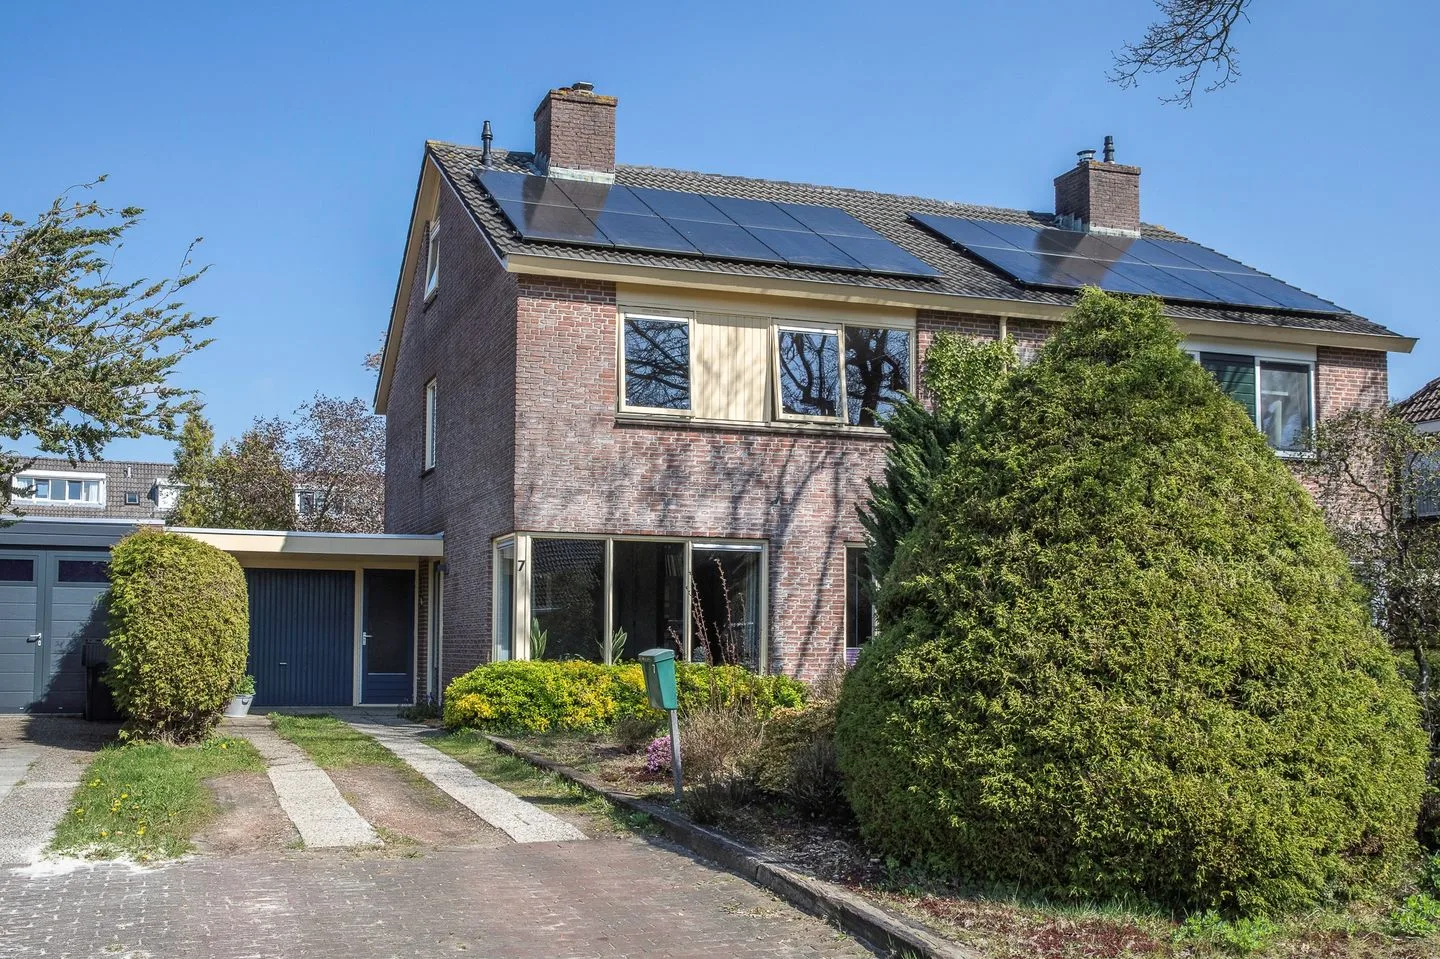
Verrassend ruime tussenwoning in het centrum van het gezellige dorp Nietap. De woning is uitstekend geïsoleerd, voorzien van zonnepanelen, vloerverwarming wat lage maandelijkse kosten geeft. Het centrum is op loopafstand, binnen een paar autominuten naar Roden of naar de A7 richting Groningen en Drachten. De woning is uitstekend onderhouden, onderhoudsarm, voorzien van kunststof kozijnen en HR ++ Glas. Indeling Entree, hal, toilet, trapopgang, woonkamer, open moderne keuken met inbouwapparatuur. Eerste verdieping Overloop, drie slaapkamers, badkamer met douche, wastafel meubel en tweede toilet. Tweede verdieping Via vaste trap naar ruime zolder met wasmachine aansluiting en daglicht via een kantelraam. Tuin Onderhoudsarme tuin volledig bestraat, gelegen op het zuiden. Bijzonderheden Vrijstaande berging. In het centrum van Nietap. Uitstekend onderhouden. Lage energielasten. Vloerverwarming. Waterontharder 12 Zonnepanelen. Voorzien van airco. Lees de volledige omschrijving
€ 385.000
Cost of copper (estimated): € 9.550
2% transfer tax (€ 7.700) + notary (€ 1.150) + valuation (€ 700)
Total purchase (incl. p.p.): € 394.550
2,78%
Yearly
€ 19.250
Direct available
Estimated mortgage
Indicative gross monthly cost
Based on annuity and 30 year term
Indicative net monthly cost
iDisclaimer: this mortgage calculation is a simplified indication based on general assumptions. No rights can be derived from the results shown. Calculated with 10-annual interest (met NHG), automatically determined based on the price limit € 470.000. Source: 10-jaars rente uit mortgage_rates (08-05-2026 03:45).
Douche, toilet, en wastafelmeubel
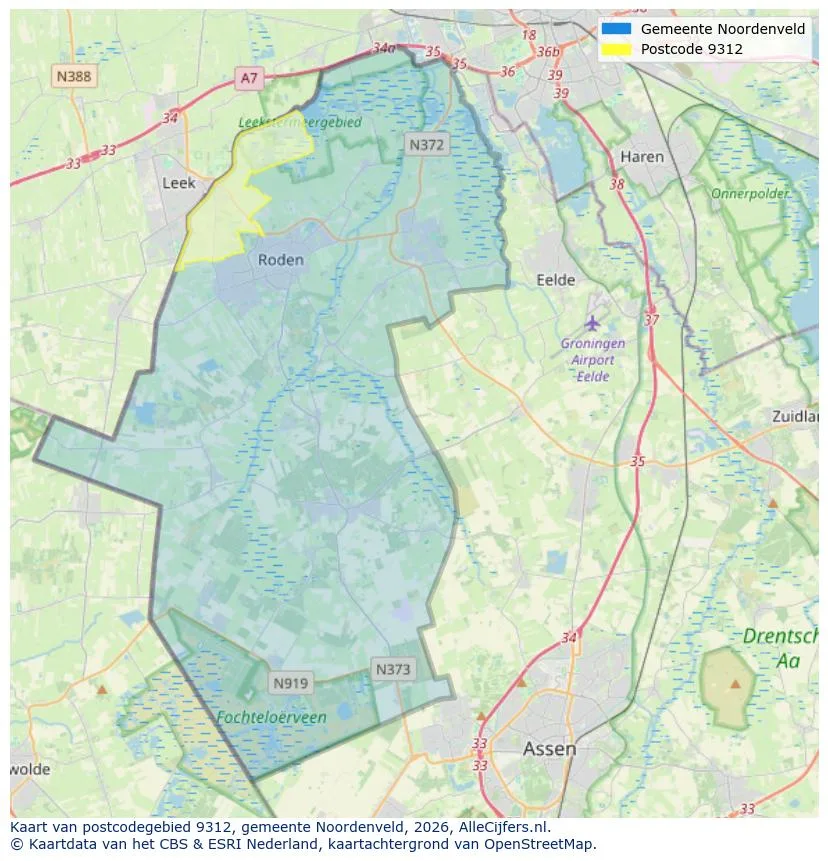
Explore Nietap and the surrounding areas
View current location data on residents, WOZ development, housing stock, energy consumption, business activity and safety in Nietap. In 2025 were there 1.050 residents. The average WOZ value in 2025 is EUR 454.789.
Residents
1.050
Last year: 2025
Average WOZ
EUR 454.789
Last year: 2025
Average income per person.
EUR 34.401
Source: AllNumbers
Crimes (current year)
15
Total registered
| Year | Residents |
|---|---|
| 2021 | 1.064 |
| 2022 | 1.040 |
| 2023 | 1.053 |
| 2024 | 1.032 |
| 2025 | 1.050 |
| Year | Average WOZ |
|---|---|
| 2021 | EUR 318.189 |
| 2022 | EUR 351.563 |
| 2023 | EUR 399.621 |
| 2024 | EUR 426.653 |
| 2025 | EUR 454.789 |
Hoger
234
Praktisch
149
Middelbaar
322
Europa
37
Nederland
990
Buiten Europa
33
Label C
114
Label A
94
Label G
79
Label B
76
Label D
55
Label F
44
Label E
20
Label A++
7
Label A+++
1
Label A++++
1
Label A+
0
Label A+++++
0
| Year | Gas (m3) | Electricity (kWh) |
|---|---|---|
| 2020 | 1.689 | 2.957 |
| 2021 | 1.886 | 2.964 |
| 2022 | 1.468 | 2.712 |
| 2023 | 1.214 | 2.623 |
| 2024 | 1.179 | 2.700 |
Hoekwoning
Gas: 1.014 • Electricity: 1.692
Huurwoning
Gas: 993 • Electricity: 1.921
Koopwoning
Gas: 1.247 • Electricity: 2.751
Appartement
Gas: 620 • Electricity: 1.550
Tussenwoning
Gas: 804 • Electricity: 1.575
Vrijstaande woning
Gas: 1.424 • Electricity: 3.154
Twee-onder-één-kap woning
Gas: 863 • Electricity: 1.851
Total number of company establishments: 112
| Period | Crimes |
|---|---|
| jan 2025 | 0 |
| jan 2026 | 1 |
| jul 2025 | 0 |
| jun 2025 | 2 |
| mei 2025 | 4 |
| mrt 2025 | 1 |
| nov 2024 | 1 |
| nov 2025 | 0 |
| okt 2024 | 1 |
| okt 2025 | 0 |
| sep 2024 | 0 |
| sep 2025 | 0 |
These figures give an indicative picture of safety trends in the living environment of Nietap.
Short answers based on current local statistics, handy for a quick comparison of the living environment.
Nietap telt in 2025 ongeveer 1.050 inwoners.
De gemiddelde WOZ-waarde in Nietap is in 2025 circa € 454.789.
Het gemiddelde inkomen per inwoner in Nietap ligt rond € 34.401 per jaar.
Voor het huidige jaar gaat het om ongeveer 15 geregistreerde misdrijven. Gebruik deze cijfers als indicatie en vergelijk trends per periode.
In Nietap komt vooral "Vrijstaande woningen" veel voor, met ongeveer 245 woningen.
View more homes in this location.

9312PD Nietap
€ 549.000 k.k.
€ 4.289/m²
9312PZ Nietap
€ 475.000 k.k.
€ 3.345/m²
9312PG Nietap
€ 349.000 k.k.
€ 3.455/m²

9312PC Nietap
€ 470.000 k.k.
€ 3.176/m²

9312PM Nietap
€ 285.000 k.k.
€ 2.850/m²

9312VG Nietap
€ 875.000 k.k.
€ 4.781/m²

9312PX Nietap
€ 535.000 k.k.
€ 3.496/m²

9312VG Nietap
€ 895.000 k.k.
€ 6.832/m²
