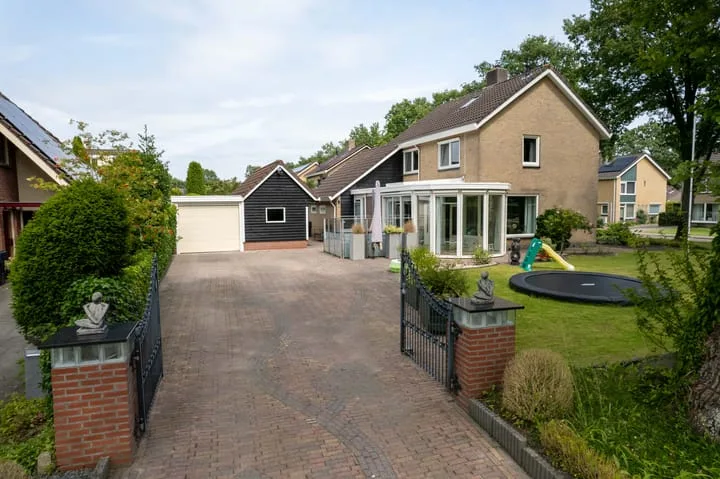
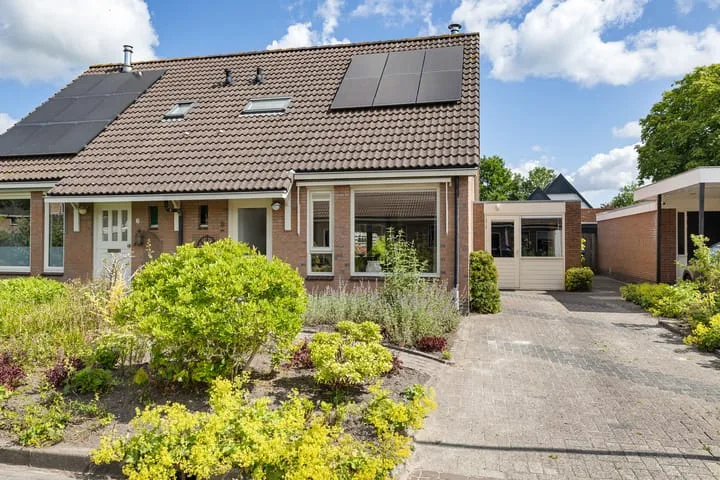
Houses sold in Nietap

View 10 sold houses in Nietap

Connected to: Vastgoed Nederland NVM Makelaars

On this page you will find recently sold homes in Nietap. Use this overview to better estimate selling prices, popular neighborhoods, and the local housing supply before you choose a real estate agent. Also view the current housing supply with 15 houses in Nietap.

Selection

Search and filter homes

Set your preferences and discover homes that suit you.

Total supply 241.443
Filters

Set price, area and other characteristics. Adjust a filter or click on Show homes. Location changes directly above.

Reset filters

You search for

  • Place Nietap
  • Status Sold

Huis verkopen in Nietap? Vergelijk verkoopmakelaars

Bekijk recente verkopen en ontvang gratis offertes van lokale verkoopmakelaars in Nietap.

Free request a quote

  • Quotes in Nietap
  • Non-binding
  • Personal
  • Gratis tarieven vergelijken

Zelf je woning verkopen in Nietap? Vergelijk verkoopmakelaars in Nietap of bekijk de beste verkoopmakelaars in Nietap als referentie bij jouw keuze.

Vergelijk meerdere offertes

Makelaars maken scherpere voorstellen als ze weten dat je vergelijkt — vraag offertes aan voor verkoop of aankoop.

Frequently asked questions about sold homes in Nietap

Short answers about housing prices, sold homes and comparing real estate agents in Nietap.

Residential and neighborhood statistics in Nietap

View current location data on residents, WOZ development, housing stock, energy consumption, business activity and safety in Nietap. In 2025 were there 1.050 residents. The average WOZ value in 2025 is EUR 454.789.

These figures help to better assess and compare the housing stock in Nietap with recent sold homes. Orient yourself then on suitable top real estate agents in Nietap for sales advice in this region.

Residents

1.050

Last year: 2025

Average WOZ

EUR 454.789

Last year: 2025

Average income per person.

EUR 34.401

Source: AllNumbers

Crimes (current year)

15

Total registered

Demographics and WOZ development

Inhabitants per year

Inhabitants per year in Nietap
Year Residents
2021 1.064
2022 1.040
2023 1.053
2024 1.032
2025 1.050

Annual WOZ value

WOZ value per year in Nietap
Year Average WOZ
2021 EUR 318.189
2022 EUR 351.563
2023 EUR 399.621
2024 EUR 426.653
2025 EUR 454.789

Composition of residents

Age build-up

65+: 335 0-15: 131 15-25: 90 25-45: 192 45-65: 297

Education level

Hoger

234

Praktisch

149

Middelbaar

322

Origin of residents (2025)

Europa

37

Nederland

990

Buiten Europa

33

Housing stock and construction periods

Types of homes

Hoekwoningen 63
Appartementen 41
Tussenwoningen 88
Vrijstaande woningen 245
Twee-onder-één-kap woningen 96

Construction period of buildings

Voor 1700 0
1700 tot 1900 22
1900 tot 1925 46
1925 tot 1950 74
1950 tot 1970 119
1970 tot 1980 75
1980 tot 1990 81
1990 tot 2000 23
2000 tot 2010 15
2010 tot 2020 17
2020 en later 49

Energy and sustainability

Energy label distribution

Label C

114

Label A

94

Label G

79

Label B

76

Label D

55

Label F

44

Label E

20

Label A++

7

Label A+++

1

Label A++++

1

Label A+

0

Label A+++++

0

Average energy consumption per year

Average energy consumption per year in Nietap
Year Gas (m3) Electricity (kWh)
2020 1.689 2.957
2021 1.886 2.964
2022 1.468 2.712
2023 1.214 2.623
2024 1.179 2.700

Consumption per house type

Hoekwoning

Gas: 1.014 • Electricity: 1.692

Huurwoning

Gas: 993 • Electricity: 1.921

Koopwoning

Gas: 1.247 • Electricity: 2.751

Appartement

Gas: 620 • Electricity: 1.550

Tussenwoning

Gas: 804 • Electricity: 1.575

Vrijstaande woning

Gas: 1.424 • Electricity: 3.154

Twee-onder-één-kap woning

Gas: 863 • Electricity: 1.851

Business activity in Nietap (2025)

Handel en HORECA 23
Nijverheid en energie 20
Zakelijke dienstverlening 21
Overheid, onderwijs en zorg 13
Landbouw, bosbouw en visserij 5
Vervoer, informatie en communicatie 8
Financiele diensten en onroerendgoed 13
Cultuur, recreatie en overige diensten 8

Total number of company establishments: 112

Recent crime statistics

Recent crime statistics in Nietap
Period Crimes
jan 2025 0
jan 2026 1
jul 2025 0
jun 2025 2
mei 2025 4
mrt 2025 1
nov 2024 1
nov 2025 0
okt 2024 1
okt 2025 0
sep 2024 0
sep 2025 0

These figures give an indicative picture of safety trends in the living environment of Nietap.

Frequently asked questions about living in Nietap

Short answers based on current local statistics, handy for a quick comparison of the living environment.

Hoeveel inwoners heeft Nietap?

Nietap telt in 2025 ongeveer 1.050 inwoners.

Wat is de gemiddelde WOZ-waarde in Nietap?

De gemiddelde WOZ-waarde in Nietap is in 2025 circa € 454.789.

Wat is het gemiddelde inkomen per inwoner in Nietap?

Het gemiddelde inkomen per inwoner in Nietap ligt rond € 34.401 per jaar.

Hoe veilig is wonen in Nietap?

Voor het huidige jaar gaat het om ongeveer 15 geregistreerde misdrijven. Gebruik deze cijfers als indicatie en vergelijk trends per periode.

Welke woningtypen komen het meest voor in Nietap?

In Nietap komt vooral "Vrijstaande woningen" veel voor, met ongeveer 245 woningen.

Gratis vrijblijvende offertes ontvangen

Vergelijk meerdere makelaars en kies de beste match.