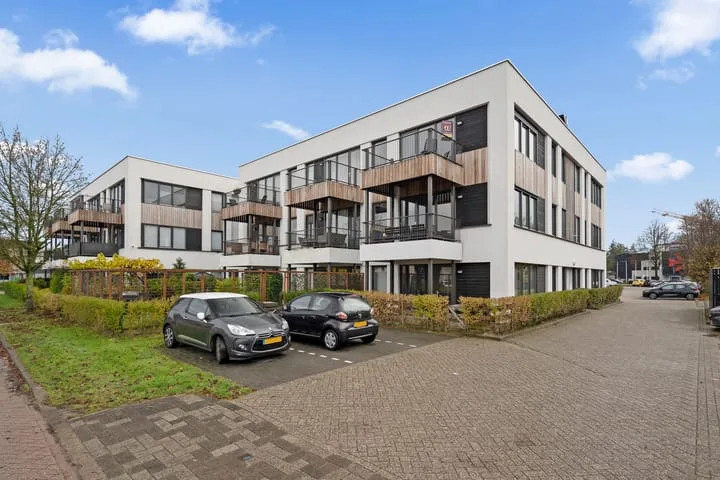
- Sold
Snekerveste 27
3432RB Nieuwegein
€ 625.000 k.k.
€ 4.960/m²
- Living area
- 126 m²
- Land area
- 228 m²
- Bedrooms
- 4
View 785 sold houses in Nieuwegein
Type to search. Use arrow down and arrow up to navigate through results and press Enter to open.
Hidden search suggestions.
Compare sold homes in Nieuwegein or view the current offering in this location directly.
On this page you will find recently sold homes in Nieuwegein. Use this overview to better estimate selling prices, popular neighborhoods, and the local housing supply before you choose a real estate agent. Also view the current housing supply with 1.004 houses in Nieuwegein.
3432RB Nieuwegein
€ 625.000 k.k.
€ 4.960/m²
3432CR Nieuwegein
€ 495.000 k.k.
€ 3.535/m²
3438LE Nieuwegein
€ 340.000 k.k.
€ 5.964/m²
3436CZ Nieuwegein
€ 425.000 k.k.
€ 3.571/m²
3438JM Nieuwegein
€ 445.000 k.k.
€ 4.734/m²
3431EZ Nieuwegein
€ 385.000 k.k.
€ 5.000/m²
3432TW Nieuwegein
€ 450.000 k.k.
€ 4.326/m²
3434KR Nieuwegein
€ 350.000 k.k.
€ 4.487/m²
3438JD Nieuwegein
€ 500.000 k.k.
€ 4.201/m²
3434KZ Nieuwegein
€ 325.000 k.k.
€ 5.078/m²
3438LM Nieuwegein
€ 375.000 k.k.
€ 5.208/m²
3433AL Nieuwegein
€ 445.000 k.k.
€ 6.013/m²
3431XN Nieuwegein
€ 310.000 k.k.
€ 4.025/m²
3433DE Nieuwegein
€ 489.000 k.k.
€ 3.649/m²
3438MV Nieuwegein
€ 785.000 k.k.
€ 5.164/m²
3431GW Nieuwegein
€ 599.000 k.k.
€ 3.720/m²
3438MC Nieuwegein
€ 1.295.000 k.k.
€ 6.607/m²
3436HB Nieuwegein
€ 510.000 k.k.
€ 4.322/m²
3439ML Nieuwegein
€ 285.000 k.k.
€ 5.089/m²
3432CC Nieuwegein
€ 450.000 k.k.
€ 4.054/m²
3439RD Nieuwegein
€ 995.000
€ 5.993/m²
3435GP Nieuwegein
€ 475.000 k.k.
€ 3.682/m²
3439WB Nieuwegein
€ 369.000 k.k.
€ 4.855/m²
3436HD Nieuwegein
€ 545.000 k.k.
€ 2.978/m²
3435RZ Nieuwegein
€ 300.000 k.k.
€ 4.545/m²
3431GV Nieuwegein
€ 599.000 k.k.
€ 3.327/m²
3437RN Nieuwegein
€ 375.000 k.k.
€ 3.676/m²
3438RJ Nieuwegein
€ 400.000 k.k.
€ 3.960/m²
View recent sales and receive free quotes from local real estate agents. Compare more than 182 real estate agents in Nieuwegein.
Sold recently in Nieuwegein? Read the sales-oriented guide sell your home in Nieuwegein, compare sales agents in Nieuwegein or view the top sales agents in Nieuwegein for reference in your choice.
Real estate agents make sharper offers when they know you're comparing — ask for quotes for sale or purchase.
Short answers about housing prices, sold homes and comparing real estate agents in Nieuwegein.
The costs of a real estate agent in Nieuwegein vary per office, property type and sales approach. In Nieuwegein you can compare 182 real estate agents; therefore also look at the real estate agents in Nieuwegein to better compare fees, presentation and local experience.
On this page we currently show 785 sold houses in Nieuwegein from our selection. This helps you to better assess recent transactions and the local housing market.
Houses sold in Nieuwegein give insight into asking prices, house types and neighborhoods where recent transactions have taken place. Compare this also with the current housing stock in Nieuwegein to better understand the market.
You can use sold homes as a first market indication, but a local real estate agent can better take into account finishing, location, maintenance and current demand in Nieuwegein. Plan the next step via the guide selling a house in Nieuwegein.
Compare the 182 real estate agents in Nieuwegein on local sales experience, reviews, expected yield, commission and marketing approach. View real estate agents in Nieuwegein or the top 10 agents in Nieuwegein to quickly discover strong offices.
View current location data on residents, WOZ development, housing stock, energy consumption, business activity and safety in Nieuwegein. In 2026 were there 68.299 residents. The average WOZ value in 2025 is EUR 386.000.
These figures help to better assess and compare the housing stock in Nieuwegein with recent sold homes. Orient yourself then on suitable top real estate agents in Nieuwegein for sales advice in this region.
Residents
68.299
Last year: 2026
Average WOZ
EUR 386.000
Last year: 2025
Average income per person.
EUR 34.700
Source: AllNumbers
Crimes (current year)
3.759
Total registered
| Year | Residents |
|---|---|
| 2022 | 64.554 |
| 2023 | 65.426 |
| 2024 | 65.971 |
| 2025 | 66.788 |
| 2026 | 68.299 |
| Year | Average WOZ |
|---|---|
| 2021 | EUR 269.000 |
| 2022 | EUR 292.000 |
| 2023 | EUR 349.000 |
| 2024 | EUR 352.000 |
| 2025 | EUR 386.000 |
Hoger
32
Praktisch
26
Middelbaar
42
Europa
5.161
Nederland
44.049
Buiten Europa
17.578
Label C
12.189
Label A
7.575
Label B
5.217
Label D
2.936
Label A+++
1.724
Label A+
1.603
Label E
734
Label A++
678
Label G
403
Label F
357
Label A++++
186
Label A+++++
12
| Year | Gas (m3) | Electricity (kWh) |
|---|---|---|
| 2020 | 510 | 2.790 |
| 2021 | 580 | 2.830 |
| 2022 | 440 | 2.620 |
| 2023 | 380 | 2.420 |
| 2024 | 370 | 2.440 |
Hoekwoning
Gas: 610 • Electricity: 2.810
Huurwoning
Gas: 280 • Electricity: 2.050
Koopwoning
Gas: 450 • Electricity: 2.690
Appartement
Gas: 170 • Electricity: 1.930
Tussenwoning
Gas: 450 • Electricity: 2.650
Vrijstaande woning
Gas: 920 • Electricity: 4.060
Twee-onder-één-kap woning
Gas: 950 • Electricity: 3.300
Total number of company establishments: 8.500
| Period | Crimes |
|---|---|
| jan 2025 | 304 |
| jan 2026 | 290 |
| jul 2025 | 363 |
| jun 2025 | 303 |
| mei 2025 | 355 |
| mrt 2025 | 368 |
| nov 2024 | 339 |
| nov 2025 | 274 |
| okt 2024 | 336 |
| okt 2025 | 296 |
| sep 2024 | 290 |
| sep 2025 | 302 |
These figures give an indicative picture of safety trends in the living environment of Nieuwegein.
Short answers based on current local statistics, handy for a quick comparison of the living environment.
Nieuwegein telt in 2026 ongeveer 68.299 inwoners.
De gemiddelde WOZ-waarde in Nieuwegein is in 2025 circa € 386.000.
Het gemiddelde inkomen per inwoner in Nieuwegein ligt rond € 34.700 per jaar.
Voor het huidige jaar gaat het om ongeveer 3.759 geregistreerde misdrijven. Gebruik deze cijfers als indicatie en vergelijk trends per periode.
In Nieuwegein komt vooral "Appartementen" veel voor, met ongeveer 15.005 woningen.