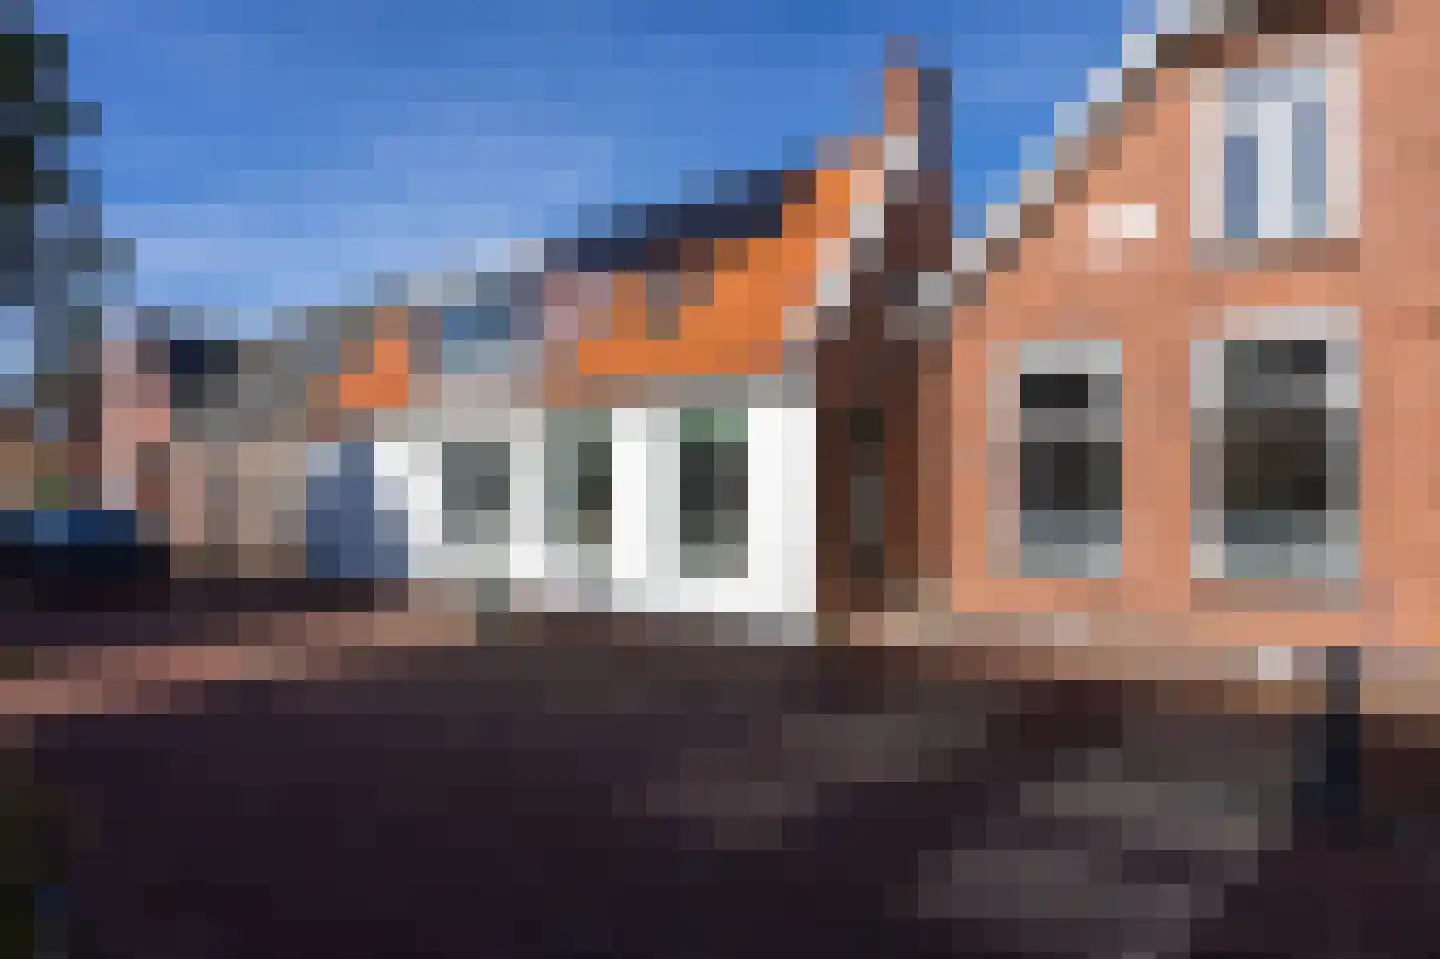
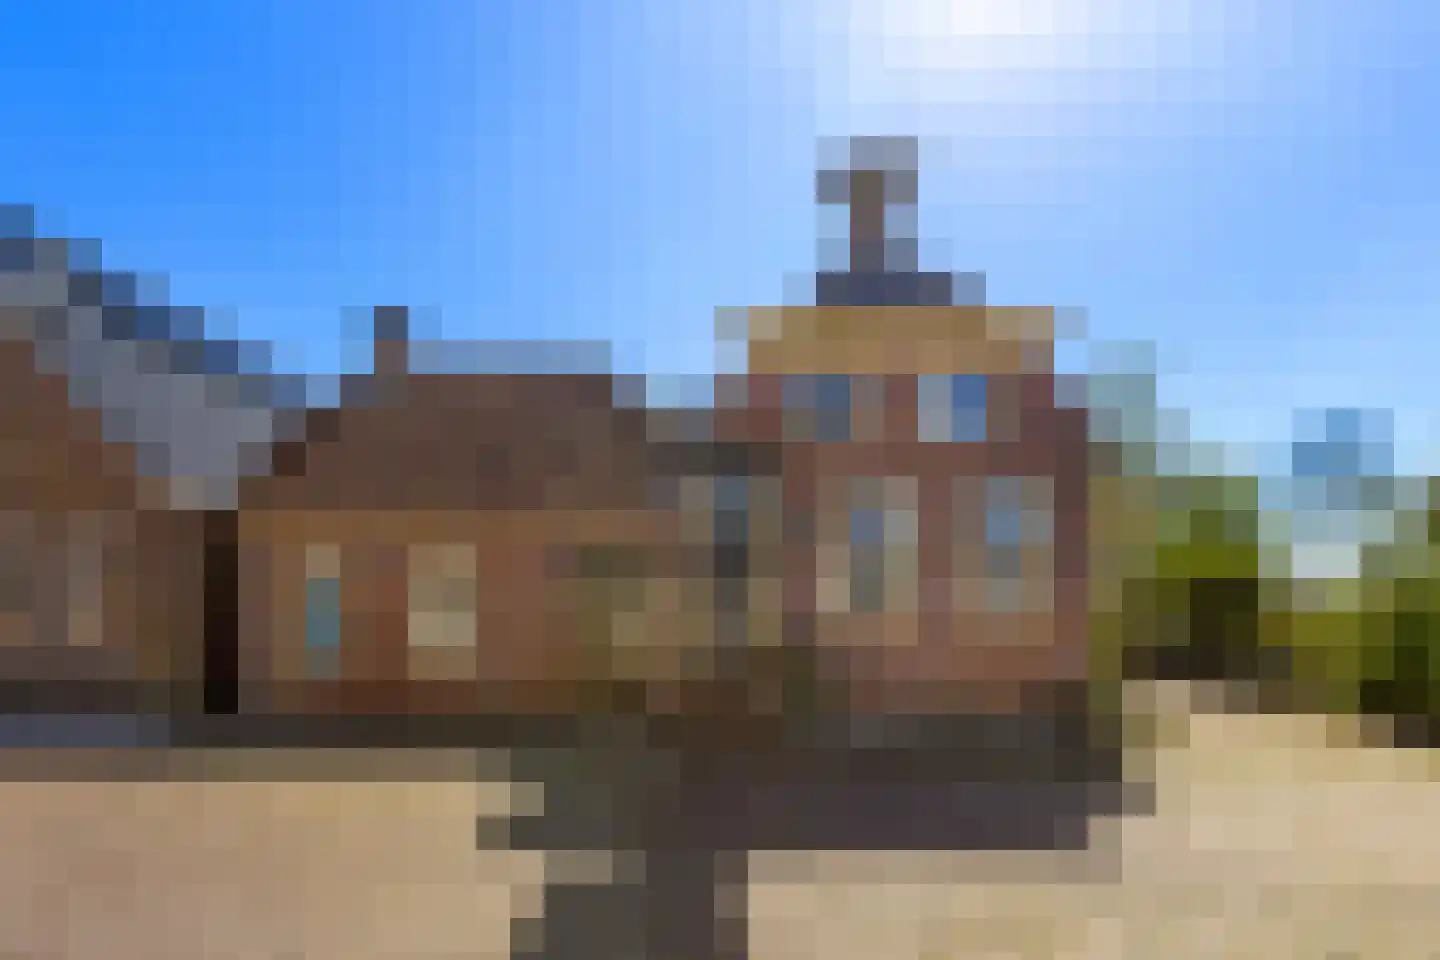
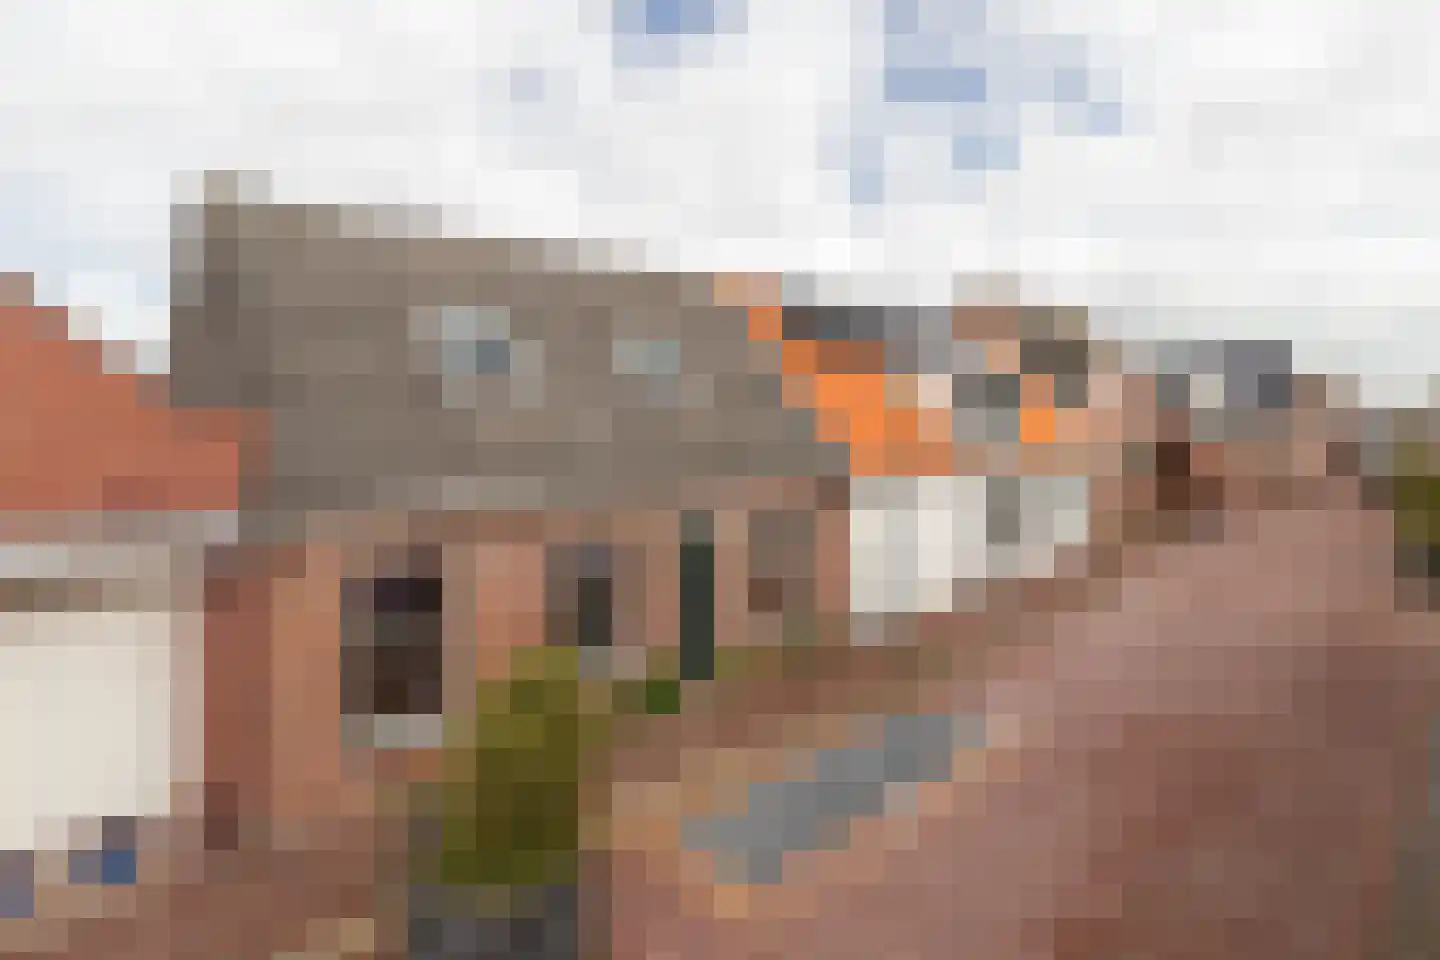
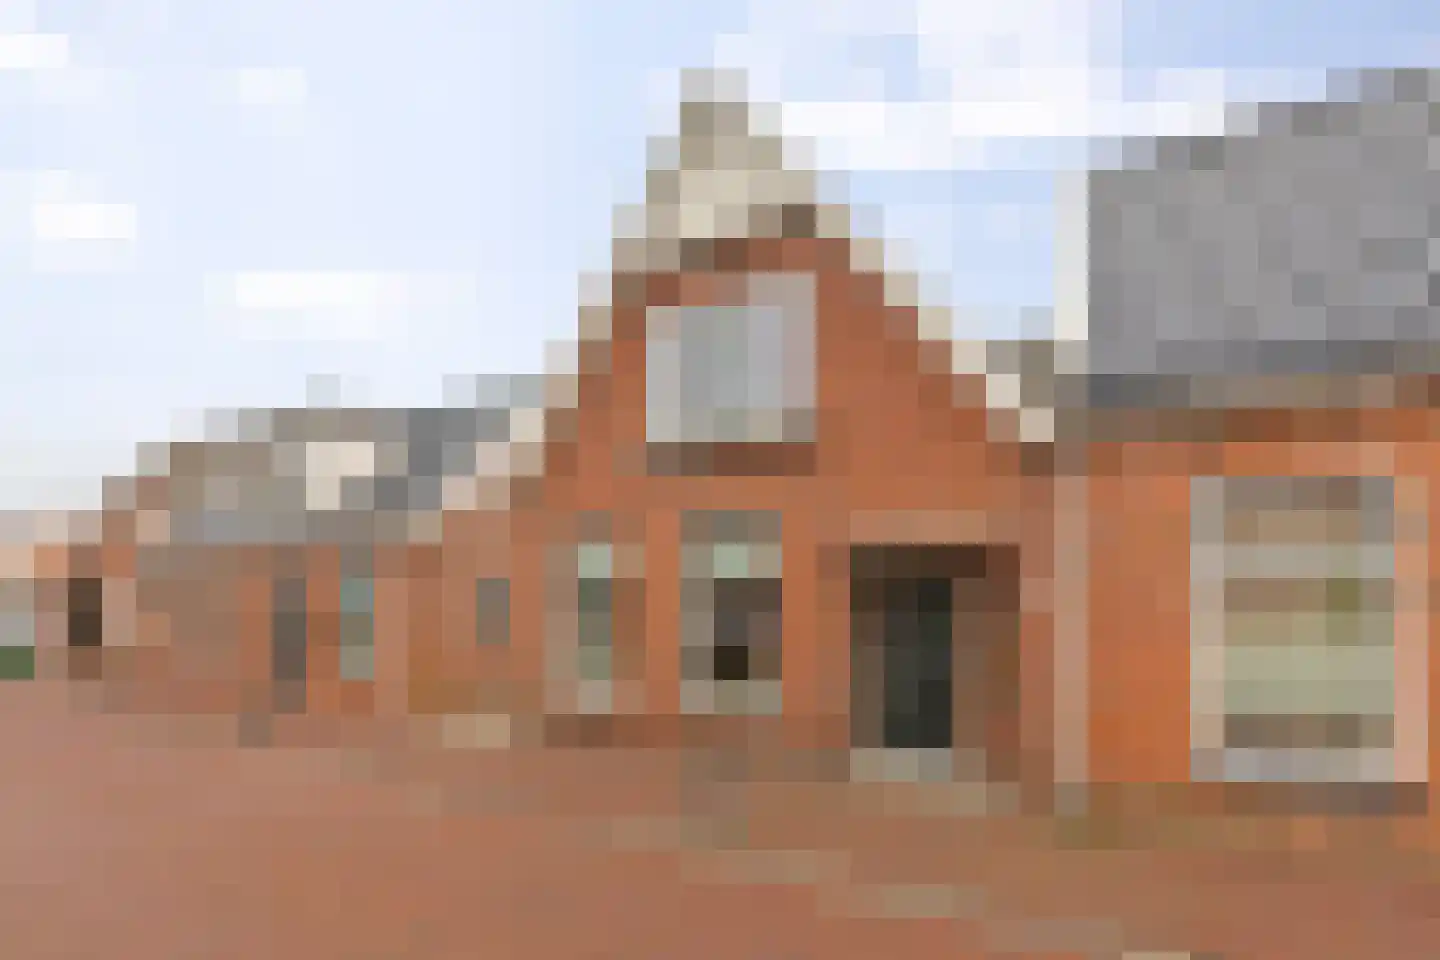
Housing offer in Niezijl

Searching in 12 houses in Niezijl

Connected to: Vastgoed Nederland NVM Makelaars

View the current housing stock in Niezijl and quickly filter by price, living area, rooms and more. There are currently 12 houses in this place within our selection. View also 6 sold houses in Niezijl for extra insight into the local housing market.

Selection

Search and filter homes

Set your preferences and discover homes that suit you.

Total supply 244.754
Filters

Set price, area and other characteristics. Adjust a filter or click on Show homes. Location changes directly above.

Reset filters

You search for

  • Place Niezijl

Selling a home in Niezijl? Compare realtor offers

Get free quotes from real estate agents with local market knowledge. Compare more than 18 real estate agents in Niezijl.

Free request a quote

  • Quotes in Niezijl
  • Non-binding
  • Personal
  • Compare free rates

Selling a home in Niezijl? Compare all real estate agents in Niezijl or view the top 10 real estate agents in Niezijl for extra context for your choice.

Compare multiple quotes

Real estate agents make sharper offers when they know you're comparing — ask for quotes for sale or purchase.

Frequently asked questions about homes in Niezijl

Practical answers about housing supply, sales and comparing real estate agents in Niezijl.

Residential and neighborhood statistics in Niezijl

View current location data on residents, WOZ development, housing stock, energy consumption, business activity and safety in Niezijl. In 2025 were there 466 residents. The average WOZ value in 2025 is EUR 246.259.

These figures help to better assess and compare the housing stock in Niezijl with recent sold homes. Orient yourself then on suitable top real estate agents in Niezijl for sales advice in this region.

Residents

466

Last year: 2025

Average WOZ

EUR 246.259

Last year: 2025

Average income per person.

EUR 29.217

Source: AllNumbers

Crimes (current year)

3

Total registered

Demographics and WOZ development

Inhabitants per year

Inhabitants per year in Niezijl
Year Residents
2021 458
2022 458
2023 472
2024 476
2025 466

Annual WOZ value

WOZ value per year in Niezijl
Year Average WOZ
2021 EUR 178.710
2022 EUR 193.716
2023 EUR 219.679
2024 EUR 221.593
2025 EUR 246.259

Composition of residents

Age build-up

65+: 87 0-15: 82 15-25: 55 25-45: 117 45-65: 131

Education level

Hoger

87

Praktisch

50

Middelbaar

182

Origin of residents (2025)

Europa

16

Nederland

415

Buiten Europa

35

Housing stock and construction periods

Types of homes

Hoekwoningen 38
Appartementen 3
Tussenwoningen 32
Vrijstaande woningen 94
Twee-onder-één-kap woningen 50

Construction period of buildings

Voor 1700 3
1700 tot 1900 47
1900 tot 1925 28
1925 tot 1950 14
1950 tot 1970 48
1970 tot 1980 20
1980 tot 1990 12
1990 tot 2000 42
2000 tot 2010 5
2010 tot 2020 2
2020 en later 1

Energy and sustainability

Energy label distribution

Label G

52

Label B

41

Label C

41

Label D

33

Label F

16

Label A

14

Label E

13

Label A+

0

Label A++

0

Label A+++

0

Label A++++

0

Label A+++++

0

Average energy consumption per year

Average energy consumption per year in Niezijl
Year Gas (m3) Electricity (kWh)
2020 1.572 2.702
2021 1.852 2.755
2022 1.425 2.499
2023 1.196 2.425
2024 1.162 2.500

Consumption per house type

Hoekwoning

Gas: 1.084 • Electricity: 2.094

Huurwoning

Gas: 988 • Electricity: 1.685

Koopwoning

Gas: 1.241 • Electricity: 2.568

Appartement

Gas: 51 • Electricity: 104

Tussenwoning

Gas: 897 • Electricity: 1.505

Vrijstaande woning

Gas: 1.319 • Electricity: 2.882

Twee-onder-één-kap woning

Gas: 1.143 • Electricity: 1.985

Business activity in Niezijl (2025)

Handel en HORECA 10
Nijverheid en energie 11
Zakelijke dienstverlening 5
Overheid, onderwijs en zorg 11
Landbouw, bosbouw en visserij 8
Vervoer, informatie en communicatie 5
Financiele diensten en onroerendgoed 5
Cultuur, recreatie en overige diensten 5

Total number of company establishments: 56

Recent crime statistics

Recent crime statistics in Niezijl
Period Crimes
jan 2025 1
jan 2026 1
jul 2025 0
jun 2025 0
mei 2025 1
mrt 2025 1
nov 2024 0
nov 2025 0
okt 2024 1
okt 2025 0
sep 2024 1
sep 2025 0

These figures give an indicative picture of safety trends in the living environment of Niezijl.

Frequently asked questions about living in Niezijl

Short answers based on current local statistics, handy for a quick comparison of the living environment.

Hoeveel inwoners heeft Niezijl?

Niezijl telt in 2025 ongeveer 466 inwoners.

Wat is de gemiddelde WOZ-waarde in Niezijl?

De gemiddelde WOZ-waarde in Niezijl is in 2025 circa € 246.259.

Wat is het gemiddelde inkomen per inwoner in Niezijl?

Het gemiddelde inkomen per inwoner in Niezijl ligt rond € 29.217 per jaar.

Hoe veilig is wonen in Niezijl?

Voor het huidige jaar gaat het om ongeveer 3 geregistreerde misdrijven. Gebruik deze cijfers als indicatie en vergelijk trends per periode.

Welke woningtypen komen het meest voor in Niezijl?

In Niezijl komt vooral "Vrijstaande woningen" veel voor, met ongeveer 94 woningen.

Receive free, non-binding quotes

Compare multiple real estate agents and choose the best match.