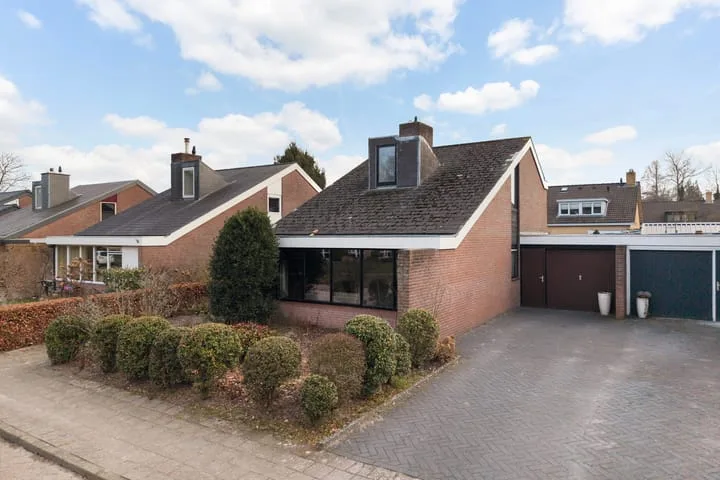
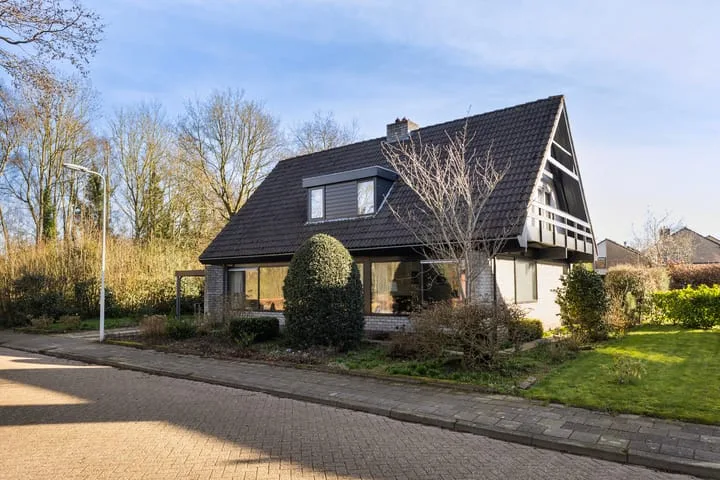
Houses sold in Oentsjerk

View 9 sold houses in Oentsjerk

Connected to: Vastgoed Nederland NVM Makelaars

On this page you will find recently sold homes in Oentsjerk. Use this overview to better estimate selling prices, popular neighborhoods, and the local housing supply before you choose a real estate agent. Also view the current housing supply with 13 houses in Oentsjerk.

Selection

Search and filter homes

Set your preferences and discover homes that suit you.

Total supply 242.874
Filters

Set price, area and other characteristics. Adjust a filter or click on Show homes. Location changes directly above.

Reset filters

You search for

  • Place Oentsjerk
  • Status Sold

Huis verkopen in Oentsjerk? Vergelijk verkoopmakelaars

Bekijk recente verkopen en ontvang gratis offertes van lokale makelaars. Vergelijk meer dan 46 makelaars in Oentsjerk.

Free request a quote

  • Quotes in Oentsjerk
  • Non-binding
  • Personal
  • Compare free rates

Zelf je woning verkopen in Oentsjerk? Vergelijk verkoopmakelaars in Oentsjerk of bekijk de beste verkoopmakelaars in Oentsjerk als referentie bij jouw keuze.

Vergelijk meerdere offertes

Makelaars maken scherpere voorstellen als ze weten dat je vergelijkt — vraag offertes aan voor verkoop of aankoop.

Frequently asked questions about sold homes in Oentsjerk

Short answers about housing prices, sold homes and comparing real estate agents in Oentsjerk.

Residential and neighborhood statistics in Oentsjerk

View current location data on residents, WOZ development, housing stock, energy consumption, business activity and safety in Oentsjerk. In 2025 were there 2.065 residents. The average WOZ value in 2025 is EUR 293.099.

These figures help to better assess and compare the housing stock in Oentsjerk with recent sold homes. Orient yourself then on suitable top real estate agents in Oentsjerk for sales advice in this region.

Residents

2.065

Last year: 2025

Average WOZ

EUR 293.099

Last year: 2025

Average income per person.

EUR 27.783

Source: AllNumbers

Crimes (current year)

33

Total registered

Demographics and WOZ development

Inhabitants per year

Inhabitants per year in Oentsjerk
Year Residents
2021 2.000
2022 2.035
2023 2.060
2024 2.060
2025 2.065

Annual WOZ value

WOZ value per year in Oentsjerk
Year Average WOZ
2021 EUR 197.981
2022 EUR 223.589
2023 EUR 252.091
2024 EUR 271.512
2025 EUR 293.099

Composition of residents

Age build-up

65+: 585 0-15: 290 15-25: 235 25-45: 465 45-65: 490

Education level

Hoger

440

Praktisch

290

Middelbaar

620

Origin of residents (2025)

Europa

55

Nederland

1.930

Buiten Europa

85

Housing stock and construction periods

Types of homes

Hoekwoningen 110
Appartementen 253
Tussenwoningen 158
Vrijstaande woningen 276
Twee-onder-één-kap woningen 178

Construction period of buildings

Voor 1700 1
1700 tot 1900 6
1900 tot 1925 34
1925 tot 1950 79
1950 tot 1970 102
1970 tot 1980 211
1980 tot 1990 144
1990 tot 2000 59
2000 tot 2010 69
2010 tot 2020 62
2020 en later 23

Energy and sustainability

Energy label distribution

Label A

270

Label C

206

Label B

170

Label D

117

Label G

102

Label E

47

Label F

27

Label A++

6

Label A+

4

Label A+++

2

Label A++++

0

Label A+++++

0

Average energy consumption per year

Average energy consumption per year in Oentsjerk
Year Gas (m3) Electricity (kWh)
2020 1.326 2.553
2021 1.497 2.558
2022 1.173 2.440
2023 993 2.413
2024 952 2.526

Consumption per house type

Hoekwoning

Gas: 900 • Electricity: 1.628

Huurwoning

Gas: 725 • Electricity: 1.562

Koopwoning

Gas: 1.147 • Electricity: 2.880

Appartement

Gas: 593 • Electricity: 1.614

Tussenwoning

Gas: 977 • Electricity: 1.915

Vrijstaande woning

Gas: 1.251 • Electricity: 3.349

Twee-onder-één-kap woning

Gas: 996 • Electricity: 2.518

Business activity in Oentsjerk (2025)

Handel en HORECA 35
Nijverheid en energie 40
Zakelijke dienstverlening 55
Overheid, onderwijs en zorg 45
Landbouw, bosbouw en visserij 5
Vervoer, informatie en communicatie 10
Financiele diensten en onroerendgoed 10
Cultuur, recreatie en overige diensten 20

Total number of company establishments: 230

Recent crime statistics

Recent crime statistics in Oentsjerk
Period Crimes
jan 2025 2
jan 2026 1
jul 2025 3
jun 2025 3
mei 2025 1
mrt 2025 2
nov 2024 3
nov 2025 4
okt 2024 3
okt 2025 0
sep 2024 3
sep 2025 1

These figures give an indicative picture of safety trends in the living environment of Oentsjerk.

Frequently asked questions about living in Oentsjerk

Short answers based on current local statistics, handy for a quick comparison of the living environment.

Hoeveel inwoners heeft Oentsjerk?

Oentsjerk telt in 2025 ongeveer 2.065 inwoners.

Wat is de gemiddelde WOZ-waarde in Oentsjerk?

De gemiddelde WOZ-waarde in Oentsjerk is in 2025 circa € 293.099.

Wat is het gemiddelde inkomen per inwoner in Oentsjerk?

Het gemiddelde inkomen per inwoner in Oentsjerk ligt rond € 27.783 per jaar.

Hoe veilig is wonen in Oentsjerk?

Voor het huidige jaar gaat het om ongeveer 33 geregistreerde misdrijven. Gebruik deze cijfers als indicatie en vergelijk trends per periode.

Welke woningtypen komen het meest voor in Oentsjerk?

In Oentsjerk komt vooral "Vrijstaande woningen" veel voor, met ongeveer 276 woningen.

Receive free, non-binding quotes

Compare multiple real estate agents and choose the best match.