- Under consideration
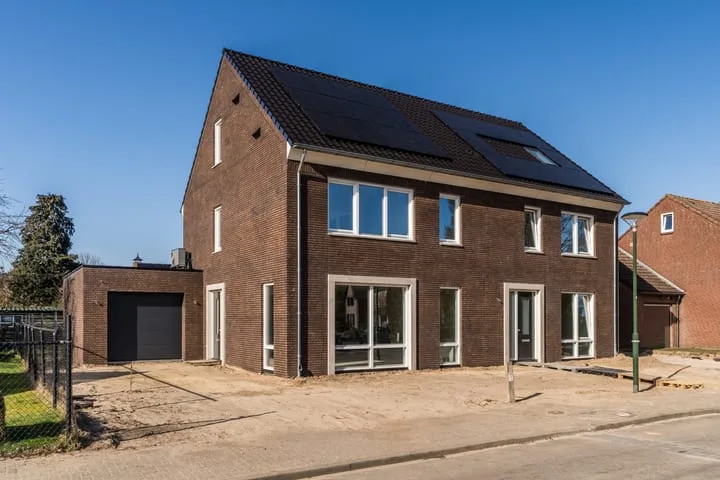
Marialaan 17
5724AB Ommel
€ 465.000 k.k.
€ 3.661/m²
C
Save as favorite
- Living area
- 127 m²
- Land area
- 393 m²
- Bedrooms
- 3