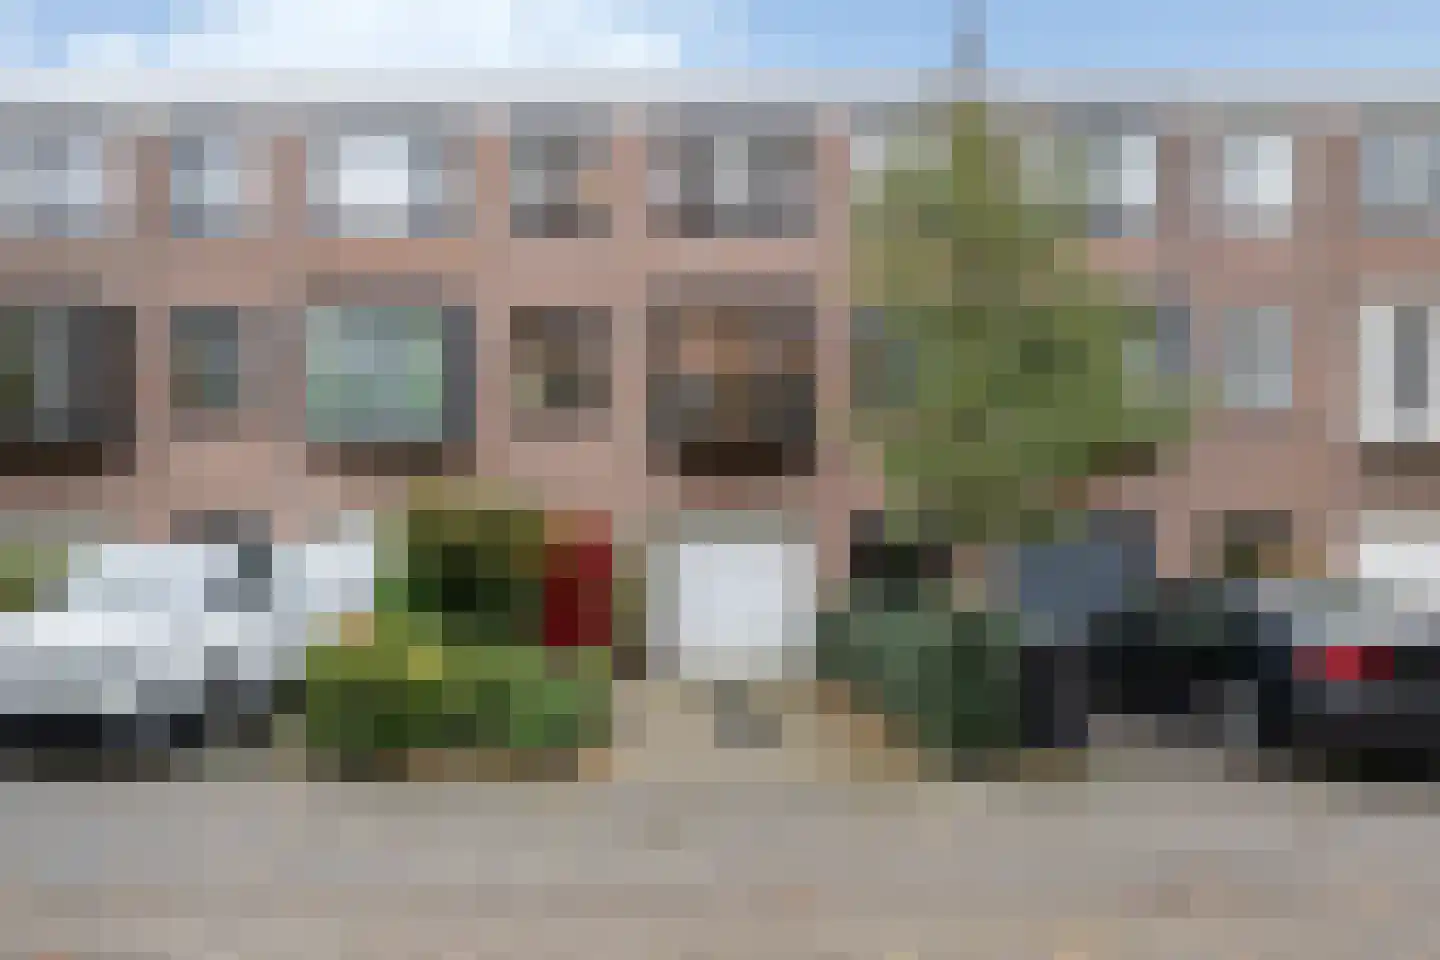
- Sold
Alverno 26
4731TW Oudenbosch
€ 324.000 k.k.
€ 2.892/m²
- Living area
- 112 m²
- Land area
- 101 m²
- Bedrooms
- 4
View 108 sold houses in Oudenbosch
Type to search. Use arrow down and arrow up to navigate through results and press Enter to open.
Hidden search suggestions.
Compare sold homes in Oudenbosch or view the current offering in this location directly.
On this page you will find recently sold homes in Oudenbosch. Use this overview to better estimate selling prices, popular neighborhoods, and the local housing supply before you choose a real estate agent. Also view the current housing supply with 187 houses in Oudenbosch.
4731TW Oudenbosch
€ 324.000 k.k.
€ 2.892/m²
4731XH Oudenbosch
€ 489.000 k.k.
€ 3.372/m²
4731HR Oudenbosch
€ 389.000 k.k.
€ 4.228/m²
4731JH Oudenbosch
€ 250.000 k.k.
€ 4.166/m²
4731VS Oudenbosch
€ 385.000 k.k.
€ 3.130/m²
4731HA Oudenbosch
€ 250.000 k.k.
€ 2.941/m²
4731AK Oudenbosch
€ 340.000 k.k.
€ 3.578/m²
4731HW Oudenbosch
€ 400.000 k.k.
€ 4.124/m²
4731TW Oudenbosch
€ 328.500 k.k.
€ 2.933/m²
4731GC Oudenbosch
€ 335.000 k.k.
€ 2.939/m²
4731VM Oudenbosch
€ 325.000 k.k.
€ 3.125/m²
4731DX Oudenbosch
€ 450.000 k.k.
€ 3.629/m²
4731JV Oudenbosch
€ 300.000 k.k.
€ 3.488/m²
4731TL Oudenbosch
€ 299.000 k.k.
€ 3.180/m²
4731XG Oudenbosch
€ 850.000 k.k.
€ 4.292/m²
4731DL Oudenbosch
€ 575.000 k.k.
€ 6.389/m²
4731BX Oudenbosch
€ 330.000 k.k.
€ 3.626/m²
4731TW Oudenbosch
€ 417.000 k.k.
€ 4.964/m²
4731MS Oudenbosch
Price upon request
4731AN Oudenbosch
€ 425.000 k.k.
€ 3.512/m²
4731GK Oudenbosch
€ 315.000 k.k.
€ 3.795/m²
4731DB Oudenbosch
€ 475.000 k.k.
€ 4.025/m²
4731DL Oudenbosch
€ 575.000 k.k.
€ 6.460/m²
4731TP Oudenbosch
€ 1.195.000 k.k.
€ 3.356/m²
4731LT Oudenbosch
€ 795.000 k.k.
€ 5.162/m²
4731MM Oudenbosch
€ 404.000
€ 3.394/m²
4731RD Oudenbosch
€ 389.000 k.k.
€ 4.523/m²
4731DN Oudenbosch
€ 650.000 k.k.
€ 2.863/m²
Bekijk recente verkopen en ontvang gratis offertes van lokale verkoopmakelaars in Oudenbosch.
Recent verkocht in Oudenbosch? Lees de verkoopgerichte gids huis verkopen in Oudenbosch, vergelijk verkoopmakelaars in Oudenbosch of bekijk de beste verkoopmakelaars in Oudenbosch voor referentie bij jouw keuze.
Makelaars maken scherpere voorstellen als ze weten dat je vergelijkt — vraag offertes aan voor verkoop of aankoop.
Short answers about housing prices, sold homes and comparing real estate agents in Oudenbosch.
The costs of a real estate agent in Oudenbosch vary per office, property type and sales approach. Therefore, compare multiple quotes and also look at the real estate agents in Oudenbosch to better compare rates, presentation and local experience.
On this page we currently show 108 sold houses in Oudenbosch from our selection. This helps you to better assess recent transactions and the local housing market.
Houses sold in Oudenbosch give insight into asking prices, house types and neighborhoods where recent transactions have taken place. Compare this also with the current housing stock in Oudenbosch to better understand the market.
Je kunt verkochte woningen gebruiken als eerste marktindicatie, maar een lokale makelaar kan beter rekening houden met afwerking, ligging, onderhoud en actuele vraag in Oudenbosch. Plan de volgende stap via de gids huis verkopen in Oudenbosch.
Vergelijk makelaars in Oudenbosch op lokale verkoopervaring, reviews, verwachte opbrengst, courtage en marketingaanpak. Bekijk verkoopmakelaars in Oudenbosch of de top 10 makelaars in Oudenbosch om snel sterke kantoren te ontdekken.
View current location data on residents, WOZ development, housing stock, energy consumption, business activity and safety in Oudenbosch. In 2025 were there 13.810 residents. The average WOZ value in 2025 is EUR 337.000.
These figures help to better assess and compare the housing stock in Oudenbosch with recent sold homes. Orient yourself then on suitable top real estate agents in Oudenbosch for sales advice in this region.
Residents
13.810
Last year: 2025
Average WOZ
EUR 337.000
Last year: 2025
Average income per person.
EUR 31.200
Source: AllNumbers
Crimes (current year)
517
Total registered
| Year | Residents |
|---|---|
| 2021 | 13.375 |
| 2022 | 13.525 |
| 2023 | 13.665 |
| 2024 | 13.760 |
| 2025 | 13.810 |
| Year | Average WOZ |
|---|---|
| 2021 | EUR 247.000 |
| 2022 | EUR 266.000 |
| 2023 | EUR 300.000 |
| 2024 | EUR 315.000 |
| 2025 | EUR 337.000 |
Hoger
2.200
Praktisch
3.560
Middelbaar
4.340
Europa
1.695
Nederland
9.710
Buiten Europa
2.400
Label A
1.883
Label C
1.413
Label B
1.112
Label D
490
Label E
331
Label G
319
Label F
309
Label A+++
80
Label A+
79
Label A++
39
Label A++++
30
Label A+++++
0
| Year | Gas (m3) | Electricity (kWh) |
|---|---|---|
| 2020 | 1.230 | 2.890 |
| 2021 | 1.370 | 2.900 |
| 2022 | 1.060 | 2.750 |
| 2023 | 900 | 2.640 |
| 2024 | 880 | 2.720 |
Hoekwoning
Gas: 940 • Electricity: 2.580
Huurwoning
Gas: 770 • Electricity: 2.020
Koopwoning
Gas: 1.000 • Electricity: 3.130
Appartement
Gas: 640 • Electricity: 1.720
Tussenwoning
Gas: 810 • Electricity: 2.380
Vrijstaande woning
Gas: 1.260 • Electricity: 4.010
Twee-onder-één-kap woning
Gas: 1.010 • Electricity: 3.170
Total number of company establishments: 1.655
| Period | Crimes |
|---|---|
| jan 2026 | 42 |
| jul 2025 | 41 |
| jun 2025 | 36 |
| mei 2025 | 43 |
| mrt 2025 | 37 |
| mrt 2026 | 45 |
| nov 2024 | 41 |
| nov 2025 | 36 |
| okt 2024 | 41 |
| okt 2025 | 35 |
| sep 2024 | 57 |
| sep 2025 | 50 |
These figures give an indicative picture of safety trends in the living environment of Oudenbosch.
Short answers based on current local statistics, handy for a quick comparison of the living environment.
Oudenbosch telt in 2025 ongeveer 13.810 inwoners.
De gemiddelde WOZ-waarde in Oudenbosch is in 2025 circa € 337.000.
Het gemiddelde inkomen per inwoner in Oudenbosch ligt rond € 31.200 per jaar.
Voor het huidige jaar gaat het om ongeveer 517 geregistreerde misdrijven. Gebruik deze cijfers als indicatie en vergelijk trends per periode.
In Oudenbosch komt vooral "Tussenwoningen" veel voor, met ongeveer 2.442 woningen.