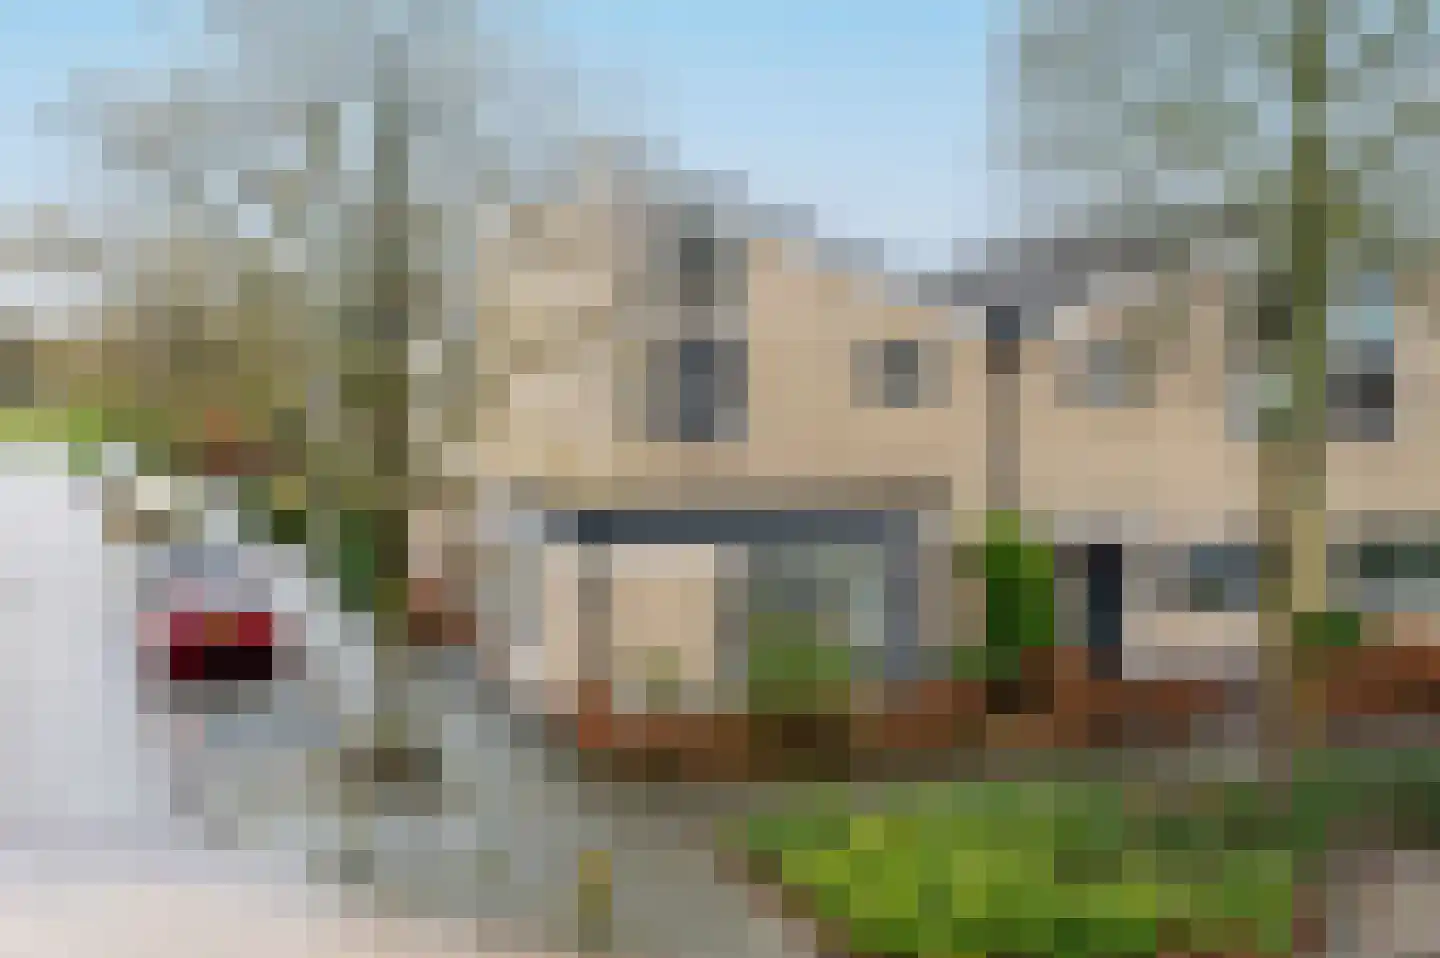
Houses sold in Putten

View 241 sold houses in Putten

Connected to: Vastgoed Nederland NVM Makelaars

On this page you will find recently sold homes in Putten. Use this overview to better estimate selling prices, popular neighborhoods, and the local housing supply before you choose a real estate agent. Also view the current housing supply with 361 houses in Putten.

Selection

Search and filter homes

Set your preferences and discover homes that suit you.

Total supply 240.715
Filters

Set price, area and other characteristics. Adjust a filter or click on Show homes. Location changes directly above.

Reset filters

You search for

  • Place Putten
  • Status Sold

Selling a home in Putten? Compare realtor offers

Get free quotes from realtors with local market knowledge in Putten.

Free request a quote

  • Quotes in Putten
  • Non-binding
  • Personal
  • Free property website

Selling a home in Putten? Compare real estate agents who know the local housing market. Also check out all real estate agents in Putten or the top 10 real estate agents in Putten for extra context for your choice.

Save an average of €5000,-

By comparing brokers and requesting quotes

Frequently asked questions about sold homes in Putten

Short answers about housing prices, sold homes and comparing real estate agents in Putten.

Residential and neighborhood statistics in Putten

View current location data on residents, WOZ development, housing stock, energy consumption, business activity and safety in Putten. In 2026 were there 25.169 residents. The average WOZ value in 2025 is EUR 517.000.

These figures help to better assess and compare the housing stock in Putten with recent sold homes. Orient yourself then on suitable top real estate agents in Putten for sales advice in this region.

Residents

25.169

Last year: 2026

Average WOZ

EUR 517.000

Last year: 2025

Average income per person.

EUR 33.000

Source: AllNumbers

Crimes (current year)

571

Total registered

Demographics and WOZ development

Inhabitants per year

Inhabitants per year in Putten
Year Residents
2022 24.598
2023 24.904
2024 24.978
2025 24.953
2026 25.169

Annual WOZ value

WOZ value per year in Putten
Year Average WOZ
2021 EUR 367.000
2022 EUR 412.000
2023 EUR 489.000
2024 EUR 485.000
2025 EUR 517.000

Composition of residents

Age build-up

65+: 5.523 0-15: 4.178 15-25: 3.022 25-45: 5.545 45-65: 6.685

Education level

Hoger

25

Praktisch

31

Middelbaar

44

Origin of residents (2025)

Europa

956

Nederland

22.403

Buiten Europa

1.594

Housing stock and construction periods

Types of homes

Hoekwoningen 1.449
Appartementen 1.755
Tussenwoningen 2.512
Vrijstaande woningen 3.253
Twee-onder-één-kap woningen 1.622

Construction period of buildings

Voor 1700 7
1700 tot 1900 173
1900 tot 1925 285
1925 tot 1950 1.089
1950 tot 1970 2.236
1970 tot 1980 1.934
1980 tot 1990 1.681
1990 tot 2000 1.471
2000 tot 2010 1.232
2010 tot 2020 914
2020 en later 540

Energy and sustainability

Energy label distribution

Label C

2.938

Label A

2.864

Label B

1.643

Label D

1.112

Label G

908

Label F

770

Label E

483

Label A+++

282

Label A+

110

Label A++

100

Label A++++

93

Label A+++++

2

Average energy consumption per year

Average energy consumption per year in Putten
Year Gas (m3) Electricity (kWh)
2020 1.380 3.290
2021 1.550 3.360
2022 1.200 3.170
2023 990 3.000
2024 960 3.090

Consumption per house type

Hoekwoning

Gas: 880 • Electricity: 2.730

Huurwoning

Gas: 750 • Electricity: 2.220

Koopwoning

Gas: 1.110 • Electricity: 3.380

Appartement

Gas: 540 • Electricity: 1.790

Tussenwoning

Gas: 770 • Electricity: 2.500

Vrijstaande woning

Gas: 1.410 • Electricity: 4.020

Twee-onder-één-kap woning

Gas: 1.080 • Electricity: 3.250

Business activity in Putten (2025)

Handel en HORECA 680
Nijverheid en energie 740
Zakelijke dienstverlening 880
Overheid, onderwijs en zorg 415
Landbouw, bosbouw en visserij 305
Vervoer, informatie en communicatie 190
Financiele diensten en onroerendgoed 270
Cultuur, recreatie en overige diensten 290

Total number of company establishments: 3.770

Recent crime statistics

Recent crime statistics in Putten
Period Crimes
jan 2025 54
jan 2026 38
jul 2025 66
jun 2025 45
mei 2025 54
mrt 2025 36
nov 2024 63
nov 2025 44
okt 2024 60
okt 2025 43
sep 2024 47
sep 2025 44

These figures give an indicative picture of safety trends in the living environment of Putten.

Frequently asked questions about living in Putten

Short answers based on current local statistics, handy for a quick comparison of the living environment.

Hoeveel inwoners heeft Putten?

Putten telt in 2026 ongeveer 25.169 inwoners.

Wat is de gemiddelde WOZ-waarde in Putten?

De gemiddelde WOZ-waarde in Putten is in 2025 circa € 517.000.

Wat is het gemiddelde inkomen per inwoner in Putten?

Het gemiddelde inkomen per inwoner in Putten ligt rond € 33.000 per jaar.

Hoe veilig is wonen in Putten?

Voor het huidige jaar gaat het om ongeveer 571 geregistreerde misdrijven. Gebruik deze cijfers als indicatie en vergelijk trends per periode.

Welke woningtypen komen het meest voor in Putten?

In Putten komt vooral "Vrijstaande woningen" veel voor, met ongeveer 3.253 woningen.

Gratis vrijblijvende offertes ontvangen

Vergelijk meerdere makelaars en kies de beste match.